Kusdiantoro* | Ahmad Fahrudin | Sugeng Hari Wisudo | Bambang Juanda
© 2020 IIETA. This article is published by IIETA and is licensed under the CC BY 4.0 license (http://creativecommons.org/licenses/by/4.0/).
OPEN ACCESS
This study aims to compile a composite index from economic, social, ecology and institutional dimensions of sustainable capture fisheries. Use of primary and secondary data. Different methods of data analysis used in this study include priority analysis, key component analysis (PCA), analysis of structural equation modeling (SEM), and analysis of flag modeling. The results show that the main priorities in capturing fisheries development were determined by the social and ecology dimensions. The sensitivity analysis results indicate that all indicators on the institutional level have a higher sensitivity compared with other indicators. Thus, Indonesia's current development of catch fisheries is in the "moderate" sustainability status. In order to attain sustainable fisheries production in the future, it must take significant account of ecology and social indicators and issues.
capture fisheries, dimension, index, indicator, sustainable
The exploitation of fisheries resources was already carried out in such a way that it affects all the parties involved in the fishing sector, ranging from resource reserves to the fishing industry, fish processing and food supply. Development of fishing industry commonly faced by several developing countries is how to balance economic and ecological objectives or the sustainability of the fish stock [1, 2]. Fisheries management should focus on exploitation activities that cause degradation due to trade-offs between the economy and the ecology. Therefore, it is essential to recognize the balancing of all dimensions, including the integrated economic and ecology aspects, to achieve sustainable fisheries [3, 4]. Sustainable development has a minimum requirement, including the availability of natural capital stock to be maintained so that the quality and quantity do not decrease in a period [5, 6].
Fish resources has limitations in its recovery cycle [7], The sustainability of the ecological system was a significant consideration because it was related to the resource recovery cycle [8, 9]. The principle of business sustainability becomes a foundation in the development of capture fisheries to realize sustainable resource management. Strategic issues and general problems in the realization of sustainable fishing include the weakness of catch management in Indonesia, in addition to decreasing production in some areas is an indicator of over-exploited status [10].
So far, performance indicators that represent the utilization status and benchmarks of Indonesia sustainable fisheries development achievements are not yet available. The existence of this indicator serves as a guideline for monitoring and assessing the implementation of Indonesia capture fisheries development. The existing indicators do not represent the capture fisheries performance because they are limited to economic dimensions only, because economic indicators are easier to quantify by numbers than other dimensions [11, 12], so it does not consider ecology, social and institutional dimensions. The measurement of the economic impact of existing development relies more heavily on the gross domestic product, labor income, and employment [13]. It is also important to include indicators of other dimensions. Its necessity, by identifying indicators that are immediately available and easy to measure. Based on this background, research related to sustainable capture fisheries development indicators is appropriate and necessary, considering its importance to describe capture fisheries development comprehensively. This study aims to develop a composite index of sustainable capture fisheries development from economic, social, ecology, and institutional dimensions. This study also examines the sensitivity and the relationship of the selected indicators with the performance of sustainable capture fisheries development. It produces an index of development that can describe the achievement of sustainable capture fisheries.
2.1 Study area
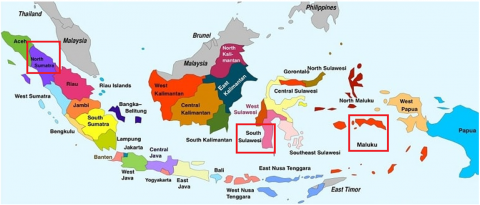
The fisheries management area in Indonesia consists of 11 fishery management areas (FMAs). This research conducting in three regions in Indonesia (western, central, and eastern) with the highest contribution of fish catch production in their area, namely: North Sumatra representing the western region of Indonesia (located at FMA 571 and FMA 572), South Sulawesi representing Central Indonesia (FMA 713 and FMA 714), and Maluku representing Eastern region of Indonesia. All three may provide representation in Indonesia's catch development conditions for fisheries (Figure 1). The study was conducted in March-August 2019.
2.2 Study design
In this study the type of data used is primary and secondary data. Primary data from field observations, focus group discussions (FGD) and in-depth interviews with stakeholders involved in fishing. Stakeholders come from the Ministry of Marine Affairs and Fisheries, 3 (three) provinces Marine Affairs and Fisheries Local Office, Regional People's Representative Assembly (DPRD), financial institutions, fisheries organizations, fishers, researchers and academics, fisheries entrepreneurs, and NGOs. In contrast, secondary data was collected through a desk study and collected from several related agencies. Secondary data collected consists of time-series data, publications, and other related documents that support the research objectives collected from statistic reports and Indonesia national reports.
The development of a sustainable capture fisheries development index is a combination of several indicators. Selected indicators are indicators that apply globally to assess sustainable development, several previous studies and development objectives as mandated by Law Number 23 of 2014. The indicator consists of four dimensions of sustainable development, e.g., economic, social, ecology and institutional [14]. The formulation of indicators in research which was modified in three stages [15], namely self-validation (done by the researchers themselves), scientific validation (independent expert judgment) and social validation (public participation).
Figure 1. Study area (source: Peta-hd.com)
Several stages of analytical methods used to compile a composite index of sustainable capture fisheries development, which consists of: (1) Preparation of performance indicators starting with self-validation (desk study) using priority analysis to determine the priority dimensions and indicators in each dimension, (2) The results of self-validation from priority analysis is then tested with scientific validation using principal component analysis (PCA) to classify indicators with the categories of Good Representation (GR) and Poor Representation (PR) [15], and (3) The relationship between dimensions and index developing priority indicators is assessed using structural equation modeling (SEM) using partial minimum square (PLS) indicators on path diagrams with an external load value of less than 0.7 to obtain a structural model [16, 17], and (4) The impact value of an outcome compared to the reference value using flag modeling analysis [18]. The status of sustainable fisheries development known by analyzing each value of the indicators and dimensions using simple compositional analysis based on the arithmetic mean.
2.3 Data analysis
2.3.1 Priority analysis
Priority analysis was used to establish performance priorities based on the weight of the choice of assessment. The assessment was divided into five weights (bands) for each performance (Table 1) [19]. The measurement of the percentage on the performances level is carried out based on the weighted range agreed upon through an FGD between experts where the range has a difference between levels, especially at level 3 which has the most extensive range.
Table 1. Percentage of performance by weight of assessment in indicators of sustainable capture fisheries development
|
Performances level |
Weight |
Descriptions |
|
< 10% |
1 |
Quite low on average |
|
11% - 30% |
2 |
Just underneath the average |
|
31% - 70% |
3 |
Average in general |
|
71% - 90% |
4 |
Well above average |
|
91% - 100% |
5 |
Significantly higher than average |
In determining the total indicator score (TIS) the Eq. (1) is used:
$\sum_{i=0}^{5} T I S=f_{i} B_{i}$ (1)
where,
$f_{i}$= Frequency of choice of expert weight and capture fisheries stakeholders to i;
$B_{i}$= Band (weight) rating to i;
i = 0,1,2, ..., 5.
If the weighting of priority indicators for fishing catches has gained, the results before and after the FGD will be analysed to identify the opinions of fisheries experts and fisheries practitioners who are given priority in the determination of sustainable fisheries catchment performance indicators, where equality of achievement is of calibre (Pk):
$\mathrm{Pk}=\mathrm{SIT} / \mathrm{n}$ (2)
where,
n = Number of respondents who gave choices.
2.3.2 Principal component analysis (PCA)
This research is a statistical technique that transforms a set of variables linearly into new variables, smaller but more representative and not orthogonal. The PCA method can be formulated as follows, mathematically [20]:
$\mathrm{PC} 1=\alpha 11 \mathrm{X} 1+\alpha 12 \mathrm{X} 2+\ldots+\alpha 1 \mathrm{pXp}$
$\mathrm{PC} 2=\alpha 21 \mathrm{X} 1+\alpha 22 \mathrm{X} 2+\ldots+\alpha 2 \mathrm{p} \mathrm{Xp}$
$\mathrm{PCn}=\alpha \mathrm{n} 1 \mathrm{X} 1+\alpha \mathrm{n} 2 \mathrm{X} 2+\ldots+\alpha \mathrm{n} \mathrm{pXp}$ (3)
where,
PC1, PC2, PCn: Principal Component of each variable;
α: Regression coefficient of each variable (X1, X2, Xp);
X1, X2, Xp: Variable/indicator;
P: number of variable/indicator.
2.3.3 Structural equation modelling (SEM)
In this study, the SEM uses a partial least square (PLS) design, which represents a structural model [16]. In this study, the four (economic, ecological, social, and institutional) dimensions of development have an effect (linked) on "Sustainable Capture Fisheries Development" in accordance with the established theory. Economic Dimension Variables (X1), Ecological Dimensions (X2), Social Dimensions (X3), Institutional Dimensions (X4) and "Sustainable Fishing Development" (Y) variables are latent variables or variables that cannot be accurately measured but can still be measured indirectly through the "Confirmatory Factor Analysis" indicator variables. All indicators showed at Table 2.
SEM with PLS estimates the 'loading' of manifesto or indicator variables for latent exogenous variables estimated on the basis of latent endogenous variables not provided with covariance-based SEM latent variables. Therefore 'loadings' add to the coefficient of flight. PLS-SEM gives reforms to data which are not distributed normally. This is different from covariance-based SEM, which many people are aware of is that normal data is central to the process. Hence, apart from SEM, PLS-SEM is a covariantly based alternative procedure, as we often find that the data to be done is not normally distributed in practice / reality. So, we will check first what our data distribution is before using this method. However, normally distributed data can also be used in PLS-SEM, as we use covariant SEM data [17].
2.3.4 Flag modelling analysis
The flag analysis is analyzed and compared to the CTV (Critical Threshold Value) which is the result of unit criteria in the impact analysis [18]. Indicators which become the analytical unit are indicators calculated from the results of the tiered results of the previous analytical point. CTV values are calculated based on government-based sources, field observations, interview findings, FGDs, questionnaires and secondary data availability. Poor grades reflect the most disadvantageous sustainable management conditions, while excellent grades reflect the most favorable sustainable management conditions. The composite index can be formulated as follows [20]:
CAi = f (CAni...n=1,2,3...m) (4)
C-Di= f (CAiy...y = 1,2,3...z; z = 1,2,3...m) (5)
where,
CAi = i- dimensional composite index
Di = i-dimensions
iy = y-indicator
z = number of indicators (1,2,3...m)
Table 2. Longlist of indicators for sustainable capture fisheries development
|
No |
Dimension |
References*) |
|
Economy (X1) |
|
|
|
X11 |
Fishermen income |
[21, 22] |
|
X12 |
Capture fisheries household income |
[23] |
|
X13 |
Fisherman exchange rate |
[23] |
|
X14 |
Investment |
[21-23] |
|
X15 |
Capital |
[24, 25] |
|
X16 |
Trade balance |
[21, 22] |
|
X17 |
Non-tax state revenue (NTSR) value of capture fisheries sector |
[26, 27] |
|
X18 |
Contribution of GDP or GRDP in fisheries |
[21, 22] |
|
X19 |
Budget allocation for capture fisheries |
[28] |
|
|
|
|
X21 |
Catch productivity |
[21] |
|
X22 |
Fishing trips |
[23, 22] |
|
X23 |
Resources stock status |
[22] |
|
X24 |
Level of utilization of fish resources |
[27] |
|
X25 |
Ratio of the number of fish catches (FMA towards the national) |
[22] |
|
X26 |
Traceability of the production chain |
[29, 30] |
|
X27 |
Certification of capture |
[23] |
|
X28 |
Percentage of area of marine conservation area |
[22] |
|
|
|
|
X31 |
Health insurance |
[20, 22, 31] |
|
X32 |
Education |
[21, 20, 22, 32] |
|
X33 |
Protection of small-scale fishermen |
[33, 30] |
|
X34 |
Labor |
[21, 22] |
|
X35 |
Fisheries dependence |
[34] |
|
X36 |
Fisheries conflicts |
[23, 34] |
|
X37 |
Public services |
[21] |
|
|
|
|
X41 |
Percentage of community business group (CBG) to total number of fishermen |
[35-37] |
|
X42 |
Percentage of fisheries management policies |
[23, 32] |
|
X43 |
Number of regulation products |
[23] |
|
X44 |
The suitability of the capture fisheries development program to the RPJMN |
[32] |
|
X45 |
Percentage of research budget related to capture fisheries to GDP |
[32] |
|
X46 |
Gender equality |
[20] |
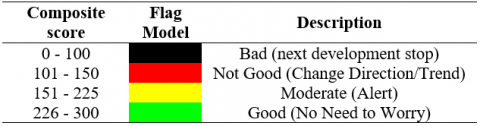
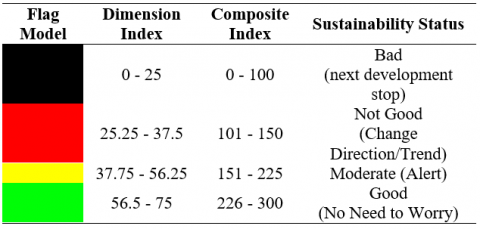
Any indicator assessed will be evaluated using a simple composite analysis based on the average arithmetic which is then displayed as a flag model with criteria (Table 3):
Table 3. Visualization of the flag model for sustainability status
3.1 Priority dimensions for sustainable capture fisheries development
Measurement of Indonesia capture fisheries development performance still oriented towards the economic dimension, reflected in the indicators used that consist of GDP growth, the fisherman exchange rate (NTN), production, and income of fishers. The meaning of development that involves the interrelationship between economic and non-economic factors to improve welfare, so this definition emphasizes that development does not only depend on economic factors. The economic development in Indonesia has not been evenly distributed and has not been able to answer ecology problems [20].
The formulation of performance indicators of capture fisheries development carried out on 30 indicators, resulting from the identification of more than 100 indicators identified from global, national, local indicators and the results of previous studies taking into account the availability and accuracy of data in all fisheries management areas in Indonesia. These 30 indicators were chosen, accepted in the FGD, and used for further analysis. All data used to represent indicators were data which are easily accessible and available. These data are published on a frequently every year from national statistical data. The indicator longlist was covering four dimensions (Table 1) and selecting based on the SMART principle (Specific, Measurable, Attainable, Realistic, and Timely). Catch productivity is one indicator in the ecological dimension because it can provide an overview of the productivity of the fishing vessel or fishing gear used. The fishing trip illustrates the fishing effort that is putting pressure on resources. Fishing trip indicators can mean restrictions of efforts, vessels, type and number of gears, and fishing license or fishing traceability concern at the international level. The social and institutional dimensions have a broad scope. This research limited to the indicators that are built by the commission on sustainable development (CSD) by the United Nations [15, 31]. Indicators of health insurance and protection of small-scale fishers are indicators of the social dimension as is mandated in the Republic of Indonesian Act No. 7/2016 concerning Law on the Protection and Empowerment of Fishers, Fishing Resources, and Salt Farmers. Health insurance in the form of fishermen's access to health services and health insurance. Small-scale fishermen protection listed in Law No. 7 of 2016 is in the form of business protection (lost or damaged fishing facilities) and work accidents.
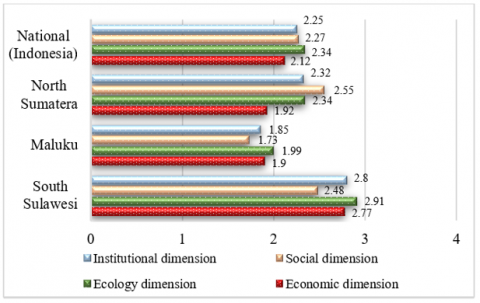
Based on the results of the priority analysis, the ecological dimension is known to become a prime concern at the national level. As well as in the provinces of South Sulawesi and Maluku which made the ecological dimension the top priority, while for the Province of North Sumatra the social dimension became the top priority. Meanwhile, both at the national level and in the three provinces of capture fisheries centers, the economic dimension is becoming the last priority of a measurement tool for sustainable capture fisheries development performance (Figure 2).
Figure 2. Dimensional priorities at the provincial and national level
When compared with the main performance indicators of fisheries development in several countries in ASEAN, it is known that these countries are more focused on economic and ecological dimensions than social and institutional. The results of the analysis in this study show different things, especially for Indonesia, where the ecological and social dimensions are the top priority in measuring the performance of sustainable capture fisheries development. Capture fisheries development in several ASEAN countries (Malaysia, Thailand, Philippines, Cambodia, Laos, Vietnam, and Myanmar) have in common, namely establishing production achievements as the main performance indicator. Fisheries performance measurement in several ASEAN countries is not different from the current condition of Indonesia which focuses on economic aspects, such as increased production and export value, and fish consumption. It shows that fisheries development is only seen as a source of economic growth by increasing production, consumption, investment, and the export-import trade balance. This happens due to differences in the way of viewing the fisheries sector as a primary sector that connotes production alone. The fisheries sector is not only an economic activity but is also directly related to the elements in it, such as ecology and social [14].
Priority analysis determined the five most priority indicators for each dimension as a measure of the performance of sustainable capture fisheries development. The results of the analysis show that at the national and provincial level selected indicators related income (fishermen income and household income) in the economic dimension are the priority that can be used to measure the performance of capture fisheries development. This indicates that the fishermen welfare and their families is a measure of the success of the development that has been carried out. In the ecological dimension there are similarity indicators for each location, where indicators of productivity, fishing trips, resources stock status, and level of resource utilization rate are the priority indicators. However, for measuring the sustainable capture fisheries development in Maluku Province, the percentage of conservation area has become a priority indicator and is different from the other two regions. Based on data [38], Maluku Province has 3 (three) different fishery management areas (714, 715, 718) with a total area of the water conservation area of 3,600,149.44 Ha or 40% of the total area of the Indonesian water conservation zone (9,107,723.71 Ha).Based on the Regulation of the Minister of Marine Affairs and Fisheries (PermenKP) No. 4 of 2015 concerning the Fishing Prohibition in Fisheries Management Areas in the Republic of Indonesia 714 states that everyone is prohibited from fishing in parts of FMA 714 which is a buffer zone and tuna spawning area of the Thunnus albacores type. The impact of the policy and the existence of conservation areas in FMA 714 was felt positively by fishermen in Maluku Province who have the main target of tuna. This has become one of the drivers why the percentage of marine conservation area indicator is a priority to measure the success of capture fisheries development in Maluku Province. While the institutional dimension is not much different from the social dimension, where there are similarity indicators that are priorities in each selected location to measure the performance of capture fisheries development, where the four indicators are the main priority, both at the national level and selected locations, namely the percentage indicator of the number of CBG to the number of fishermen, the percentage of fisheries management policies, the number of regulation products related to capturing fisheries and the percentage of specific fisheries development strategies compared to development in other sectors. Measurement of development performance in North Sumatra Province puts forward the social dimension compared to other dimensions, because the level of capture fisheries conflicts is more prevalent in this region.
3.2 Representation and relationship of priority indicators in sustainable capture fisheries development
The fisheries indicators of sustainable capture fisheries development are prepared through a tiered selection or selection process, starting from the self-validation stage, and then selecting scientific validation using the PCA method. All indicators have a positive correlation that can represent the performance of sustainable capture fisheries development. The results of the PCA analysis group the indicator longlist into two main groups. Group 1 (PC1) shows indicators with the category of "good representation" and group 2 (PC2) shows indicators with the category "poor representation". The results of the previous analysis (priority analysis) show that the economic dimension is the last priority in measuring the performance of sustainable capture fisheries development at state level. The economic dimension is no longer a major factor in measuring the success of sustainable capture fisheries development. These results are in line with the results of the PCA, where all indicators on the economic dimension have a category of poor representation (Table 4) or it is assumed that the measurement of economic development of capture fisheries has shifted to other dimensions (ecological and social) in measuring the performance of sustainable development, because the measurement puts forward indicators economic indicators do not provide a real picture of development achievements. Discrepancies in measuring the performance of sustainable development-oriented towards the economic dimension are found in development in other sectors, such as agriculture. The emphasis on development with economic goals has an impact on ecology damage and social problems [39].
Table 4. Priority and representation of performance indicators of national-level sustainable capture fisheries development
|
Dimension |
SIT |
PK |
SP |
PCA |
|
|
X1 |
Economy |
||||
|
X11 |
Fishermen income |
211 |
2.51 |
1 |
PR |
|
X12 |
Fishermen household income |
194 |
2.31 |
2 |
PR |
|
X13 |
Fisherman exchange rate |
178 |
2.12 |
5 |
PR |
|
X14 |
Investment |
169 |
2.01 |
7 |
PR |
|
X15 |
Capital |
162 |
1.93 |
8 |
PR |
|
X16 |
Trade balance |
156 |
1.86 |
9 |
PR |
|
X17 |
Non-tax state revenue (NTSR) value from capture fisheries sector |
181 |
2.15 |
3 |
PR |
|
X18 |
Contribution of GDP or GRDP in fisheries |
180 |
2.14 |
4 |
PR |
|
X19 |
Budget allocation for capture fisheries |
173 |
2.06 |
6 |
PR |
|
|
Average |
2.12 |
|||
|
X2 |
Ecology |
||||
|
X21 |
Catch productivity |
224 |
2.67 |
2 |
GR |
|
X22 |
Fishing trips |
211 |
2.51 |
3 |
GR |
|
X23 |
Status of fish resource utilization |
224 |
2.67 |
2 |
GR |
|
X24 |
Level of utilization of fish resources |
225 |
2.68 |
1 |
GR |
|
X25 |
Ratio of the number of fish catches (FMA towards the national) |
189 |
2.25 |
4 |
GR |
|
X26 |
Traceability of the production chain |
166 |
1.98 |
6 |
GR |
|
X27 |
Certification of capture |
154 |
1.83 |
7 |
GR |
|
X28 |
Percentage of area of conservation area |
180 |
2.14 |
5 |
GR |
|
|
Average |
2.34 |
|||
|
X3 |
Social |
||||
|
X31 |
Health insurance |
189 |
2.25 |
4 |
GR |
|
X32 |
Education |
172 |
2.05 |
6 |
GR |
|
X33 |
Protection of small-scale fishermen |
195 |
2.32 |
2 |
GR |
|
X34 |
Labor |
216 |
2.57 |
1 |
GR |
|
X35 |
Fisheries dependence |
191 |
2.27 |
3 |
GR |
|
X36 |
Fisheries conflicts |
186 |
2.21 |
5 |
PR |
|
X37 |
Public services |
186 |
2.21 |
5 |
GR |
|
|
Average |
2.27 |
|||
|
X4 |
Institutional |
||||
|
X41 |
Percentage of CBG to total number of fishermen |
203 |
2,42 |
3 |
GR |
|
X42 |
Percentage of fisheries management policies |
210 |
2.50 |
1 |
GR |
|
X43 |
Number of regulation products |
195 |
2.32 |
4 |
GR |
|
X44 |
The suitability of the capture fisheries development program to the RPJMN |
206 |
2.45 |
2 |
GR |
|
X45 |
Percentage of research budget related to capture fisheries to GDP |
161 |
1.92 |
5 |
PR |
|
X46 |
Gender equality |
159 |
1.89 |
6 |
GR |
|
|
Average |
2.25 |
|||
Note: GR is Good Representative; PR is Poor Representative.
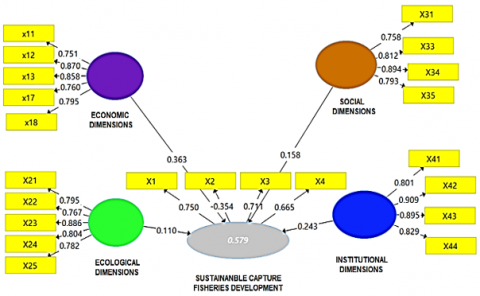
Ecosystem-based fisheries management tools emphasizes more on ecological indicators and indicators related to humans (social and institutional) to be the main things in sustainable management and to place economic indicators afterward [40]. Many experts believe that development with economic objectives can lead to a resource curse that ultimately threatens the sustainability of the resource itself [41, 42]. Indicators that have the category of poor representation do not necessarily have to be ignored, because the results of the study show that these indicators have a scientifical validation representation that is weak but remains a priority for measuring the performance of sustainable capture fisheries development. Furthermore, five main priority indicators on each dimension have analyzed the suitability of the influence of priority indicators on economic, ecological, social, and institutional dimensions to the performance of sustainable capture fisheries development. The analysis was carried out by estimating the model with a partial least square-structural equation model (PLS-SEM) approach and producing 18 indicators (Figure 3) with outer loading values that met the theoretical relevance requirements (>0.7), measured and available data.
Based on the path analysis, two indicators do not meet the requirements (outer loading value is less than 0.7), namely fisheries conflict indicators (X36) on the social dimension and percentage indicators of research and development budgets for fisheries capture (X46) on the institutional dimension. Figure 3 shows that the indexes on each dimension have a positive influence on sustainable capture fisheries development. The economic dimension has the greatest coefficient (0.363) and the ecological dimension has the lowest coefficient (0.110). A positive coefficient value indicates a positive effect on increasing the index of sustainable capture fisheries development, for example for the value of the ecological dimension coefficient of 0.110 shows that every increase in the ecological dimension index by 1 point will increase the index of sustainable capture fisheries development by 0.110 points.
Figure 3. Structural model of sustainable capture fisheries development
Each dimension indicator has a positive effect, but this effect is not significant at the 5% error rate. The coefficient of determination (R2) of the model (Figure 3) is 0.579, in the sense that the variety of indicators in the model is only able to explain by 57.90%. One guess is that indicators related to social and institutional dimensions have not been able to describe all the social and institutional conditions that contribute to capturing fisheries development. This research has provided empirical evidence of the existence of key indicators that contribute positively to the measurement of sustainable capture fisheries development. The initial indicator longlist of 30 indicators was then reduced to 18 indicators which can be used as key indicators to measure the performance of sustainable capture fisheries development. Five indicators out of 18 key indicators that have the highest results include: number of fisheries management policies (X42), percentage and number of regulatory products (X43), labor (X34), fisheries resources utilization status (X23) and fishermen household income (X12).
3.3 Index and status of sustainable capture fisheries development in Indonesia
The next step after the selected indicators is to modify them into criteria for each indicator and measure each indicator's weight, so the index value (weight x score) of the indicator is finally achieved. The calculation of each indicator score uses the maximum value, and the minimum value set to be compared across time. The analysis results on the economic dimension (Appendix 1) show that indicators of the economic dimension at the micro-level have shown good performance (seen from the maximum score of indicators of fishermen's income, household income, and fisherman exchange rate). In contrast, the performance indicators are macro (non-tax state revenue and GDP contribution) still has a poor performance and shows that the capture fisheries sector nationally has not been able to become a leading sector or prime movers. It is very ironic because, on the one hand, Indonesia has a great potential to capture fishery resources, but, on the other hand, it is not considered to have a significant influence on national economic growth.
In the ecological dimension, it is also recognized that the level of utilization of fish resources in Indonesia is still underexploited based on the analysis results. It is reflected in the value of the indicator of catch productivity, and the ratio of catch compared to the potential of the existing fishery has a minimum value. Indicator of catch productivity has a declining trend to become one of its problems for sustainable capture fisheries. The decline in fishing productivity is due to the difficulty of catching fish, the impact of reduced fishing effort, and the use of traditional fishing technology so that capture fisheries production is not optimal. There is a link between economic and ecological dimensions, where regions with high economic indexes have high ecology (ecological) indices and vice versa [43]. However, some other experts also say there is a paradox between economic, ecological, and social, where high economic growth (high economic index) results in a low ecology quality index due to resource exploitation that results in ecology degradation. Besides, social, economic growth causes unemployment and poverty [28, 44].
Meanwhile, the composite analysis results on social and institutional dimensions provide a condition that is not much different from the economic and ecological dimensions. Indicators on social and institutional dimensions have not shown maximum value because there are several indicators in both dimensions that have a minimum value and, in the future, become a threat to the sustainability of capture fisheries development. On the social dimension, most of the full-time fishermen have not been able to access formal capital, whereas access to capital is the fisherman's right to realize a fishing business protection program by Law No. 7 of 2016. Based on labor indicators in the field of capture fisheries (fishermen), it is still small compared to the number of workers in agriculture and forestry. The workforce in capture fisheries (fishermen) is only 6% of the total workforce in agriculture and forestry. In realizing the capture fisheries development program, a reliable, professional, and competitive workforce or fisherman is needed so that there will be a deficit in capture fisheries in the future.
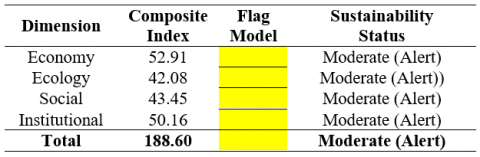
In this study, the range of composite values in each dimension has the same value (Table 5). This shows that there is considered no priority dimension to see the status of sustainable capture fisheries development. This is done to assess the status of each dimension and the status of the composite index values on all dimensions. The results of the analysis show that the composite index values on all dimensions are at moderate (alert) sustainability status. This is indicated by the composite value of each dimension that is in the range of the yellow flag model (Table 6).
Table 5. The range of composite index values in each dimension
The status of the economic and institutions dimension in the category of "Moderate," it is shown that the performance of this dimension must be increased again and still must be alert to several indicators that still show minimum performance, such as indicators related to non-tax state revenue (NTSR), GDP contribution and community business group (CBG) for small fishermen. The status of ecology and social dimension in the category of "Not Good" shows that the policy for the indicators in both dimensions must be change. Low achievement of the performance of these indicators can threaten the sustainability of capture fisheries development going forward.
Table 6. Composite index values and sustainability status dimensions of sustainable capture fisheries development
The current status of sustainable capture fisheries development can be seen from the composite index values of all dimensions. The results of the calculation of the composite index of fisheries development are 188.60 which shows that in general, capture fisheries development in Indonesia is in the status of "moderate" sustainability. This condition shows that the capture fisheries development is currently not ideal and requires changes in policies for several indicators in all dimensions (economy, ecological, social, and institutional). The "yellow" development status indicates that the current development achievements are not yet optimal and requires special attention to low-performance indicators, such as indicators on ecology dimension, because there are interrelationships with each other or vice versa [44]. Resource management is not one of the main factors to ensure the sustainability of capture fisheries, but the regulation of these resources' use is the study's primary concern. As resource users and beneficiaries of the existence of fish resources, humans are the main aspects that must be considered. The dominance of small-scale fishers in Indonesia's capture fisheries structure is a challenge for the future. The policy for capture fisheries development focuses on indicators with minimal (low) performance is one of the first steps to change the sustainable status of capture fisheries development in Indonesia from "yellow" to "green."
Based on the overall research results, it can be stated that the performance indicators of sustainable capture fisheries development at the provincial level must be adjusted to the characteristics of the region. It shows that capture fisheries management cannot be generalized and must consider the uniqueness or characteristics of the location's target of management. Also, indicators on the economic dimension, both at the national and selected locations, are not a top priority for measuring sustainable capture fisheries development performance. Ecological and social dimensions determine the main priorities. However, both performances are still low index than other dimension. The economic indicators for measuring the performance of capture fisheries development are considered irrelevant because they do not represent the overall picture of development achievements, so it must begin to shift to using ecological and social indicators by research results. Sustainable capture fisheries in Indonesia can be achieved immediately by paying attention to every planned development strategy's ecological and social aspects.
The status of the sustainability of capture fisheries development in "yellow" or "moderate" sustainability status indicates that the achievements of capture fisheries development are in good condition, but several performance indicators require special attention. Linkages between dimensions become a significant factor to be considered in realizing sustainability status, which is colored "yellow" to "green" due to the trade-off between economic and ecological dimensions, as many experts have concluded that on the one hand, positive economic outcomes can result in ecology degradation, cause poverty on the other hand which becomes a social problem in the framework of the capture fisheries development process in Indonesia. Attention to the dimension with a higher sensitivity (ecology and social) is the first step towards realizing sustainable capture fisheries development in Indonesia through the support of regulatory products and policy strategies oriented towards capturing fisheries from upstream to downstream, to change the sustainability status of capture fisheries development in Indonesia.
The authors are grateful to the Ocean Tropical Economic, Bogor Agricultural University, and all those who are not mentioned in this paper. At the same time, the authors thank the Ministry of Marine Affairs and Fisheries for the support that has been given to us.
Appendix 1. The composite index value of sustainable capture fisheries development
|
No |
Dimension |
Indicator |
Weight |
Score |
Index |
|
1 |
Economy (X1) |
1. Fisherman income (X11) |
5.19 |
3 |
15.57 |
|
2. Capture fisheries household income (X12) |
4.95 |
3 |
14.85 |
||
|
3. Fisherman exchange rate (X13) |
4.49 |
3 |
13.47 |
||
|
4. Non-tax state revenue (NTSR) of capture fisheries sector (X17) |
4.52 |
1 |
4.52 |
||
|
5. Contribution of GDP or GRDP in fisheries (X18) |
4.5 |
1 |
4.50 |
||
|
Total |
52.91 |
||||
|
2 |
Ecology (X2) |
6. Catch productivity (X21) |
5.43 |
1 |
5.43 |
|
7. Fishing trips (X22) |
5.11 |
2 |
10.22 |
||
|
8. Status of fish resource utilization (X23) |
5.45 |
2 |
10.90 |
||
|
9. Level of utilization of fish resources (X24) |
5.48 |
2 |
10.96 |
||
|
10. Ratio of the number of fish catches on FMA to potency (X25) |
4.57 |
1 |
4.57 |
||
|
Total |
42.08 |
||||
|
3 |
Social (X3) |
11. Health insurance (X31) |
6.04 |
3 |
18.12 |
|
12. Protection of small-scale fishermen (X33) |
6.23 |
1 |
6.23 |
||
|
13. Labor (X34) |
6.9 |
1 |
6.90 |
||
|
14. Fisheries dependence (X35) |
6.1 |
2 |
12.20 |
||
|
Total |
43.45 |
||||
|
4 |
Institutional (X4) |
15. Percentage of total CBG (X41) |
6.25 |
1 |
6.25 |
|
16. Percentage of fisheries management policies (X42) |
6.46 |
2 |
12.92 |
||
|
17. Number of regulation products (X43) |
6 |
2 |
12.00 |
||
|
18. The suitability of the capture fisheries development program to the RPJMN (X44) |
6.33 |
3 |
18.99 |
||
|
Total |
50.16 |
[1] Begossi, A. (2014). Ecological, cultural, and economic approaches to managing artisanal fisheries. Environment, Development and Sustainability, 16(1): 5-34. https://doi.org/10.1007/s10668-013-9471-z
[2] Tursi, A., Maiorano, P., Sion, L., D’Onghia, G. (2015). Fishery resources: Between environmental and economy. Rendiconti Lincei, 26(1): 73-79. https://doi.org/10.1007/s12210-014-0372-3
[3] Camp, E.V., Larkin, S.L., Ahrens, R.N.M., Lorenzen, K. (2017). Trade-offs between socioeconomic and conservation management objectives in stock enhancement of marine recreational fisheries. Fisheries Research, 186: 446-459. https://doi.org/10.1016/j.fishres.2016.05.031
[4] Erisman, B.E., Grüss, A., Mascareñas-Osorio, I., Lícon-González, H., Johnson, A.F., López-Sagástegui, C. (2020). Balancing conservation and utilization in spawning aggregation fisheries: A trade-off analysis of an overexploited marine fish. ICES Journal of Marine Science, 77(1): 148-161. https://doi.org/10.1093/icesjms/fsz195
[5] Pearce, D., Barbier, E., Markandya, A. (1992). Sustainable Development - Economics and Environment in the Third World. Edward Elgar Publishing Hants. England.
[6] Kurniawan, R., Managi, S. (2018). Economic growth and sustainable development in Indonesia: An assessment. Bulletin of Indonesian Economic Studies, 54(3): 339-361. https://doi.org/10.1080/00074918.2018.1450962
[7] Teal, L.R., Marras, S., Peck, M.A., Domenici, P. (2015). Physiology-based modelling approaches to characterize fish habitat suitability: Their usefulness and limitations. Estuarine, Coastal and Shelf Science, 201: 56-63. https://doi.org/10.1016/j.ecss.2015.11.014
[8] Engel, S., Pagiola, S., Wunder, S. (2008). Designing payments for environmental services in theory and practice: An overview of the issues. Ecological Economics, 65(4): 663-674. https://doi.org/10.1016/j.ecolecon.2008.03.011
[9] Capodaglio, A.G. (2017). Integrated, decentralized wastewater management for resource recovery in rural and peri-urban areas. Resources, 6(2). https://doi.org/10.3390/resources6020022
[10] National Development Planning Agency. (2014). Study of Sustainable Fisheries Management Strategies. Kementerian PPN/Bappenas. Direktorat Kelautan dan Perikanan. Jakarta.
[11] Nababan, B.O., Sari, Y.D., Hermawan, M. (2017). Analisis keberlanjutan perikanan tangkap skala kecil di Kabupaten Tegal Jawa Tengah (teknik pendekatan Rapfish). Jurnal Sosial Ekonomi Kelautan dan Perikanan, 2(2): 137-158. http://dx.doi.org/10.15578/jsekp.v2i2.5868
[12] Terawasi, P., Reid, C. (2017). Economic and development indicators and statistics: tuna fisheries of the western and central Pacific Ocean 2017. Fisheries Forum Agency, Honiara, Solomon Island, p. 63.
[13] Pinfold, G. (2009). Economic impact of marine related activities in Canada. Economic Analysis and Statistic (publisher). Statistical and Economic Analysis series1921-877XNo.1-1. Department of Fisheries and Oceans. Policy Sector. Canada.
[14] Spangenberg, J.H., Bonniot, O. (1998). Sustainability indicators: A compass on the road towards sustainability. Human Development, Wuppertal Papers 81, Wuppertal Institute for Climate, Environment and Energy.
[15] Hák, T., Moldan, B., Dahl, A.L. (2007). Sustainability Indicators: A Scientific Assessment. SCOPE 67.
[16] Haenlein, M., Kaplan, A.M. (2004). A beginner’s guide to partial least squares (PLS) analysis. Understanding Statistics, 3: 283-297. https://doi.org/10.1207/s15328031us0304_4
[17] Monecke, A., Leisch, F. (2012). SemPLS: Structural equation modeling using partial least squares. Journal of Statistical Software, 48: 1-32. https://doi.org/10.18637/jss.v048.i03
[18] Fauzi, A. (2019). Teknik Analisis Keberlanjutan. Gramedia Pustaka Utama, Jakarta.
[19] Gonzalez, T. (2005). Dashboard design: Key performance indicators & metrics. BrightPoint Consulting, Inc.
[20] Pitcher, T.J. (1999). Rapfish, a rapid appraisal technique for fisheries, and its application to the Code of Conduct for Responsible Fisheries. FAO Fisheries Circular (FAO).
[21] Kaunang, R., Monintja, D.R., Nikijuluw, V.P.H., Haluan, J. (2017). Key performance indicators of integrated tuna fishing in North Sulawesi. Jurnal Teknologi Perikanan dan Kelautan, 1(1): 81-92. https://doi.org/10.24319/jtpk.1.81-92
[22] Dahuri, R. (2003). Marine biodiversity: Indonesia's sustainable development assets. Jakarta. PT. Gramedia Pustaka.
[23] Ministry of Marine Affairs and Fisheries, WWF‐Indonesia and the Center of Coastal and Marine Resource Studies-Bogor Agricultural University. (2012). The performance of ecosystem approach to fisheries management in Indonesia's fisheries management area. Directorate of Fisheries Resource, Directorat General of Capture Fisheries, Ministry of Marine Affairs and Fisheries, Jakarta [in Indonesian].
[24] Tambunan, T. (2001). Indonesian economy: Theory and Empirical Findings. Jakarta. PT. Gramedia Pustaka.
[25] Lenee, T.L., Oki, J. (2017). Capital market development and economic growth: Evidence from the MINT countries. Journal of Economics and Sustainable Development, 8(2): 68-107.
[26] Ali, A.A., Dalmar, M.S., Ali, A.Y.S. (2018). The impact of tax revenues on economic growth: A time series evidence from Kenya. Academic Research International, 9: 163-170.
[27] Dmytro, S. (2018). Macroeconomic indicators of determination on tax behaviour of OECD countries. Munich Personal RePEc Archive (MPRA), Paper No. 84002.
[28] Kitchen, L., Marsden, T. (2009). Creating sustainable rural development through stimulating the eco-economy: Beyond the eco-economic paradox? Journal Sociologia Ruralis, 49(3). https://doi.org/10.1111/j.1467-9523.2009.00489.x
[29] Setiadi, R., Jawoto, S., Sophianingrum, M., Rosalia, D. (2008). Semarang city's sustainable development indicators. Journal Riptek, 1 (2): 1-15. https://riptek.semarangkota.go.id/index.php/riptek/index.
[30] Lewis, S.G., Boyle, M. (2017). The expanding role of traceability in seafood: Tools and key initiatives. Journal of Food Science, 82(S1): A13-A21. https://doi.org/10.1111/1750-3841.13743
[31] Food and Agriculture Organization. (2015). Voluntary guidelines for securing sustainable small-scale fisheries: In the context of food security and poverty eradication. Food and Agriculture Organization of The United Nations, Rome.
[32] Hakim, T., Bujang, I. (2012). The impact and consequences of tax revenues’ components on economic indicators: evidence from panel groups data. International Trade from Economic and Policy Perspective, 63: 99-116. https://doi.org/10.5772/48415
[33] United Nation. (2007). Indicators of Sustainable Development: Guidelines and Methodologies. New York.
[34] Hikmah, Nasution, Z. (2017). Efforts to protect fishermen from the sustainability of capture fisheries business. Jurnal Kebijakan Sosial Ekonomi Kelautan dan Perikanan, 7(2): 127-142.
[35] Raymond, M., Yanuar, M.J.P., Hartoyo, S., Sapei, A., Wayan, I.A. (2011). Analysis of sustainability of Babon River Basin watershed management (case study in Semarang City). Jurnal Rekayasa Lingkungan, 7(2): 193-204.
[36] Noviyanti, R., Wisudo, S.H., Wiyono, E.S., Baskoro, M.S., Hascaryo, B. (2015). Self-capacity development of fishermen in the context of sustainable capture fisheries development in PPN Palabuhan Ratu. Jurnal Sosial Ekonomi Kelautan dan Perikanan, 10(2): 251-264.
[37] Hiariey, L.S., Romeon, N.S. (2017). Penguatan kelompok usaha bersama (CBG) perikanan tangkap (studi kasus Desa Latulahat, Kota Ambon, Provinsi Maluku). Jurnal Matematika, Saint dan Teknologi, 18(2): 120-129. https://doi.org/10.33830/jmst.v18i2.137.2017
[38] Ministry of Marine Affairs and Fisheries. (2018). Marine and Fisheries Information Statistic. Pusat Data, Statistik dan Informasi, Jakarta, Kementerian Kelautan dan Perikanan [in Indonesian].
[39] Umar, H.B. (2009). Principal Component Analysis (PCA) and Its Application with SPSS. Journal Kesehatan Masyarakat, 03(2): 97-101.
[40] Intralawan, A., Wood, D., Frankel, R., Costanza, R., Kubiszewski, I. (2018). Tradeoff analysis between electricity generation and ecosystem services in the Lower Mekong Basin. Ecosystem Services, 30: 27-35. https://doi.org/10.1016/j.ecoser.2018.01.007
[41] Hornborg, S., van Putten, I., Novaglio, C., Fulton, E.A., Blanchard, J.L., Plagányi, É., Bulman, C., Sainsbury, K. (2019). Ecosystem-based fisheries management requires broader performance indicators for the human dimension. Marine Policy, 108: 103639. https://doi.org/10.1016/j.marpol.2019.103639
[42] Havranek, T., Horvath, R., Zeynalov, A. (2016). Natural resources and economic growth: A meta-analysis. World Development, 88: 134-151. https://doi.org/10.1016/j.worlddev.2016.07.016
[43] Erlinda, N. (2016). Policy on sustainable regional development in Jambi Province Through the Flag Model Approach. Jurnal Ekonomi Dan Kebijakan Publik, 7(1). https://doi.org/10.22212/jekp.v7i1.416
[44] Chowdhury, A.M., Bhuiya, A., Chodury, M.E., Rasheed, S., Hussain, Z., Chen, L.C. (2013). The Bangladesh paradox: Exceptional health achievement despite economic poverty. The Lancet, 382: 1734-1745. https://doi.org/10.1016/S0140-6736(13)62148-0