Yury Angélica Rodríguez | Yesica Paola Pérez | Laura Viviana Roa | César Jiménez-Rodríguez | Hernán Darío Granda-Rodríguez | Miguel De Luque-Villa*
© 2020 IIETA. This article is published by IIETA and is licensed under the CC BY 4.0 license (http://creativecommons.org/licenses/by/4.0/).
OPEN ACCESS
Nowadays the biodiversity loss has appeared with the search for human economic development which has reached dramatic proportions. Knowledge of biodiversity itself it is an essential factor, for finding the problems it faces and so develop appropriate control and conservation strategies. One of the main concerns in these days it is to characterize natural environments and how this have changed in recent years. The purpose of this study was to analyze the process of fragmentation of forests at the spatial and temporal level in the Río Botello catchment, Facatativá, Eastern Cordillera of Colombia, during the period 1985 to 2018. A time series of LANDSAT satellite images for 1985, 2001 and 2018 was used for this analysis, along with the CORINE LAND COVER methodology adapted for Colombia. The configuration of the identified terrestrial coverages was done with the FRAGSTATS software and the IndiFrag v2.1 application. These results show that the percentage of forests in the catchment decreased from 41% of the total area to 31% in the last 30 years, this because agricultural areas increased at an annual growth rate of 0.841 km2/year that replaced the natural forest mainly in the northeast and northwest sectors of the study area. The Eastern Cordillera of Colombia is one of the most deforested in the last 50 years. According to results it is necessary to carry out an integrated management of the catchment by different institutions to reduce the fragmentation and deforestation of natural areas.
spatio-temporal analysis, land cover, forest fragmentation, landscape, geographic information systems
Forest fragmentation can be interpreted as a dynamic process in which a largely area of forest is progressively subdivided into small, geometrically altered, and isolated patches [1-4]. Earth’s surface has been converted into agricultural land thanks to economic development, leaving an estimate on 30% of earth surface as forests. Deforestation, habitat degradation and fragmentation are common trends in many tropical countries in sub-Sahara Africa, southeast Asia and Latin America [5-8].
Forest fragmentation is caused by several factors including natural processes. However, manmade changes are the main cause of disturbance of forest, transforming the natural landscape through the intensification of land use for economic activities. These land-use changes together with agricultural expansion, logging, burning, and the development of urban centers, have accelerated the loss and degradation of wild habitats during the last century [9, 10].
Fragmentation triggers a series of processes that deteriorate the habitat and are associated with forest edge effects (i.e., establishment of invasive alien species). These processes could generate changes in the abiotic conditions of the fragments, affecting processes in essential ecosystems (i.e., carbon and water balance). This leads to an increase of microclimate changes around forest edges. Another effect is the progressive isolation of flora and fauna populations that live in these fragments. These populations depend in both, fragment connectivity and adversity of the matrix that surrounds them [11-13].
Due to all these processes, it is important to identify the level of fragmentation of the forests. During the last century some practices have been developed allowing the detection of the gradual division of continuous forest patches into smaller, isolated fragments. Understanding forest fragmentation and its evolution over time involve the use of statistical indicators or indices that describe the composition and configuration of the landscape. Quantification and comparison of landscape indices have been recognized as the most effective way to assess forest fragmentation processes, these methods have been applied in several studies at international levels Mexico [14-17]. Most studies limit their scope to identifying a landscape fragmentation pattern by a time window of interest. However, the fragmentation process of the landscape is more appropriately measured by changes in the landscape metrics at two or more points in time [18-23]. Therefore, in order to contribute to land planning and development of conservation programs in rural areas, the spatial and temporal analyzes of fragmentation dynamics at catchment scale become study strategies that are applicable to different scenarios. It is difficult to understand the historical dynamics of land cover use and change as well as design better forest and environmental management policies for the micro-watershed without quantifying the rate and amount of change in these covers over time. For this reason, GIS technologies, together with spatial statistics programs like FRAGSTAT, can be used effectively to determine changes in land use and forest cover. They allow the quantitative estimation of the biophysical characteristics of forest areas and facilitate long-term modeling of forest landscape development, as well as relatively long processes on a spatial scale [24, 25].
The main pressures or threats that prevent a territory from being connected are loss of habitat and fragmentation, generated by artificial barriers, natural barriers, and cultural barriers. Maintaining the connectivity of the landscape is crucial for the subsistence of biological diversity and is essential for conservation and planning practices. Connectivity is necessary to safeguard the stability of ecological processes and ecosystem services that are spatially link [26, 27].
The connectivity studied through the analysis of the spatial components of the landscape which are patch, corridor, and matrix. The biophysical and spatial characteristics of these define the heterogeneity and the particularities of the landscape. Therefore, there are two types of connectivity. Firstly, the structural connectivity deals with the continuity and adjacency between fragments of certain land cover. Secondly, the functional connectivity which is related to the behavioral response of individuals and species to the physical and spatial structure of the landscape [28, 29].
Río Botello catchment located in the municipality of Facatativá (Cundinamarca, Colombia) is an example of conflict by land cover transformation and overused. This, because the lands that should be forests have been replaced with pasture matrices for livestock and seasonal crops such as strawberries [30], This has significant effects that generate physical-biotic changes in the environment. In addition, there are no detailed and updated studies that determine the dynamics of the forest fragmentation process at catchment level. This information is necessary for developing management tools, decision-making guidelines, and control policies. This way, proper management of natural resources and prevention of medium and long term effects could be implemented [31]. It is also necessary to know these characteristics, which can be theoretical support in the development of different research processes at catchment level. This way, gaps in the behavior and response of conserved areas to the pressures generated by different land uses can be explored.
This catchment is important as a supplier of resources for Facatativá, however, its fragmentation process has not been defined yet. For this reason, it is necessary to analyze this process by determining the existing land covers and describing its dynamics during the study period. This can be done by obtaining patterns and fragmentation indices of the study area. The aim of this study is to evaluate the process of forest fragmentation in Río Botello catchment during the period 1985-2018.
2.1 Study area
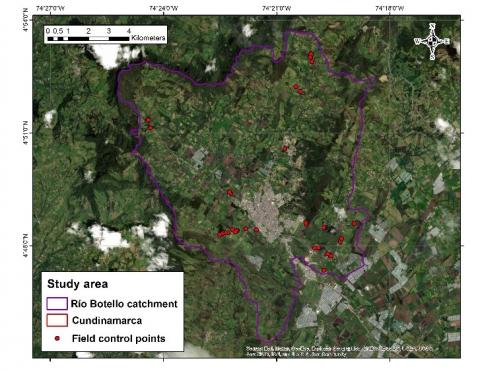
Rio Botello catchment is located in Facatativá-Cundinamarca, Eastern Cordillera of Colombia (Figure 1). catchment covers an area of 104.32 km2 with 70% of urban area, so there are land cover conflicts due to anthropic activities such as agriculture and urbanization.
Figure 1. Geographical location of Río Botello catchment
2.2 Land cover classification
Landsat-5 TM images (provided by the USGS) acquired on march 22, 1985, January 1, 2001 and March 17, 2018 were used for land cover classification. Landsat-5 TM has 7 spectral bands, with 6 of these spectral bands with a spatial resolution of 30 m and the remaining a spatial resolution of 120 m. The image processing was carried out by radiometric corrections using the ENVI 5.3 software [32]. This correction was carried out in order to obtain measurements consistent with the characteristics of the earth's surface and obtain higher level results [33].
The photointerpretation of the satellite images was made with the software ArcGIS 10.5 [34] and following the Corine Land Cover methodology adapted for Colombia-CLCC [35]. Considering the spatial resolution of the images, only the first level of CLCC coverage was digitized, corresponding to 1) Artificial territories, 2) Agricultural territories, and 3) Forests and semi-natural areas. In order to verify the information obtained, a field verification process was carried out in the areas that presented the highest uncertainty within the classification. A set of control points were located along the catchment (Figure 2). Three field visits were made in different sectors: the first visit in El Prado, Moyano, and Mancilla; the second visit in La Tribuna, San Rafael, and Cartagenita; and the last visit in Pueblo Viejo. The places were selected simultaneously with the land cover classification. Finally, the thematic land cover maps were generated for every year analyzed.
2.3 Fragmentation index
Landscape metrics can be defined at four levels. The first one is the cell level and represents a local spatial context. The second one is the patch level and analyzes the spatial character individually. The third one is class level and represents the spatial distribution of a set of patches of the same type; these metrics are commonly interpreted as fragmentation indices. Finally, the fourth one is the landscape level and represents a spatial pattern interpreted as heterogeneity indices because they measure the general structure of an area. In order to interpret each index correctly, the level must be selected according to the scale [36] Therefore, for the fragmentation process analysis in the catchment, the class level metrics were selected. According to the pattern they measure, theses metrics can be classified into different groups: area-edge, shape, and aggregation. Subsequently, the most relevant indices were selected for comparison.
The fragmentation was analyzed with two software. FRAGSTATS [37], which offers a wide range of metrics and analyzes fragmentation by describing the characteristics of the landscape and its components [38]. Secondly, with IndiFrag [39] that is within the ToolBox of ArcGIS 10.5. This software compiles different fragmentation indices and calculates multitemporal parameters comparing land cover maps of two different periods simultaneously [40]. This approach offers a wide range of metrics and analyzes for the fragmentation process, by describing the characteristics of the landscape and its components [18]. The main indices applied to Río Botello catchment are summarized in Table 1.
Figure 2. Field Land cover control points collected in 2018 within Río Botello catchment, Colombia
Table 1. Fragmentation index
|
Index |
Description |
|
NP |
The number of patches is a simple measure of the degree to which the study area is divided |
|
CA |
Total class area: this index calculates the sum of the areas of all patches of the corresponding class type |
|
PD |
Patch density: This index is the number of patches per 100 ha, the higher the density in a class, the smaller its separation. |
|
PLAND |
Percentage of landscape: This index quantifies the proportional abundance of each type of patch and ranges are assumed to understand the influence of the area on the transformation processes. |
|
MPS |
This index calculates the mean area of the patches. |
|
LPI |
The largest patch index is the percentage of the class comprised by the largest patch (0 <LPI ≤ 100), it approaches 0 when the largest patch of the corresponding patch type is getting smaller. |
|
SHAPE |
Calculates the complexity of the fragment shape compared to a standard shape, as the circumference in the non-vector environment increases as the shape becomes more irregular |
|
FRAC |
The fractal dimension indicates a distancing from Euclidean geometry with a higher susceptibility to fragmentation; values close to 1 represent a much more compact simple Euclidean shape (circle, square) |
|
PROX |
The proximity of a patch is considered relevant to assess the ecological integrity of an ecosystem. It provides information on the proximity or neighborhood (within a radius of 500 m) in which the fragments that are part of a class or land cover type are physically arranged. |
|
ENN |
Euclidean nearest neighbor distance (ENN). This index is used to calculate the separation of objects between those of the same class. It gives an idea of their distribution in meters |
3.1 Land cover maps of Río Botello catchment
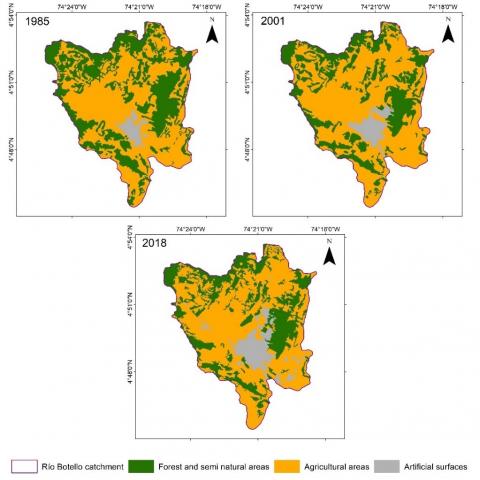
Figure 3 shows the land cover changes in the catchment during the study period. In the northeast, about 70% of the forest and semi-natural areas observed in 1985 disappeared by 2001. These areas were converted into agricultural areas and 80% of the forest was replaced by artificialized territories in 2018. In the western part of the catchment, the forest cover decreased slightly. By 2018, forest areas and semi-natural areas were reduced by 20% and are replaced by agricultural and artificial territories. In the center of the catchment, the forest and semi-natural areas were considerably reduced by 2018. Approximately 65% of these were replaced by agricultural territories, while 35% by artificialized territories. Finally, in the eastern zone, small patches of forests and semi-natural areas were subdivided by 2001, being reduced and replaced by artificialized territories by 2018. The trend for land cover changes in the catchment shows that the forest and homogeneous semi-natural areas were subdivided or separated into small patches by 2001 and by 2018. Some of these patches were replaced by artificial territories as mentioned above, increasing the area of this land cover category throughout the catchment during the 33 years included in this study.
Figure 3. Land cover maps for Río Botello catchment for the years 1985, 2001, and 2018
Table 2 shows the land cover percentages for the years 1985, 2001, and 2018. The spatio-temporal trend of land covers from 1985 to 2018 shows a loss of forest and semi-natural area (-10.78 km2). This is due to the increase of agricultural and artificial territories. Facatativá has a fundamentally agricultural economy thanks to the high fertility of the soil in this area. Additionally, this city is an alternative location as a food production and supply center for the country's capital [41]. Likewise, artificialized territories have grown due to the demand for urbanized areas for the population. For this reason, the forest fragmentation has increased, so an ineffective management of these areas in a future scenario can lead to negative effects in the catchment.
Table 2. Land cover transformation for Río Botello catchment for the period 1985-2018
|
Land Cover LCCS |
Area (Km2) |
||
|
1985 |
2001 |
2018 |
|
|
Forest and semi natural areas |
43.97 |
34.18 |
33.19 |
|
Agricultural areas |
61.10 |
68.54 |
65.53 |
|
Artificial surfaces |
3.22 |
5.56 |
9.56 |
3.2 Analysis of the structural connectivity of the landscape according to fragmentation indices
3.2.1 Number of patches (NP)
Forest and semi-natural areas were the land covers with the highest NP for the three study periods (Figure 4) this indicates a decrease in habitat. On the other hand, artificialized territories had continuous growth during the period of analysis. The agricultural areas had 21 and 32 patches during 1985 and 2018 respectively, and 7 in 2001. This is a result of the nature of this land cover, whose first period would indicate a decrease in agricultural activities that are later reactivated.
Figure 4. Number of patches (NP)
3.2.2 Patch area (CA)
From the approach of landscape description metrics, CA of the landcover grouped in agricultural areas dominated the landscape during the three analysis periods (Figure 5). This is followed by forest and semi-natural areas, with the highest CA in 1985 and being reduced during the remaining periods of analysis.
Figure 5. Patch area (CA)
3.2.3 Patch density (PD)
The higher the density in a class, the smaller its separation will be. However, despite the patches of forests and semi-natural areas had the highest density and high abundance during the three periods of analysis (Figure 6), there was an increase in their distancing. During 1985 equal density for agricultural surfaces and artificial surfaces was observed, as well as lower abundance for the latter.
Figure 6. Patch density (PD)
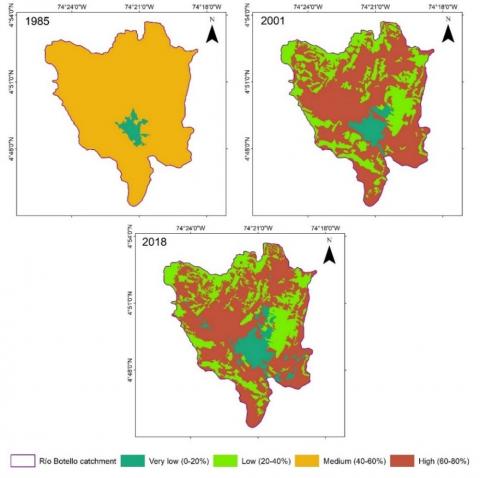
3.2.4 Percentage of landscape (PLAND)
Ranges of percentage were assigned in order to understand abundance. Percentages between 1 and 20 correspond to Very Low, from 21 to 40 Low, from 41 to 60 Medium, from 61 to 80 High and values between 81 to 100 Very High. According to this, in the study area 3 specific trends were observed (Figures 7 and 8):
(1) The decrease of forests and semi-natural areas from 40.6% (Medium - yellow color) in 1985 to 31.5% and 30.65% (Low - green color) in 2001 and 2018 respectively.
(2) The expansion of the agricultural land cover is Medium in 1985 and High (orange) during 2001-2018.
(3) The population increase related to the expansion of artificialized territories for the three study periods is Very Low.
Figure 7. Percentage of landscape (PLAND)
3.2.5 Mean patch area (AREA MN)
Regarding the AREA MN in the study area, the forests and semi-natural land covers had a decrease in area, which means an average loss of habitat per patch of 12.07 ha during 1985-2001. Additionally, there was a small average gain of 6.16 ha during 2001-2018, this could indicate a habitat improvement of this land cover and is confirmed in a later analysis stage. The average size of artificial surfaces decreased by 21.46%, despite the increase in the number of patches during 2001-2018. This is cartographically evidenced in isolated patches of this land cover class. In addition, the average area of the agricultural areas increased by 300.36% in the seven patches identified in 2001, compared to was observed in 1985 (Figure 9).
Forests and semi-natural areas are the land cover of the highest interest from composition and structure approach. This is because of the stability of fragments given their ecosystem support. However, according to its average size, this land cover is classified as unstable.
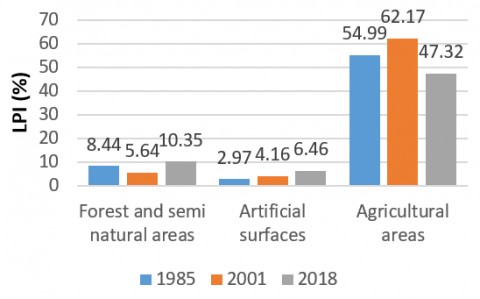
3.2.6 Largest patch index (LPI)
The LPI analysis showed the landscape was a single unit identified as agricultural areas with values of 54.99, 62.17, and 47.32 for 1985 2001 and 2018 respectively. Forest and semi-natural areas as well as artificialized territories indicate that even with LPI of 10.35 and 6.46 in 2018, are very small on a landscape scale (Figure 10).
3.2.7 Shape index (SHAPE)
In the individual analysis of the SHAPE index for the land cover categories, it was found that Forests and semi-natural areas had the highest index (2.96) during the most recent year (See Figure 11). Despite the fact that the AREA MN indicates an average gain in habitat, the shape of this land cover suggests that it may have a greater influence of the edge effect than the other land covers studied. It is proven that the forms with greater irregularity are less efficient in protecting the integrity of the ecosystems [28], being consistent with the loss of AC and the progressive increase of the different perforations and effects of the presence of anthropic land covers that are adjacent or immersed within the landscape.
Comparatively, the artificialized Territories have an index of 3.16 in 1985, being the land cover class with the highest irregular shape among the others and during the studied period. This indicates an intense period of urban growth (index of 2.55 in 2018) and its graphic representation is associated with irregular and stable shapes, as well as enlargement (Figure 11).
Figure 8. Distribution of percentage of landscape (PLAND) Botello’s catchment
Figure 9. Mean patch area (AREA MN)
Figure 10. Largest patch index (LPI)
Figure 11. Shape index (SHAPE)
3.2.8 Dimension fractal (FRAC)
The land cover for the different analysis periods are located in a very simple complexity (See Figure 12), which correlated with the shape index indicates serious anthropic affectations that subordinate the evolution in form and structure of the forest and semi-natural areas land cover.
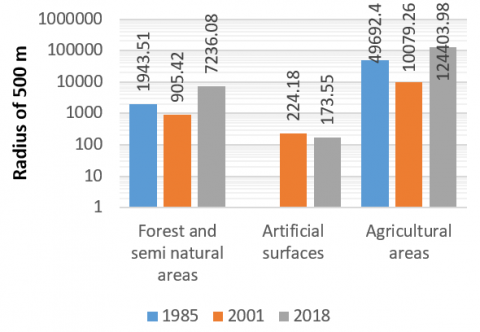
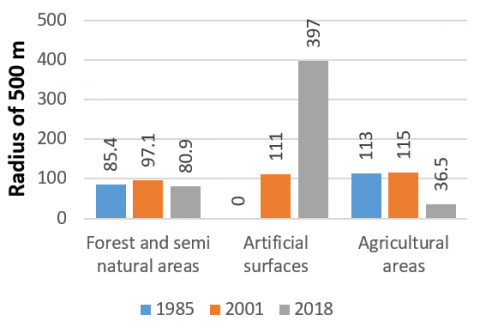
3.2.9 Proximity (PROX) y Euclidean nearest neighbor distance (ENN)
These indices assess the ecological integrity from an ecosystem view and by the land cover definition, it is relevant to evaluate the index with a higher emphasis on natural and semi-natural forests. According to this, under the qualification ranges for proximity and its correlation with the isolation of the patches, the forest, and semi-natural areas had low values, showing fragmentation, consistent with the coverage being the highest number of patches for all studied periods. In the same way, it has isolated fragments for which the interaction is null or unlikely, subject to the ecological connection of mobile species in which they do not have habitat or niche since their average patch area (AREA MN) is classified as unstable. On the other hand, the proximity of agricultural areas had a higher value compared to the other land covers during 2018. This indicates that in a radius of 500 m more patches of the same land cover can be found, indicating a greater neighborhood or contiguity for this land cover (Figure 13). Regarding the ENN, in 1985 the disaggregation was higher for agricultural areas (113m -Isolated-) followed by forests and semi-natural areas (85m -Partially isolated-), artificialized surfaces had only one patch, therefore, there were no nearby areas. Agricultural areas were the most disaggregated land cover (115m -Isolated-) in 2001, the expansion of artificialized surfaces was significantly increased (111m -Isolated-) in 2018, this indicates that the neighbors closest to each patch were found on average at 397m -isolated- (Figure 14).
Figure 12. Dimension fractal (FRAC)
Figure 13. Proximity (PROX)
Figure 14. Euclidean nearest neighbor distance (ENN)
The landscape of Río Botello’s catchment has fragmentation and around 24.51% modification of the original landscape surface. This, mainly due to agricultural and livestock activities, as well as the change in land use with the expansion of the urban and suburban areas. Forest and semi-natural areas did lose surface area as the use of land for agricultural purposes increased. The forested areas are the fragments with priority management for their long-term conservation, emphasizing the protection of those forests located on flat rural areas or with low slopes since it is expected that the potential impacts on native forests will be caused by economic activities whit priority there. The results suggest that sustainable management of the landscape matrix is required to mitigate the impact of socioeconomic activities on the natural habitat. Special emphasis should be placed on monitoring the positive delta presented by the metric of the mean patch area of the forest and semi-natural covers, which must be corroborated under the assumption of a trend-gain scenario.
The study of forest fragmentation through fractal analysis is well suited for the study of fractally shaped geometric patterns of forests and other types of vegetation that serve as habitat for wildlife, as fractals quantify spatial heterogeneity at multiple scales in the landscape, the proposed methodology is an easy-to-apply tool that allows the use of geographic information systems and remote sensors, as a useful and reliable tool for decision making., as a useful and reliable tool for decision making.
The presented metrics were calculated in physical rather than ecological terms, no type of ecological flow was measured. It is recommended for further studies to complement the metrics with measurements of functional connectivity and environmental value.
The authors thank to Seruans Environment S.A.S for providing the funding.
[1] Carranza, M., Hoyos, L., Frate, L., Acosta, A., Cabido, M. (2015). Measuring forest fragmentation using multitemporal forest cover maps: Forest loss and spatial pattern analysis in the Gran Chaco, central Argentina. Landscape and Urban Planning, 143: 238-247. https://doi.org/10.1016/j.landurbplan.2015.08.006
[2] Liu, Y.L., Feng, Y.H., Zhao, Z., Zhang, Q.W., Su, S.L. (2016). Socioeconomic drivers of forest loss and fragmentation: A comparison between different land use planning schemes and policy implications. Land Use Policy, 54: 58-68. https://doi.org/10.1016/j.landusepol.2016.01.016
[3] Sharma, M., Areendran, G., Raj, K., Sharma, A., Joshi, P. (2016). Multitemporal analysis of forest fragmentation in Hindu Kush Himalaya - A case study from Khangchendzonga Biosphere Reserve, Sikkim, India. Environmental Monitoring and Assessment, 188(10): 596. https://doi.org/10.1007/s10661-016-5577-8
[4] Sharma, M., Chakraborty, A., Garg, J.K., Joshi, P.K. (2017). Assessing forest fragmentation in north-western Himalaya: A case study from Ranikhet forest range, Uttarakhand, India. Journal of Forestry Research, 28(2): 319-327. https://doi.org/10.1007/s11676-016-0311-5
[5] FAO, (2016). Estado de los bosques del mundo. 50. http://www.fao.org/3/a-i5588s.pdf, accessed on Aug. 30, 2020.
[6] Enaruvbe, G.O., Atafo, O.P. (2019). Land cover transition and fragmentation of River Ogba catchment in Benin City, Nigeria. Sustainable Cities and Society, 45: 70-78. https://doi.org/10.1016/j.scs.2018.11.022
[7] Correa Ayram, C.A., Etter, A., Díaz-Timoté, J., Rodríguez Buriticá, S., Ramírez, W., Corzo, G. (2020). Spatiotemporal evaluation of the human footprint in Colombia: Four decades of anthropic impact in highly biodiverse ecosystems. Ecological Indicators, 117: 106630. https://doi.org/10.1016/j.ecolind.2020.106630
[8] Zhang, Y.L., Shen, W.J., Li, M.S., Lv, Y.Y. (2020). Assessing spatio-temporal changes in forest cover and fragmentation under urban expansion in Nanjing, eastern China, from long-term Landsat observations (1987-2017). Applied Geography, 117: 102190. https://doi.org/10.1016/j.apgeog.2020.102190
[9] Bizama, G., Torrejón, F., Aguayo, M., Muñoz, M.D., Echeverría, C., Urrutia, R., (2011). Perdida y fragmentacion del bosque nativo en la cuenca del río Aysen (patagonia-chile) durante el siglo xx. Revista de Geografia Norte Grande, 49: 125-138. https://doi.org/10.4067/S0718-34022011000200008
[10] Liu, J., Coomes, D.A., Gibson, L., Hu, G., Liu, J.L., Luo, Y.Q., Wu, C.P., Yu, M.J. (2019). Forest fragmentation in China and its effect on biodiversity. Biological Reviews, 94(5): 1636-1657. https://doi.org/10.1111/brv.12519
[11] Chakraborty, A., Ghosh, A., Sachdeva, K., Joshi, P.K. (2017). Characterizing fragmentation trends of the Himalayan forests in the Kumaon region of Uttarakhand, India. Ecological Informatics, 38: 95-109. https://doi.org/10.1016/j.ecoinf.2016.12.006
[12] Rahman, M.F., Islam, K. (2020). Effectiveness of protected areas in reducing deforestation and forest fragmentation in Bangladesh. Journal of Environmental Management, 111711. https://doi.org/10.1016/j.jenvman.2020.111711
[13] Andronache, I., Marin, M., Fischer, R., Ahammer, H., Radulovic, M., Ciobotaru, A.M., Jelinek, H.F., Di Ieva, A., Pintilii, R.D., Drăghici, C.C., Herman, G.V., Nicula, A.S., Simion, A.G., Loghin, I.V., Diaconu, D.C., Peptenatu, D. (2019). Dynamics of forest fragmentation and connectivity using particle and fractal analysis. Scientific Reports, 9(1): 1-9. https://doi.org/10.1038/s41598-019-48277-z
[14] Reddy, C., Sreelekshmi, S., Jha, C., Dadhwal, V. (2013). National assessment of forest fragmentation in India: Landscape indices as measures of the effects of fragmentation and forest cover change. Ecological Engineering, 60: 453-464. https://doi.org/10.1016/j.ecoleng.2013.09.064
[15] Kumar, M., Denis, D.M., Singh, S.K., Szabó, S., Suryavanshi, S., (2018). Landscape metrics for assessment of land cover change and fragmentation of a heterogeneous watershed. Remote Sensing Applications: Society and Environment, 10: 224-233. https://doi.org/10.1016/j.rsase.2018.04.002
[16] Wei, L., Luo, Y., Wang, M., Su, S., Pi, J., Li, G. (2020). Essential fragmentation metrics for agricultural policies: Linking landscape pattern, ecosystem service and land use management in urbanizing China. Agricultural Systems, 182(129): 102833. https://doi.org/10.1016/j.agsy.2020.102833
[17] De León, G., Pinedo, A., Martínez, J. (2014). Aplicación de sensores remotos en el análisis de la fragmentación del paisaje en cuchillas de la zarca, méxico. Investigaciones Geográficas, 84. https://doi.org/10.14350/rig.36568
[18] Li, S.J., Yang, B. (2015). Introducing a new method for assessing spatially explicit processes of landscape fragmentation. Ecological Indicators, 56: 116-124. https://doi.org/10.1016/j.ecolind.2015.03.031
[19] Hauser, L.T., Vu, G.N., Nguyen, B.A., Dade, E., Nguyen, H.M., Nguyen, T.T.Q., Le, T.Q., Vu, L.H., Tong, A.T.H., Pham, H.V. (2017). Uncovering the spatio-temporal dynamics of land cover change and fragmentation of mangroves in the Ca Mau peninsula, Vietnam using multi-temporal SPOT satellite imagery (2004-2013). Applied Geography, 86: 197-207. https://doi.org/10.1016/j.apgeog.2017.06.019
[20] Chamling, M., Bera, B. (2020). Spatio-temporal patterns of land use/land cover change in the bhutan–bengal foothill region between 1987 and 2019: Study towards geospatial applications and policy making. Earth Systems and Environment, 4(1): 117-130. https://doi.org/10.1007/s41748-020-00150-0
[21] Mugiraneza, T., Ban, Y., Haas, J. (2019). Urban land cover dynamics and their impact on ecosystem services in Kigali, Rwanda using multi-temporal Landsat data. Remote Sensing Applications: Society and Environment, 13: 234-246. https://doi.org/10.1016/j.rsase.2018.11.001
[22] López, S., López-Sandoval, M.F., Gerique, A., Salazar, J. (2020). Landscape change in Southern Ecuador: An indicator-based and multi-temporal evaluation of land use and land cover in a mixed-use protected area. Ecological Indicators, 115: 106357. https://doi.org/10.1016/j.ecolind.2020.106357
[23] Sharma, S., Bista, M., Mingshi, L. (2019). Characterizing changes in land cover and forest fragmentation in Dhorpatan Hunting Reserve of Nepal from multi-temporal Landsat observations (1993-2018). BioRxiv. https://doi.org/10.1101/846741
[24] Kadıoğulları, A.I. (2013). Assessing implications of land use and land cover changes in forest ecosystems of NE Turkey. Environmental Monitoring and Assessment, 185(3): 2095-2106. https://doi.org/10.1007/s10661-012-2691-0
[25] Tang, J., Bu, K., Yang, J., Zhang, S., Chang, L. (2012). Multitemporal analysis of forest fragmentation in the upstream region of the Nenjiang River Basin, Northeast China. Ecological Indicators, 23: 597-607. https://doi.org/10.1016/j.ecolind.2012.05.012
[26] Salido Pérez, G.A. (2015). Buenas prácticas para la definición de redes ecológicas en España. Universidad de Alicante y WWF España, 1-11. http://awsassets.wwf.es/downloads/buenas_practicas_para_la_definicion_de_redes_ecologicas_en_espana_gr.pdf. accessed on Aug. 30, 2020.
[27] Correa, C.A., Mendoza, M.E., López, E. (2014). Analysis of changes in landscape structural connectivity (1975-2008) of Cuitzeo Lake basin, Michoacan, Mexico. Revista de Geografia Norte Grande, 2014(59): 7-23. https://doi.org/10.4067/S0718-34022014000300002
[28] Forman, R.T.T., Godron, M. (1981). Patches and structural components for a landscape ecology. BioScience, 31(10): 733-740. https://doi.org/10.2307/1308780
[29] Taylor, P.D., Fahrig, L., With, K.A. (2006). Landscape connectivity: A return to the basics. Connectivity Conservation, Cambridge University Press, 29-34. https://doi.org/10.1017/CBO9780511754821
[30] de Facatativá, A. (2002). Plan de ordenamiento territorial 2001-2021 Facatativá. Facatativá.
[31] Paruelo, J., Guerschman, J., Verón, S. (2005). Expansión agrícola y cambios en el uso del suelo. Ciencia hoy, 15(87): 14-23.
[32] Aguilar Arias, H., Mora Zamora, R., Vargas Bolaños, C. (2015). Metodología para la corrección atmosférica de imágenes aster, rapideye, spot 2 y landsat 8 con el módulo flaash del software envi. Atmospheric Correction Methodology for Aster, Rapideye, Spot 2 and Landsat 8 Images With Envi Flaash Module Software. Revista Geográfica de América Central, 2(53). https://doi.org/10.15359/rgac.2-53.2
[33] Chander, G., Markham, B.L., Helder, D.L. (2009). Summary of current radiometric calibration coefficients for Landsat MSS, TM, ETM+, and EO-1 ALI sensors. Remote Sensing of Environment, 113(5): 893-903. https://doi.org/10.1016/j.rse.2009.01.007
[34] Lister, A.L.T., Weber, T. (2019). Semi-automated sample-based forest degradation monitoring with photointerpretation of high-resolution imagery. Forests, 10(10): 896. https://doi.org/10.3390/f10100896
[35] Quiroz, H.O.A.C. (2010). Leyenda Nacional de Coberturas de la Tierra. Metodología CORINE Land Cover adaptada para Colombia Escala 1: 100.000. IDEAM.
[36] McGarigal, K. (2015). Fragstats help. Department of Environmental Conservation, 1-8. https://doi.org/10.1002/ejoc.201200111
[37] McGarigal, K., Cushman, S., Ene, E. (2012). FRAGSTATS v4: Spatial pattern analysis program for categorical and continuous maps. Computer Software Program Produced by the Authors at the University of Massachusetts, Amherst. http://www.umass.edu/landeco/research/fragstats/fragstats.html.
[38] Çakir, G., Sivrikaya, F., Keleş, S. (2007). Forest cover change and fragmentation using Landsat data in MaÇka State Forest Enterprise in Turkey. Environmental Monitoring and Assessment, 137(1-3): 51-66. https://doi.org/10.1007/s10661-007-9728-9
[39] Sapena, M., Ruiz, L.A. (2015). Descripción y cálculo de índices de fragmentación urbana: Herramienta IndiFrag. Revista de Teledeteccion, 2015(43): 77-89. https://doi.org/10.4995/raet.2015.3476
[40] Sapena, M., Ruiz, L.A., Palomar, J.M. (2015). Estudio evolutivo de los usos del suelo urbano mediante índices de distribución espacio-temporal. XVI Congreso de la Asociación Española de Teledetección, 1-4.
[41] Beltran, J.R.A.G.D.R.B.R. (2014). La economia de Facatativa. Universida minuto de Dios, 561-563. https://issuu.com/maleja26/docs/economia_de_facatativa_-_copia, accessed on Aug. 30, 2020.