Rana Ashraf Kandil* | Alaa Sarhan | Rania Elsayed AbdelGalil
© 2020 IIETA. This article is published by IIETA and is licensed under the CC BY 4.0 license (http://creativecommons.org/licenses/by/4.0/).
OPEN ACCESS
At recent times, rapid urbanization growth occurs in numerous cities, thus this creates many issues, leading to local ecological degradation. So, an evaluation tool has been proposed to measure this ecological balance issue (EBI) to assess the urban sustainability of a city which is an Ecological Footprint Analysis (EFA) tool. This paper aims to measure the imbalance of consumption/production of built-up land in Alexandria city by using the EFA tool. In order to assess a holistic picture of the urban sustainability of built-up land, the researcher collected all the relevant data during this time-series (2005-2019) from the local authorities. In the accounts of ecological footprint (EF), the parameters of built-up land are set as equal to those of cropland, based on the assumption that built-up land is totally converted from cropland. However, built-up land may be derived from other types of land use, but the cropland ranks as the most productive use. So, one of the objectives of this paper is to compare between the built-up land and cropland to ascertain the extent of loss on cropland. The researcher concludes that the Ecological Footprint (EF) of built-up land is larger than the bio-capacity (BC) of built-up land, resulting in an existing ecological balance issue (ecological deficit), this can be considered as urban unsustainable pattern. Consequently, the researcher has been suggested guidelines and recommendations responding to the final results of measurements so that more decisions can be taken to move towards the urban sustainability progress by observing the local realities for Alexandria's vision of 2050.
ecological balance issue (EBI), rapid urbanization, ecological footprint analysis tool (EFA), ecological footprint (EF), bio-capacity (BC), built-up land, urban sustainability, ecological deficit
The continuous rapid urbanization growth creates many issues such as overpopulation, overconsumption, increasing pollution, infrastructure deterioration, urban overcrowding, and low quality of life, all these are leading to local ecological degradation [1-3]. The concept of sustainability has become a trend towards developing and improving the countries from all over the world since 1987 (Bruntland report) [2, 4]. Determining the ecological balance issue (EBI) through measuring the urban sustainability and converting it into a functional model is vital for balancing [3, 5]. Therefore, more academic efforts have been made to explore methods and measurements for assessing the sustainability, such as emergy analysis, material flow analysis, data development analysis, and ecological footprint analysis [4, 6].
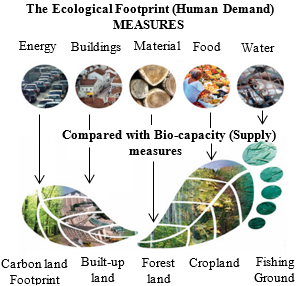
Among them, Ecological Footprint Analysis (EFA) tool has been applied in this paper to determine the Ecological balance issue in order to assess the urban sustainability of a city. Mathis Wackernagel and William Rees have been defined the Ecological Footprint (EF) is used to measure how much people consume resources (Food, Buildings, Transportation, Material and Waste, Water, and Energy) and generate wastes, thus EF is converted into actual land areas (Cropland, Grazing land, Built-up land, Fishing grounds, Forest land, and Energy land) [5]. Additionally, the EF is compared with the available area of Bio-capacity (BC) that measures how much nature can absorb our waste and generate new resources (Figure 1). The both EF and BC are measured in global hectares (gha) [7-9].
Consequently, the ecological balance issue (EBI) can be determined by comparing the EF and BC, as EBI is the difference between the EF and BC so it can be known whether a city is sustainable or nor. In case if the EF exceeds the BC, so the ecological deficit (ED) exists, this system can be considered as an unsustainable pattern. By contrast, in case if the BC is bigger than the EF, so the ecological reserve (ER) exists, this system can be considered as sustainable pattern [9].
In this paper, Alexandria city, Egypt was selected as a case study to apply the EFA tool for assessing the built-up land footprint (one of the EFA resources). Under such circumstances, the researchers believe that this study by using EFA tool can help recognize different development patterns and identify the optimal pathway sustainable urban development. Consequently, the aim of this paper is to measure the imbalance of consumption/production of built-up land in Alexandria city by using (EFA) tool to assess the urban sustainability during this time-series (2005–2019). The objectives of this paper are to:
Figure 1. Converting consumption into land area
2.1 Study area
Alexandria Governorate, located on the Mediterranean Sea 210 km north of Cairo which is the second-largest city in Egypt, has a population of 5.3 million inhabitants with a total area of 230,000 hectares (2300 km2) in the year of 2020, of which more than 95% lives in Alexandria city and the rest lives in Burg Al Arab new town and its surrounding [10]. Alexandria acquired a unique place in history as a cosmopolitan city and a cultural landmark. Alexandria city was chosen as a case study due to several reasons. First, because of significant resource consumption and facing serious environmental challenges which are shown that Alexandria ranks the 6th most over-consumption city out of 180 cities on the Mediterranean level cities (Figure 2) [11, 12].
Second, many contacts have been undertaken with the endorsement of city government, mainly in the field of urban planning for allowing access to data, and allowing investigations with local authorities [10, 13-15]. Third, Alexandria city is facing some political challenges that impacted negatively on the city, where the exploitation of the security vacuum led to a rapid illegal increase in the built-up area [15].
Furthermore, fourth, Alexandria ranks as the 1st most populated city in the Mediterranean cities in 2020 due to the rapid population growth has increased 2.3% growth rate recently from 2005-2020, thus, the population growth rate reaches 0.15% annually that impacted negatively on the city’s infrastructure (Table 1) [12]. Finally, fifth, with rapid urbanization, Alexandria faces many environmental matters, leading to local ecological degradation, and infrastructure deterioration.
Figure 2. The rank of over-consumption trend by categories on the Mediterranean level cities
Table 1. The over-consumption population cities on Mediterranean level cities
|
Rank |
City |
Country |
Population |
|
1 |
Alexandria |
Egypt |
5,379,488 |
|
2 |
Algiers |
Algeria |
3,415,811 |
|
3 |
Rome |
Italy |
2,866,793 |
|
4 |
Izmir |
Turkey |
2,847,691 |
|
5 |
Beirut |
Lebanon |
2,226,000 |
|
6 |
Tripoli |
Libya |
2,127,000 |
|
7 |
Mersin |
Turkey |
1,773,852 |
|
8 |
Barcelona |
Spain |
1,620,943 |
|
9 |
Antalya |
Turkey |
1,203,994 |
|
10 |
Nice |
France |
1,005,230 |
Source: CAPMAS, (2019)
2.2 Areas of built-up land and cropland
The element ‘Area (A)’ is essential in the calculation of built-up land footprint as well as in cropland for the EF and BC. Consequently, the researchers have been collected the data related to the areas of built-up land and urban extent that happened to Alexandria during this Time-Series (2005-2019). Table 2 shows that the annual % change in the built-up area of Alexandria per year is increasing by about 2.7% [11]. Additionally, it shows that the areas of built-up land and cropland to realize the happened deterioration at recent time [10, 11].
The cropland area decreased from 30,161 (ha) in 2005 to 22,780 (ha) in 2017, with a decrease rate of 24.48%, While Built-up land area increased from 119,188 (ha) in 2005 to 167,550 (ha) in 2017, with a growth rate of 40.5%. The Cropland occupies from the total area of Alexandria about 9.4% in 2019 from 13.1% in 2005. Meanwhile, the Built-up land area occupies from the total area about 76.8% in 2019 from 51.8% in 2005, indicating that there is an extended loss happened on the cropland areas from built-up land. In Figure 3 shows the urban extent of built-up area in Alexandria during the years of (1987-2013) in the map below [11]. Unfortunately, there are no recent maps of the urban sprawl in Alexandria, but that map below is the most recent which illustrates the rapid urban expansion of Alexandria.
Table 2. Areas of Built-up land and Cropland (Source: CAPMAS, 2020 [12])
|
Year |
Built-up land Areas (Hectare) |
% of built-up Area to total area |
Cropland Areas (Hectare) |
% of Cropland area to total area |
|
2005 |
119,188 ha |
51.8% |
30,161 ha |
13.1% |
|
2006 |
122,406 ha |
53.2% |
29,345 ha |
12.7% |
|
2007 |
125,711 ha |
54.7% |
28,553 ha |
12.4% |
|
2008 |
129,105 ha |
56.1% |
27,783 ha |
12.1% |
|
2009 |
132,591 ha |
57.6% |
27,033 ha |
11.8% |
|
2010 |
137,790 ha |
59.9% |
27,085 ha |
11.8% |
|
2011 |
141,510 ha |
61.5% |
26,354 ha |
11.5% |
|
2012 |
145,660 ha |
63.3% |
25,855 ha |
11.2% |
|
2013 |
149,593 ha |
65.0% |
25,157 ha |
10.9% |
|
2014 |
153,632 ha |
66.8% |
24,478 ha |
10.6% |
|
2015 |
158,502 ha |
68.9% |
24,010 ha |
10.4% |
|
2016 |
162,782 ha |
70.8% |
23,362 ha |
10.2% |
|
2017 |
167,550 ha |
72.8% |
22,780 ha |
9.9% |
|
2018 |
172,074 ha |
74.8% |
22,165 ha |
9.6% |
|
2019 |
176,720 ha |
76.8% |
21,567 ha |
9.4% |
Source: CAPMAS annual report, (2005-2019), and Alexandria Governorate Office, (2019)
Figure 3. The urban extent happened to Alexandria during the years of 1987-2013
2.3 Methods and measurements of EFA tool
2.3.1 Equivalence Factor (EQF)
In order to conduct a comparison between Ecological Footprint accountings and Bio-capacity accountings for a given country. It must estimate the Equivalence factor (EQF) as it is used to convert actual areas (in hectares) of different land types into global hectares (gha) [16, 17]. The EQF is a common factor in both accountings of EF and BC. The Equivalence Factor measures the global average productive capacity of certain productive areas and is used to standardize various types of land so that the results can be combined into a single unit (gha). For all countries, the EQFs are the same, and change slightly from year to year [17].
Table 3. Cropland equivalence factors equal to the built-up land Equivalence Factors during this time-series (2005–2019)
|
Year |
Equivalence Factors (EQF) |
Sources |
|
2005 |
2.39 (gha) |
NFA report, (2005) |
|
2010 |
2.43 (gha) |
NFA report, (2010) |
|
2012 |
2.46 (gha) |
NFA report, (2012) |
|
2015 |
2.51 (gha) |
NFA report, (2015) |
|
2019 |
2.56 (gha) |
NFA report, (2019) |
Source: NFA Report, (2005–2019).
In this paper, the EQFs are derived from National Footprint Accounts (NFA) annual reports [18] in the case study during this time-series (2005-2020), thus the EQF of built-up land equals to the EQF of cropland based on the assumption that the built-up land is transformed from the cropland [16]. The EQFs are elaborated in Table 3 that used in the study area.
2.3.2 Local/National Biological Yield (YN)
In order to measure the EF, it must estimate what the local yield (YN) for each product of each type of land area, so the Local Yield (YN) defines as “the amount of regenerated primary product, usually reported in tons per hectare per year (t/ha/y)” [17]. The YN is derived from the food and agricultural organization of United Nations (FAO) annual reports on the local level for each country, it is publicly data on their official website, available at www.fao.org [19]. The total average YN of cropland are elaborated in Table 4 below.
Table 4. Total average Crop National Yield (YN) in Alexandria during this time-series (2005–2017)
|
Year |
Crop Average National Yield (YN) t/ha/yr |
|
2005 |
0.1788 t/ha/yr |
|
2010 |
0.2645 t/ha/yr |
|
2012 |
0.3289 t/ha/yr |
|
2015 |
0.2475 t/ha/yr |
|
2019 |
0.1656 t/ha/yr |
Source: FAOSTAT, (2005-2019)
2.3.3 Measurement of Cropland Footprint (EFCropland)
Cropland defines as “the area used to grow crops for food and fibers for human consumption as well as the area for animal feed, oil crops, and rubber” [6]. The crop products are being analyzed 20 products in this study. The EFCropland calculation is based upon the per capita consumption of biotic resources in various categories. The biotic resources include fruit, vegetables, barley, rice, potatoes, and so on. The EFCropland can be conducted by the following Eq. (1) [20].
In order to calculate the EFCropland, the required data must be known for the measurements as follows, total demand (Ci) amount of each crop product measured in (t/yr), yield (Yi) of each crop product measured in (t/ha/yr), equivalence factor (EQF) of cropland measured in (gha), and a number of populations for the given year. This type of data based on NFA annual reports and FAO annual reports.
$e{{f}_{Cropland(1)}}=\left( \mathop{EQF}_{Cropland(1)}\times \sum\limits_{j=1}^{i}{\left( \frac{\mathop{C}_{i}}{N\times \mathop{Y}_{i(1)}} \right)} \right)$ (1)
where, efCropland is the per capita ecological footprint for a given land area; Ci is the total demand for the ith product by all the populations in the study region in tons; i is the number of products being analysed (i= 20 in the case study); N represents the local population, Yi is the local biological yield for the ith product provided by cropland (t/ha), and EQFCropland is an equivalence factor for the cropland.
2.3.4 Measurement of Built-up land Footprint (EFBuilt-up land)
Built-up land defines as “the area of land covered by human infrastructure including transportation, housing, industrial structures and reservoirs for hydropower” [4]. NFAs, (2011), assumes that the built-up land is located in the fertile areas, built-up land often leads to the irrevocable loss of significant amounts of bio-capacity [20]. This ecological footprint assumes that the built-up area is transformed mostly from prime agricultural land and can be calculated by Eq. (2) to measure the EFBuilt-up land [21]. Built-up land can be transformed from other types of land Since the EQF vary substantially among different land uses, whilst the factors of cropland usually high-yielding cropland, the assumption may overestimate the EF of built-up land [21, 22].
$e{{f}_{Built-upland(5)}}=\frac{\mathop{A}_{5}(ha)\times \mathop{EQF}_{Built-upland(5)}\left( \frac{gha}{ha} \right)}{N\times \mathop{Y}_{5}}$ (2)
where, efbuilt-up(5) represents the per capita built-up land footprint in global hectare (cap/gha); A5 is the actual amount of built-up area in hectare (ha); EQF5 is the equivalence factor of the built-up land and equals to EQF1 (the equivalence factor of cropland) in global hectare (gha); Y5 is the local yield for the ith product provided by the built-up land and equals to Y1 (the local yield of cropland) in (t/ha/y); N is the local population.
2.3.5 Measurement of Yield Factor (YF)
In order to measure the bio-capacity (BC), it must calculate the Yield Factors (YF) for each type of land. The Yield Factors (YF) reflect the relative productivity of the national and global average hectare for a particular type of land use [17]. Each country and each year have yield factors for cropland, grazing land, forest land, and fisheries.
For yield factor (YF) of built-up land is set equal to yield factor (YF) of cropland, the cropland measurements are used in the case study as a proxy measure of the built-up land bio-capacity accountings [23, 24]. According to NFAs, (2011) and (2017), Cropland produces more than one primary product. For this land-use type, the Yield Factor of cropland is calculated by this following Eq. (3) [25, 26].
$\mathop{YF}_{N}^{L}=\frac{\sum{\mathop{A}_{W}}}{\sum{\mathop{A}_{N}}},Where\mathop{A}_{N}=\frac{\mathop{P}_{N}}{\mathop{Y}_{N}}and\mathop{A}_{W}=\frac{\mathop{P}_{N}}{\mathop{Y}_{W}}$ (3)
where, $\mathrm{YF}_{\mathrm{N}}^{\mathrm{L}}$= Yield factor for a given country and land use type, wha nha-1 (world hectare/national hectare); AN = Area harvested for a given quantity of product in a given country, nha-1 (national hectare); AW = Area that would be required to produce a given quantity of product using world average land, wha-1 (world hectare); PN = Amount of given product extracted, or waste generated in a country, t yr-1 (tones/year); YN = National yield for product extraction, t nha-1 yr-1 (tones/national hectare/year); and YW = World-average yield for product extraction, t wha-1 yr-1 (tones/world hectare/year).
2.3.6 Measurement of Bio-capacity (BC)
When calculating bio-capacity, it is a normal practice to allocate 12% of the available supply land to protect the local biodiversity [20]. The researchers focused on the measurements of Bio-capacity for Built-up land (BCBuilt-up land) and Cropland (BCCropland) in the case study of Alexandria. The calculation of BC of one land area can be conducted by the following Eq. (4) [26, 27].
$\mathrm{x} \mathrm{BC}=\frac{\mathrm{A}_{\mathrm{j}} \times \mathrm{EQF}_{\mathrm{j}} \times \mathrm{YF}_{\mathrm{j}} \times(100-12) \%}{\mathrm{N}}$ (4)
where, BC is the per capita bio-capacity of a given land type (gha); Aj is the total available supply in a given year for the j type of land (ha); Qj is the Equivalence Factor of a given land type (gha); YFj is the Yield Factor of a given land type (gha); and N is the local population.
2.3.7 Measurement of Ecological Balance Issue (EBI)
An ecological balance (EBI) is calculated by subtracting the ecological footprint from bio-capacity to determine if there is an ecological deficit or reserve as shown in the Eq. (5). If ecological footprint exceeds bio-capacity, an ecological deficit exists, and the system is considered unsustainable. Conversely, if bio-capacity exceeds ecological footprint, then such a system is considered sustainable [20, 28, 29].
EBI=BCj-EFj (5)
where, EBI is the Ecological Balance Issue; EF is the ecological footprint for the given land area; BC is the bio-capacity for the given land area; where EF > BC, Ecological Deficit (ED) exists, unsustainable, while EF < BC, ED does not exist, sustainable, so it will be Ecological Reserve (ER).
2.4 Data sources and collection
The researchers are reviewed published technical and governmental reports and papers, web pages and statistical reports. To measure the EFA for built-up land and cropland, thus, the required data is collected from different sources as shown in the Table 5.
The difference between Ecological footprint (EF), Bio-capacity (BC), and Ecological deficit (ED) if the former is larger or reserve otherwise, indicates the ecological balance of the study system, which can then be used to identify to what extent the local environment can support the local activities. Figure 3 shows the total EF, BC and ED by all populations for Built-up land and Cropland of Alexandria from 2005 to 2020. The EFBuilt-up land of Alexandria in 2005 was 1,592,371 (gha), increasing to 3,333,023 (gha) in 2019, with a growth rate of 47.76% (Figure 4). It has increased as a result of 14 years’ rapid growth. Meanwhile, the BCBuilt-up land of Alexandria has increased from 1,387,271 (gha) in 2005 to 2,489,197 (gha) in 2019 with an increase rate of 55.73%, resulting in the Ecological Deficit (EDBuilt-up land) of 205,100 (gha) in 2005 and 843,826 (gha) in 2019 (Figure 3). The main reason for Alexandria to have an increased BCBuilt-up land is that the cropland yield factor increased during the study period (increased from 5.9369 (wha/nha) in 2005 to 6.05597 (wha/nha) in 2019).
On the other side, EFCropland of Alexandria in 2005 decreased from 1,365,304 (gha) to 553,173 (gha) in 2019. It has decreased to the third as a result of increasing the EFBuilt-up land, indicating that there is an infringement on cropland, and this means that the built-land consumption resource is more than cropland consumption, leading to the decrease of total demand (Ci) for the crop products by all populations (decreased from 101,352 (tons/yr) in 2005 to 34,487 (tons/yr) in 2019, with a decrease rate of 65.9%).
While the BCCropland of Alexandria in 2005 was 354,597 (gha), decreasing to 350,581 (gha) in 2019, resulting in the EDCropland of 1,000,168 (gha) in 2005 and 262,591 (gha) in 2017 (Figure 3), indicating that the cropland area decreased from 30,161 (ha) in 2005 to 21,567 (ha) in 2019, with a decrease rate of 24.48% during the study period.
Besides, there are two aspects as follows impacting the measurements of EFBuilt-up land and EFCropland; (1) the area of built-up land, and (2) total demand for products by all population. Thus, the first aspect (Area of land) is increasing continuously over the years, while the second aspect (Total Demand) is decreasing through the studying period. For the BCCropland decreased with a rate of 76.69% (Figure 4) from (2005 to 2019). consequently, the Table 4 shows the figures has a small value as it was divided by number of populations per year, due to urban development, and this indicates that Alexandria is located in a highly urbanized area.
Table 5. Type of data and sources for the period of (2005-2019)
|
Alexandria |
|
|
Type of Data |
Source of Data |
|
Areas of Built-up land measured in (ha) for the time-series (2005-2019) (ABuilt-up land), and Areas of Cropland measures in (ha) for the time-series (2005-2019) (ACropland) |
Alexandria’s Statistical Yearbooks (Alexandria Municipal Government, 2005 – 2019), and CAPMAS annual statistical yearbook (Central Agency for Public Mobilization and Statistics, 2005 – 2019) |
|
Number of populations for the period of (2005-2019) (N) |
Alexandria’s Statistical Yearbooks (Alexandria Municipal Government, 2005 – 2019), and CAPMAS annual statistical yearbook (Central Agency for Public Mobilization and Statistics, 2005 – 2019) |
|
Equivalence Factors for the time-series (2005-2019) (EQF) |
collected from Living Planet Report (WWF, 1999 – 2019), and National Footprint Accounts (NFA, 1999 – 2019) |
|
Total demand for ith product by all population (Ci) |
Food and Agriculture Organization (FAO) of United nations (data publicly available from this website: http://www.fao.org/faostat/en/#compare). |
|
To calculate the Yield Factor (YF) based on collected the data from: |
|
|
National Yield per product measured in (nha) (YN), and World Yield per product measured in (wha) (YW) |
Food and Agriculture Organization (FAO) of United nations (data publicly available from this website: http://www.fao.org/faostat/en/#compare). |
|
Amount of crop products measured in (tons) (PN) for Alexandria, number of products have been analyzed in this case study (20 Product) |
Food and Agriculture Organization (FAO) (data publicly available from this website: http://www.fao.org/faostat/en/#compare), and CAPMAS annual statistical yearbook (Central Agency for Public Mobilization and Statistics, 2005 – 2019) |
|
Maps |
|
|
GIS Maps of Alexandria showing the changes of Built-up areas through years |
Atlas of Urban Extension official website |
|
Land-use map of Alexandria and Proposal showing the vision 2050 for Alexandria |
Regional Centre of Urban planning and Development for the vision of 2050, (2019), Ministry of Housing |
Figure 4. Total Ecological Footprint, Bio-capacity, and Ecological Deficit of Built-up land and Cropland for the year of (2005-2019)
The EFBuilt-up land fell from 1,592,371 (gha) in 2005 to 1,265,641 (gha) in 2010, with a decrease rate of 20.52% (Fig. 4) due to the decrease of local yield (YN). On the other side, there is a clear drop happened from 2005 to 2015 in the measurements of BCBuilt-up land as it is decreased from 1,387,271 (gha) in 2005 to 1,102,653 (gha) in 2010 due to the decrease of YF through this period (decreased from 5.95369 (wha/nha) in 2005 to 3.77956 (wha/nha) in 2010). Consequently, the EDCropland decreased with a rate of 82.3%, indicating that Alexandria exported cropland products to other regions from (2005 to 2019). During the same period, the EFCropland decreased with a rate of 60.65% that seems a good indicator but in actual situation, there is an illegal increase in built-up land areas over the cropland areas which are impacted negatively on the local productivity of Alexandria.
After measuring the total Built-up land and Cropland Footprint, the researcher was divided the total EF for the built-up land and cropland by number of populations of a given year to know individual needs for the built-up land and cropland, in comparing with the per capita BC. Table 6 lists the final results of per capita EFBuilt-up land, EFCropland, BCBuilt-up land, BCCropland, EDBuilt-up land, and EDCropland in Alexandria for this time-series (2005-2019).
The per capita EFBuilt-up land in Alexandria increased from 0.28788 (gha/cap) in 2010 to 0.61958 (gha/cap) in 2019 as shown in the Figure 5. It has doubled as a result of 9 years’ rapid growth during this period. Overall, the per capita EFBuilt-up land in Alexandria increased from 0.41296 (gha/cap) in 2005 to 0.61958 (gha/cap) in 2019, with a growth rate of 17.45%. While the per capita EFCropland decreased from 0.35134 (gha/cap) in 2005 to 0.10283 (gha/cap) in 2019, with a decrease rate of 70.7%.
The per capita BCbuilt-up land in Alexandria increased from 0.35977 (gha/cap) in 2005 to 0.46272 (gha/cap) in 2019, with a growth rate of 17.44%, while such a value of BCCropland in Alexandria decreased from 0.09196 (gha/cap) in 2005 to 0.06517 (gha/cap) in 2019, with a decrease rate of 34.9% (Figure 5). Such a smaller value is mainly since Alexandria has a much smaller urbanized area, with a high population density.
With such values, the per capita EDBuilt-up land in Alexandria increased from 0.05319 (gha/cap) in 2005 to 0.15686 (gha/cap) in 2020, with a growth rate of 33.9%, indicating that on average one person living in Alexandria demands more bio-productive area to support his/her urban life due to the over-population in Alexandria. It also reflects a clear difference through this time-series analysis (2005 – 2019), in terms of their living standards, urbanization rate, and industrial development levels. Meanwhile, the per capita EDCropland decreased from 0.25938 in 2005 to 0.03766 in 2020, with a decrease rate of 83.40%.
Table 6. Per capita of Ecological Footprint, Bio-capacity, and Ecological Deficit for Built-up land and Cropland of Alexandria in (2005–2019)
|
Years |
Ecological Footprint of Built-up land (EFBuilt-up land) |
Ecological Footprint of Cropland (EFCropland) |
Bio-capacity of Built-up land (BCBuilt-up land) |
Bio-capacity of Cropland (BCCropland) |
Ecological Deficit of Built-up land (EDBuilt-up land) |
Ecological Deficit of Cropland (EDCropland) |
|
2005 |
0.41296 (gha/cap) |
0.35134 (gha/cap) |
0.35977 (gha/cap) |
0.09196 (gha/cap) |
-0.05319 |
-0.25938 |
|
2006 |
0.44016 (gha/cap) |
0.20181 (gha/cap) |
0.38347 (gha/cap) |
0.08801 (gha/cap) |
-0.05669 |
-0.11380 |
|
2007 |
0.45322 (gha/cap) |
0.15972 (gha/cap) |
0.29485 (gha/cap) |
0.06621 (gha/cap) |
-0.15837 |
-0.09351 |
|
2008 |
0.46260 (gha/cap) |
0.10960 (gha/cap) |
0.24090 (gha/cap) |
0.05431 (gha/cap) |
-0.22170 |
-0.05529 |
|
2009 |
0.28201 (gha/cap) |
0.07914 (gha/cap) |
0.24570 (gha/cap) |
0.03767 (gha/cap) |
-0.03631 |
-0.04147 |
|
2010 |
0.28778 (gha/cap) |
0.08076 (gha/cap) |
0.25072 (gha/cap) |
0.04865 (gha/cap) |
-0.03706 |
-0.03211 |
|
2011 |
0.23088 (gha/cap) |
0.09388 (gha/cap) |
0.19778 (gha/cap) |
0.02726 (gha/cap) |
-0.03310 |
-0.06662 |
|
2012 |
0.23862 (gha/cap) |
0.15082 (gha/cap) |
0.20788 (gha/cap) |
0.03728 (gha/cap) |
-0.03074 |
-0.11354 |
|
2013 |
0.31397 (gha/cap) |
0.15201 (gha/cap) |
0.24354 (gha/cap) |
0.03753 (gha/cap) |
-0.07043 |
-0.11448 |
|
2014 |
0.32032 (gha/cap) |
0.12201 (gha/cap) |
0.27907 (gha/cap) |
0.04270 (gha/cap) |
-0.04125 |
-0.07931 |
|
2015 |
0.33118 (gha/cap) |
0.10605 (gha/cap) |
0.28853 (gha/cap) |
0.04415 (gha/cap) |
-0.04265 |
-0.06190 |
|
2016 |
0.48602 (gha/cap) |
0.10257 (gha/cap) |
0.32343 (gha/cap) |
0.05815 (gha/cap) |
-0.16259 |
-0.04442 |
|
2017 |
0.50023 (gha/cap) |
0.10294 (gha/cap) |
0.43580 (gha/cap) |
0.05985 (gha/cap) |
-0.06443 |
-0.04309 |
|
2018 |
0.51007 (gha/cap) |
0.10095 (gha/cap) |
0.45430 (gha/cap) |
0.06103 (gha/cap) |
-0.05577 |
-0.03992 |
|
2019 |
0.61958 (gha/cap) |
0.10283 (gha/cap) |
0.46272 (gha/cap) |
0.06517 (gha/cap) |
-0.15686 |
-0.03766 |
Ecological Footprint of Built-up land and Cropland Per capita
Bio-capacity of Built-up land and Cropland Per capita
Figure 5. Ecological Footprint and Bio-capacity of Built-up land and Cropland Per capita for the period of (2005-2019)
Through calculating the bio-capacity of such areas, the demands placed by humans on these areas can be compared with their natural resources. For the comparison through the past 15 years in Alexandria during the time-series analysis (2005-2019), the outcomes of research indicate a clear disparity in ecological footprints of built-up land and cropland for Alexandria city, which need a further discussion for clarifying some related aspects and clarifying the impact extent loss of cropland.
First, Alexandria varies greatly in both their demand for and supply of natural resources over time, leading to different ecological footprints. Located in the inland area, the total demand of citizens for the crop products have been decreased during the years, leading to a much lower per capita ecological footprint of cropland. The impact extent loss on cropland from built-up land with a rate of 24.5% due to the decrease of cropland areas through the studying years. Thus, geographical location can have a direct impact on one of Alexandria's ecological footprints on cropland and should be considered.
Second, Alexandria requires large bio-productive areas for built-up land and cropland as well they hold in order to support people’s urban activities. Third, the ecological deficit in Alexandria for built-up land grew much faster than the cropland from 2005 to 2019, with a growth rate of 33.9%, indicating a fast urban development and a larger burden to the natural ecosystem.
Fourth, the per capita EFBuilt-up land in Alexandria in 2019 (0.61958 gha/cap) is higher than the world average (0.061 cap/gha) (WWF, 2019). Furthermore, the per capita BCBuilt-up land is 0.46272 (gha/cap) in 2019 is less than the world average per capita BCBuilt-up land (1.0 gha/cap) (WWF, 2019). This indicates that planners and researches must to decrease the EF of built-up land, on the other side, increasing the BC of built-up land to reach the 1.0 gha/cap (world-average) would be needed if everyone consumed in order to keep the balance between the EF and BC.
In General, the comparison between this time-series analysis (2005-2019) provided a lot of useful information and findings to decision-makers so that they can put a strategy and polices decisions to make progress towards sustainable development.
With rapid urbanization worldwide, cities are becoming the main pollution sources due to their complicated human activities. Scientific evaluation of their ecological footprints can provide valuable insights to policymakers so that sustainable development patterns can be recognized and appropriate policies can be raised by considering the local realities. This paper contributes to the endeavor research by employing a case study in Alexandria. Time series data have been collected so that their evolutional pathways can be uncovered. The comparison of ecological footprint accounts for built-up land and cropland between the time series can help recognize the unsustainable patterns of Alexandria in the case of these types of areas.
Alexandria has been experiencing rapid urban development, including a huge investment in its infrastructure, industrial businesses, and social welfare, leading to rapid increase in its total EFBuilt-up land. In this regard, time-series analyses provided a better and holistic picture of their different development pathways, therefore, helping recognize the gap and facilitate appropriate policymaking for their future. Although the total EFBuilt-up land is already much higher than that EFCropland, due to its large population, rapid urban growth within the living space of Alexandria, and infringement on cropland in the city; the per capita EFBuilt-up land is still increasing through the years in Alexandria. This reflects that Alexandria is in its late urbanization progress and a great gap exists between the periods of 2005 – 2019.
The per capita Ecological Footprint of built-up land in Alexandria for the year of 2019 increased more than the world average, with a growth rate of 87.81%, while the per capita Bio-capacity of built-up land decreased more than the world average, with a decrease rate of 56.42%. Meanwhile, the total EFBuilt-up land by all populations in Alexandria increased more than the total world average, with a growth rate of 41.23% in 2019, whilst the total BCBuilt-up land by all populations in Alexandria in 2020 decreased more than the total world average, with a decrease rate of 31.43%, indicating that on average one person living in Alexandria demands for 2.5 times more bio-productive area to support his/her urban life to reach the global rate.
The researcher draws the extrapolation from the present situation as well as illustrating the standard scenario that EFBuilt-up land is still increasing due to the over-populations till the year 2019. However, many solutions must be proposed to avoid the deterioration that may be happened to the city, so the expected scenario in the future is the decrease of EFBuilt-up land and increase its BCBuilt-up land. Consequently, the high footprint brings serious threats to the local population and environment, and it is impacted negatively on the livability in Alexandria that is why officials in the city ought to create strategic plans for improving the built-up land footprint to achieve the global urban sustainability.
Urban planners ought to be focused on the growth urbanization out the limits of specific living areas in Alexandria to avoid the population and urban congestion in the future. Moreover, the demolition of building too much in the recent times due to the over-population density, besides that, the most of the constructions in the city is residential about 45.90% (official statistics) [13], this can be considered as a limitation, in fact, the local reality that the capacity of buildings are more than this statistrics as it ranges from 65-80% [13, 14]. In conclusion, the city has become full of people and this impacts negatively on the quality of life for the citizens in terms of liveability, social welfare, etc.
The results from this analysis shed light on Alexandria’s EFBuilt-up land footprint and the impact extent loss on cropland. Alexandria has an ecological deficit in both built-up land and cropland footprint. For the vision 2050, the EFBuilt-up land should be improved to help Alexandria to have an ecological reserve when its footprint is smaller than its bio-capacity referred to its ecological creditors. Finally, to reduce EFBuilt-up land, eliminate Ecological Deficit, and recover BCBuilt-up land, so it must improve production systems, change consumption patterns, and control the population. Consequently, it will protect, manage, and recover the natural eco-systems.
Here, it has been displayed some limitations that were faced in this research; firstly, the EFA is a useful tool for evaluating one city’s sustainability, the lack of correlation between land degradation and the ecological footprint, which obscures the effects of larger sustainability problems, influences its effectiveness [25, 28-30]. In addition, the component accounting method applied in this study may produce erratic results, given life cycle analysis (LCA)’ boundary problems, lack of accurate and complete information about products’ life-cycles, problems of double-counting in the case of complex chains of production with many primary products and by-products, and a large amount of detailed knowledge necessary for each analyzed process [31-33].
Secondly, while using the EFA tool to measure the built-up land and cropland footprint, it has been found that there was shortage in the official data for Alexandria city, which obtained from CAMPAS and Alexandria governorate offices, so the researcher has forced to use other external sources like FAO and Atlas of Urban Extension official websites, and this can be considered as a limitation. Nevertheless, the final results provide valuable insights to different pictures of ecological footprints through the studying years.
Finally, the researchers have given some guidelines and recommendations for improving the Ecological Footprint for built-up land and cropland of Alexandria. First, in order to further improve its sustainable development, Alexandria should be established a collaboration mechanism with a similar city in order to further improve the application of novel environmental management measures and environmental technologies. In this regard, broader collaborative initiatives between Alexandria and other similar city can be fruitful to programmatic policy initiatives.
Second, organizing workshops to release the outcomes and provide policy comments based on the future research outcomes after measuring the ecological footprint for the whole resources. It can also help planners and researchers for greater clarity in research outcomes so that research objectives can be achieved. The participants of workshops are going to explain that the further study will be solely for academic purposes and their comments will remain strictly confidential.
Third, assessing the availability and quality of data required to carry out this type of analysis, and in certain instances make further recommendations to improve data requirements for resource flow and Ecological Footprint analysis such as making surveys to provide the missing documents. Fourth, it is critical to establish more scientifically supportive and comprehensive political performance indicators so as to aid the legitimacy of economic and environmental decisions.
Lastly, fifth, Officials in Alexandria should consider how to reduce their demand on built-land resource. Especially, Alexandria has to pay more attention on its next development pathway and cannot use such an excuse (lower per capita ecological footprint) to release its own responsibility. Therefore, a sustainable development pathway has to be identified by considering the local realities. Consequently, we must keep in the balance between EF and BC not be tricked by reducing the EF.
Urban planners already are working on vision 2050, struggling with the expected population growth. The decision-makers made a proposal for 2050, creating five new administrative districts, extended to Alexandria under the name of "GREATER ALEXANDRIA" [15]. Hence, this research is timely, to measure the total ecological footprint for the six types of bio-productive lands to assess the sustainability in Alexandria city for supporting the vision 2050 and show the demands and supplies for the other resources.
This study is supported by Arab Academy for Science, Technology, and Maritime Transport. We thank the authorities from Alexandria Municipal Government, Central Agency for Public Mobilization and Statistics, and Ministry of Housing who provided insight and expertise that greatly helped the research and granted us the yearly statistical reports.
|
ABuilt-up land |
Area of Built-up land, ha |
|
ACropland |
Area of Cropland, ha |
|
BCBuilt-up land BCCropland |
Bio-capacity of Built-up land, gha Bio-capacity of Cropland, gha |
|
Ci |
Total Demand, t/yr |
|
EFBuilt-up land |
Ecological Footprint of Built-up land, gha |
|
EFCropland |
Ecological Footprint of Cropland, gha |
|
EQF |
Equivalence Factor, gha |
|
PN |
Amount of Product, ton (t) |
|
YN |
National Yield, t/nha/yr |
|
YW |
World Yield, t/wha/yr |
|
YF |
Yield Factor, wha/nha-1 |
|
Subscripts |
|
|
BC |
Bio-capacity |
|
CAMPAS |
Central Agency for Public Mobilization and Statistics |
|
EF |
Ecological Footprint |
|
EFA |
Ecological Footprint Analysis |
|
ED |
Ecological Deficit |
|
ER |
Ecological Reserve |
|
EBI |
Ecological Balance Issue |
|
FAO |
Food and Agriculture Organization of the United Nations |
|
GFN |
Global Footprint Network |
|
gha |
Global hectares |
|
ha |
Hectares |
|
LCA |
Life Cycle Analysis |
|
nha |
National hectares |
|
NFA |
National Footprint Network |
|
wha |
World hectares |
|
WWF |
World Wildlife Fund the Nature |
[1] Kandil, R.A., Sarhan, A., Abdelgalil, R. (2019). Urban Ecological footprint analysis as an evaluation tool for sustainability: Analysis of the built-up land footprint of Alexandria city, Egypt. WIT Transactions on Ecology and the Environment, 238: 271-281. https://doi.org/10.2495/SC190241
[2] Our Common Future, Oxford England Oxford University. (1987). Press: Oxford, UK, 11: 53-78. https://sustainabledevelopment.un.org/content/documents/5987our-common-future.pdf, accessed on Jan. 02, 2020.
[3] Diamond, K. (2012). Ecological footprint accounting: measuring environmental supply and demand. https://newsecuritybeat.org/2012/09/ecological-footprint-accounting-measuring-environmental-supply-demand/, accessed on Jan. 03, 2020.
[4] Wackernagel, M. (2014). Ecological footprint policy? Land use as an environmental indicator. Journal of Industrial Ecology, 18(1): 20-23. http://dx.doi.org/10.1111/jiec.12094
[5] Wackernagel, M., Rees, W. (1996). Our Ecological Footprint: Reducing Human Impact on the Earth. 1st ed. New Society Publisher, Gabriola Island, BC, and Canada.
[6] Świąder, M., Lin, D., Szewrański, S., Kazak, J.K., Iha, K., van Hoof, J., Belčáková, I., Altiok, S. (2020). The application of ecological footprint and bio capacity for environmental carrying capacity assessment: A new approach for European cities. Environmental Science and Policy, 105: 56-74. https://doi.org/10.1016/j.envsci.2019.12.010
[7] Monfreda, C., Wackernagel, M., Deumling, D. (2004). Establishing national natural capital accounts based on detailed ecological footprint and biological capacity assessments. Land Use Policy, 21(3): 231-246. https://doi.org/10.1016/j.landusepol.2003.10.009
[8] Wackernagel, M., Chamber, N., Simmons, C. (2002). Sharing Nature’s Interest: Ecological Footprints as an indicator of Sustainability. Earthscan: London, UK.
[9] Global Footprint Network (GFN), (2017). Annual report. https://www.footprintnetwork.org/living-planet-report/, accessed on Jan. 01, 2020.
[10] Alexandria City Government Office, (2018). Annual statistical reports for the year (2004-2019). Alexandria Office, Egypt.
[11] Atlas of Urban Expansion, (2019). The city as a unit of analysis and the universe of cities. http://atlasofurbanexpansion.org/data, accessed Dec. 03, 2019).
[12] Baabou, W., Grunewald, N., Plamondon, C., Gresset, M., Galli, A. (2017). The ecological footprint of mediterranean cities: Awareness creation and policy implications. Environmental Science and Policy, 69: 94-104. https://doi.org/10.1016/j.envsci.2016.12.013
[13] Central Agency for Public Mobilization and Statistics, (2020), Yearly Statistical Report for the year 2019. https://capmas.gov.eg, accessed on Jan. 05, 2020.
[14] Bibliotheca Alexandrina, (2010). Alexandria City Development Strategy Moving from Vision to Strategy and Implementation, Documentation of the Process and Results 2004 – 2007. [Online]. Available at http://siteresources.worldbank.org/INTEGYPT/Resources/Documentation_Alexandria_CDS_June1_2007.pdf., accessed on Dec. 15, 2019.
[15] Ministry of Housing, Utilities and Urban Development, General Organization for Urban Planning, General Directorate of Environmental and Natural studies, (2010). The Environmental Perspective of Urban Development Strategy at the Republic level for the vision 2050 (Alexandria Region). https://www.asp.com/projects/proje ct/masterplan-alexandria-184/show/, accessed on Jan. 05, 2020.
[16] Lin, D., Hanscom, L., Murthy, A., Galli, A., Evans, M., Neill, E., Mancini, M.S., Martindill, J., Medouar, F.-Z., Huang, S., Wackernagel, M. (2018). Ecological Footprint Accounting for Countries: Updates and Results of the National Footprint Accounts, 2012-2018. Resources 2018 and MDPI, 7(3): 58. https://doi.org/10.3390/resources7030058
[17] Li, J.C., Zhang, X.Y., Chang, X.X., Gao, W. (2018). Revising yield and equivalence factors of ecological footprints based on land-use conversion. Sustainability, 10(11): 1-17. https://doi.org/10.3390/su10114107
[18] National Footprint Accounts (NFA) Annual reports, for the year of 2005 - 2017. Global Footprint Network. https://footprint.org, accessed on Dec. 31, 2019.
[19] FAOSTAT (The Statistics Division of the Food and Agriculture Organization of the United Nations), (2019). Statistical report for the year 2004 – 2019. http://www.fao.org/faostat/en/#compare, accessed on Dec. 10, 2019.
[20] Geng, Y., Zhang, L., Chen, X., Xue, B., Fujita, T., Dong, H. (2014). Urban ecological footprint analysis: a comparative study between Shenyang in China and Kawasaki in Japan. Journal of Cleaner Production, 75: 130-142. https://doi.org/10.1016/j.jclepro.2014.03.082
[21] National Footprint Accounts (NFA) Annual reports, (2011). Global Footprint Network. https://www.footprintnetwork.org/content/images/uploads/National_Footprint_Accounts_2011_Document.pdf, accessed on Dec. 31, 2019.
[22] Wackernagel, M., Monfreda, C., Moran, D., Wermer, P., Goldfinger, S., Deumling, D., Murray, M. (2005). National Footprint and bio-capacity accounts 2005: The underlying calculation method. https://footprintnetwork.org/download.phd?id=5, accessed on Jan. 14, 2020.
[23] Gao, C., Jiang, D., Wang, D., Yan, J. (2016). Calculation of ecological footprint based on modified method and quantitative analysis of its impact factors—A case study of Shanghai. Chinese Geographical Science, 16: 306-313. https://doi.org/10.1007/s11769-006-0306-9
[24] Ahmed, Z., Wang, Z. (2019). Investigating the impact of human capital on the ecological footprint in India: An empirical analysis. Environmental Science and Research Pollution, 26: 26782-26796. https://doi.org/10.1007/s11356-019-05911-7
[25] WWF Report. (2018). Living Planet Report 2018. https://d2ouvy59p0dg6k.cloudfront.net/downloads/lpr_living_planet_report_2018.pdf, accessed on Jan. 10, 2020.
[26] Zhao, M.Y., Cheng, C.T., Chau, K.W., Li, G. (2006). Multiple criteria data envelopment analysis for full ranking units associated to environment impact assessment. International Journal of Environment and Pollution, 28(3-4): 448-464. https://doi.org/10.1504/IJEP.2006.011222
[27] Borucke, M., Moore, D., Cranston, G., Gracey, K., Katsunori, I., Larson, J., Lazarus, E., Morales, J.C.M., Wackernagel, M., Galli, A. (2013). Accounting for demand and supply of the biosphere’s regenerative capacity: The National Footprint Accounts underlying methodology and framework. Ecological Indicators, 24: 518-533. https://doi.org/10.1016/j.ecolind.2012.08.005
[28] Cucek, I., Klemes, J., Kravanja, Z. (2012). A review of footprint analysis tools for monitoring impacts on sustainability. Journal of Cleaner Production, 34: 9-20. https://doi.org/10.1016/j.jclepro.2012.02.036
[29] Galli, A., Iha, K., Pires, S., Mancini, M., Alves, A., Zokai, G., Lin, D., Murthy, A., Wackernagel, M. (2019). Assessing the ecological footprint and bio-capacity of Portuguese cities: Critical results for environmental awareness and local management. Cities, 96: 102442. https://doi.org/10.1016/j.cities.2019.102442
[30] Knill, C., Tosun, J. (2008). Policy Making. In: Caramani, D. (Ed.), Comparative Politics. Oxford University Press, Oxford, UK, pp. 495-519.
[31] Lazarus, E., Zokai, G., Borucke, M., Panda, D., Iha, K., Morales, J.C., Wackernagel, M., Galli, A., Gupta, N. (2015). Working Guidebook to the National Footprint Accounts. 2015 Edition. Global Footprint Network: Oakland. https://www.footprintnetwork.org/content/images/article_uploads/NFA%202015%20Guidebook%207-14-14.pdf, accessed on Dec. 28, 2019.
[32] Henriques, A. (2017). Environment and Sustainability. https://fenix.tecnico.ulisboa.pt/downloadFile/1407993358857962/ELP%2010%20-%20Environment%20&%20Sustainability%2020171019.pdf, accessed Dec. 20, 2019.
[33] Galli, A., Kitzes, J., Niccolucci, V., Wackernagel, M., Wada, Y., Marchettini, N. (2017). Forthcoming. Assessing the global environmental consequences of economic growth of World’s countries through the Ecological Footprint: a focus on China and India. Ecological Indicators. Global Footprint Network. https://sustainabledevelopment.un.org/content/documents/5686humanitysgrowingecologicalfootprint.pdf, accessed on Dec. 31, 2019.