Xiaobo Sun![]() | Hongyan Gu* | Yuanfang Tian
| Hongyan Gu* | Yuanfang Tian
© 2023 IIETA. This article is published by IIETA and is licensed under the CC BY 4.0 license (http://creativecommons.org/licenses/by/4.0/).
OPEN ACCESS
Conducting research on urban building thermal comfort using traditional methods is time-consuming and labor-intensive, and obtaining high-quality data over a large area is difficult. Moreover, the accuracy of publicly available climate data and building parameter data may be insufficient, affecting the research results. When dealing with complex data, errors may arise, necessitating further validation and empirical research. ArcGIS is a geographic information system software used for processing and analyzing geographic data, while building parameters encompass factors such as building morphology, materials, and greening. By conducting research on improving urban building thermal comfort based on ArcGIS and building parameters, a basis for policy formulation and implementation can be provided, guiding urban planning and architectural design. This study investigates improvement measures for urban building thermal comfort based on ArcGIS and building parameters. The classification of sample data required for urban building thermal comfort research is provided, and by combining logistic regression with ArcGIS spatial statistics and spatial analysis, influencing factors of urban building thermal comfort are explored from different perspectives, enhancing the comprehensiveness and depth of the study. A human thermal comfort model within urban buildings is constructed, and the principles for constructing an adaptive thermal comfort model are presented. Experimental results validate the effectiveness of the proposed method.
ArcGIS, building parameters, urban buildings, thermal comfort improvement
As urbanization accelerates, urban population density and building density continue to rise, gradually revealing the urban heat island effect [1-5]. Thermal comfort significantly affects the quality of life and health status of urban residents [6-11]. Therefore, researching improvement measures for urban building thermal comfort and providing a scientific basis for urban planning and architectural design are of great importance for enhancing the quality of life of urban residents [12-18]. The method based on ArcGIS and building parameters can effectively evaluate and improve urban building thermal comfort. ArcGIS is a geographic information system software used for processing and analyzing geographic data, while building parameters encompass factors such as building morphology, materials, and greening [19-21]. By conducting research on improving urban building thermal comfort based on ArcGIS and building parameters, a basis for policy formulation and implementation can be provided, guiding urban planning and architectural design. The research results can promote the transformation of the construction industry towards green buildings and sustainable development, providing support for mitigating global climate change and environmental issues.
Global climate change has exacerbated the differences in indoor thermal environments and thermal adaptability of traditional residences, but quantitative research in this area still needs updating and improvement. Wang et al. [22] took new and old traditional residences in Guangfu Ancient City, Hebei Province, China, as an example, using subjective questionnaire surveys and objective data measurement methods to investigate residents' indoor thermal environment status and thermal comfort characteristics. The measured data show that the average indoor temperature of old traditional residences in winter is far below the human thermal comfort range, while in summer, it is higher than the relevant standards. Danks et al. [23] collaborates with urban practitioners to develop guidelines for defining simulation methods and acceptable standards to ensure robust and consistent assessments of the impact of new developments on overall outdoor thermal comfort. The development of these guidelines is introduced, including the evaluation of the appropriateness of different thermal comfort indices and climate data sources, the establishment of baseline condition urban thermal comfort simulations, and the definition of what is acceptable and what is not acceptable standards. Imran et al. [24] assessed the impact of land use and land cover (LULC) changes in Chittagong, Bangladesh, from 1993 to 2020 on summer and winter surface temperatures using remote sensing (RS) and geographic information systems (GIS). Furthermore, the study assesses the impact of summer LULC changes on HTC, as LST has a significant impact on HTC in summer. Kalogeropoulos et al. [25] aims to investigate the urban heat island effect by assessing outdoor thermal comfort conditions in medium-sized cities. More specifically, the current study's approach includes: (i) combining different monitoring techniques to quantify the urban heat island effect in Mediterranean medium-sized cities, applying in-situ measurements and remote sensing techniques to assess the urban heat island effect from both canopy (CUHI) and surface (SUHI) perspectives; (ii) identifying the parameters influencing thermal comfort, as well as determining the most suitable bioclimatic index for outdoor thermal comfort in the city of interest. In summer, questionnaire surveys and field measurements were conducted on sidewalks in Zante, Greece.
Urban building thermal comfort research methods mainly include field investigation and measurement, simulation and calculation, statistics and data mining. Field investigation and measurement methods are time-consuming and labor-intensive, and it is difficult to obtain high-quality data within a large range. At the same time, publicly accessible climate data and architectural parameter data may not be accurate enough, affecting research results. Although simulation methods can consider various factors, they still involve a certain degree of simplification and assumptions, which may lead to discrepancies between simulation results and actual situations. Statistical and data mining methods may have errors when dealing with complex data and require more verification and empirical research. Therefore, when conducting urban building thermal comfort research, these shortcomings should be considered. This article conducts research on urban building thermal comfort improvement measures based on ArcGIS and architectural parameters. Chapter 2 of the article provides the classification of sample data that needs to be collected in urban building thermal comfort research, combines logistic regression with ArcGIS spatial statistics and spatial analysis, and explores the influencing factors of urban building thermal comfort from different perspectives to improve the comprehensiveness and depth of the research. Chapter 3 constructs an urban building human thermal comfort model and provides the construction principle of the adaptive thermal comfort model. The experimental results verify the effectiveness of the proposed method.
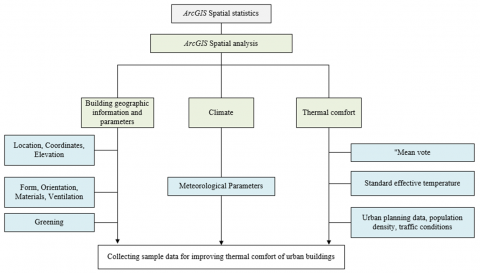
In the study of urban building thermal comfort distribution, thermal comfort can be divided into multiple categories (such as comfortable, uncomfortable, etc.) and associated with architectural parameters, climate data, and other factors. Through the logistic regression model, the contribution of each influencing factor to thermal comfort can be quantitatively evaluated, providing a basis for research. ArcGIS spatial statistical tools can be used to analyze the spatial distribution characteristics of urban building thermal comfort. By using kernel density estimation, spatial autocorrelation, and other spatial statistical methods, the spatial aggregation and dispersion rules of urban building thermal comfort can be revealed. Moreover, by conducting spatial regression analysis of thermal comfort and its influencing factors, the reasons for the differences in thermal comfort in different regions can be further explored. ArcGIS spatial analysis tools can be used to evaluate and optimize urban building thermal comfort improvement measures. Through buffer zone analysis, network analysis, and other methods, areas with lower thermal comfort in cities can be identified, providing reference for optimizing building layout, increasing green coverage, and other improvement measures. This article combines logistic regression theory, ArcGIS spatial statistical tools, and spatial analysis tools to carry out urban building thermal comfort-related research. By combining multiple analysis methods, the influencing factors of urban building thermal comfort can be explored from different perspectives, improving the comprehensiveness and depth of the research. Figure 1 shows the research framework of the article.
The types of sample data that need to be collected in the urban building thermal comfort research conducted in this article are shown in Figure 2, mainly including the following aspects:
(1) Building geographic information: basic geographic information such as the location, coordinates, and elevation of buildings, which is helpful for spatial analysis and visualization.
(2) Architectural parameters: including building morphology (such as building height, volume, surface area, etc.), building orientation, building materials (such as exterior wall materials, roof materials, etc.), window area and distribution, green coverage (such as green area, tree species and quantity, etc.), and other factors that may affect the building's thermal comfort.
(3) Climate data: meteorological parameters such as temperature, humidity, wind speed, and solar radiation, which have a direct impact on building thermal comfort.
(4) Thermal comfort indicators: indicators such as Predicted Mean Vote (PMV) and Standard Effective Temperature (SET) for evaluating thermal comfort within buildings.
Figure 1. Research framework
Figure 2. The types of sample data collected
(5) Human comfort perception data: the thermal comfort perception data of residents can be collected through questionnaires, field observation, etc., to more accurately evaluate thermal comfort.
(6) Auxiliary data: other related data that may affect thermal comfort, such as urban planning data, population density, traffic conditions, etc., which can help researchers more comprehensively analyze the influencing factors of urban building thermal comfort.
When conducting urban building thermal comfort research based on ArcGIS and architectural parameters, it is necessary to collect as much of the above data as possible and preprocess the data for subsequent analysis and model construction. At the same time, attention should be paid to data quality and accuracy to ensure the reliability of research results.
In the logistic regression analysis of urban building thermal comfort scenarios, the research problem can first be modeled as a binary classification problem, i.e., thermal comfort is classified as "comfortable" or "uncomfortable." The dependent variable is thermal comfort, the independent variables are the factors influencing thermal comfort, and the random error term represents the part of the model that cannot be explained.
(1) Dependent variable: Thermal comfort, set as a binary variable, e.g., 1 represents comfort, and 0 represents discomfort.
(2) Explanatory variables: Factors affecting thermal comfort, such as outdoor temperature, relative humidity, wind speed, solar radiation, building orientation, building materials, and green coverage.
(3) Random error term (E): Represents the unexplained part of the model, i.e., the difference between the actual observed value and the predicted value of the model.
To explore the relationship between explanatory variables (e.g., climate factors, building parameters, etc.) and the dependent variable (e.g., thermal comfort index), let the dependent variable be represented by T, explanatory variables by z1,z2,z3,...,zb, regression coefficients by β0,β1,β2,...,βb, and error by γu. This article constructs the following linear regression model:
$T={{\beta }_{0}}+{{\beta }_{1}}{{z}_{1}}+{{\beta }_{2}}{{z}_{2}}+\cdots +{{\beta }_{b}}{{z}_{b}}+{{\gamma }_{u}}$ (1)
The linear regression coefficient fitting method mainly minimizes the residual sum of squares to find the regression coefficients that make the sum of squared deviations between the actual observed values and the predicted values of the model the smallest. Specifically, a set of parameters needs to be found so that the sum of squared differences between the actual values and fitted values of all sample points is minimized. This method ensures that the overall deviation distance between the fitted values of the linear regression equation and the actual observed values is minimized, thereby achieving the purpose of prediction and analysis. The minimization of residual sum of squares is the deviation distance, as follows:
$\begin{align} & {{F}_{MIN}}=\sum\limits_{u=1}^{b}{\left( {{t}_{u}}-{{{\hat{t}}}_{u}} \right)_{MIN}^{2}} \\ & =\sum\limits_{u=1}^{b}{\left( {{t}_{u}}-\left( {{\beta }_{0}}+{{\beta }_{1}}{{z}_{1}}+{{\beta }_{2}}{{z}_{2}}+\cdots +{{\beta }_{b}}{{z}_{b}} \right) \right)_{MI}^{2}} \\ & =\sum\nolimits_{u=1}^{b}{\left( {{t}_{u}}-{{\beta }_{0}}-{{\beta }_{1}}{{z}_{1}}-{{\beta }_{2}}{{z}_{2}}-\cdots -{{\beta }_{b}}{{z}_{b}} \right)_{MI}^{2}} \\\end{align}$ (2)
By the principle of minimum extremum, taking the partial derivatives of FMIN with respect to β0,β1,β2,...,βb, and setting them to 0, we have:
$\left\{ \begin{align} & b{{\beta }_{0}}+{{\beta }_{1}}\sum\nolimits_{u=1}^{b}{{{z}_{1u}}}+{{\beta }_{2}}\sum\nolimits_{u=1}^{b}{{{z}_{2u}}}+\cdots +{{\beta }_{b}}\sum\nolimits_{u=1}^{b}{{{z}_{bu}}}=\sum\nolimits_{u=1}^{b}{{{t}_{u}}} \\ & {{\beta }_{0}}\sum\nolimits_{u=1}^{b}{{{z}_{1u}}}+{{\beta }_{1}}\sum\nolimits_{u=1}^{b}{z_{_{1u}}^{2}}+{{\beta }_{2}}\sum\nolimits_{u=1}^{b}{{{z}_{1u}}{{z}_{2u}}}+\cdots +{{\beta }_{b}}\sum\nolimits_{u=1}^{b}{{{z}_{1u}}{{z}_{bu}}}=\sum\nolimits_{u=1}^{b}{{{z}_{1u}}{{t}_{u}}} \\ & {{\beta }_{0}}\sum\nolimits_{u=1}^{b}{{{z}_{bu}}}+{{\beta }_{1}}\sum\nolimits_{u=1}^{b}{{{z}_{1u}}{{z}_{bu}}}+{{\beta }_{2}}\sum\nolimits_{u=1}^{b}{{{z}_{2u}}{{z}_{bu}}}+\cdots +{{\beta }_{b}}\sum\nolimits_{u=1}^{b}{z_{_{bu}}^{2}}=\sum\nolimits_{u=1}^{b}{{{z}_{bu}}{{t}_{u}}} \\\end{align} \right.$ (3)
β0,β1,β2,...,βbcan be obtained by solving the above (b+1)-element linear equation system.
In actual research, there may be nonlinear relationships between factors affecting thermal comfort. By log-linear transformation or logistic transformation, such nonlinear relationships can be captured to some extent, thereby improving the fitting effect and prediction accuracy of the model. Thus, in the context of urban building thermal comfort analysis, this article applies log-linear/logistic transformations to the basic regression model to generate a logistic regression model. The logistic regression model is naturally suitable for handling binary classification problems. The output is a probability value, representing the probability that a certain sample belongs to the "comfort" category, which can be directly used to represent classification probability. This probability interpretation has higher practical value in many applications, helping decision-makers understand the probability of thermal comfort in different building environments and implement targeted improvement measures.
The basic expression is as follows:
$O\left( {{t}_{u}}=1|{{z}_{u}} \right)=R\left( {T}/{z}\; \right)=\frac{rh\left( z \right)}{1+{{r}^{h\left( z \right)}}}$ (4)
Therefore,
$O\left( {{t}_{u}}=0|{{z}_{u}} \right)=1-R\left( {T}/{z}\; \right)=\frac{1}{1+{{e}^{h\left( z \right)}}}$ (5)
and,
$h\left( z \right)=\ln \left( \frac{R\left( {T}/{z}\; \right)}{1-R\left( {T}/{z}\; \right)} \right)={{\beta }_{0}}+{{\beta }_{1}}{{z}_{1}}+{{\beta }_{2}}{{z}_{2}}+\cdots +{{\beta }_{b}}z+{{\gamma }_{u}}$ (6)
Therefore, to explore the main influencing factors of urban building thermal comfort, the primary model evolves into:
$O($ thermal comfort zone $)=R(T / z)=\frac{e^{h(z)}}{1+e^{h(z)}}$ (7)
Assuming the logistic function is represented by O(tu=1|zu), the logistic transformation is represented by h(z), and correspondingly, we have:
$O($ thermal comfort zone $)=1-O($ non - thermal comfort zone $)=1-R(T / z)=\frac{1}{1+e^{h(z)}}$ (8)
On the other hand, the occurrence ratio of non-thermal comfort situations in urban buildings can be calculated using the following formula:
$\frac{R\left( {T}/{z}\; \right)}{1-R\left( {T}/{z}\; \right)}=\frac{{{o}_{u}}}{1-{{o}_{u}}}={{e}^{h\left( z \right)}}$ (9)
The logistic regression model is essentially a probability model. Using maximum likelihood estimation, the parameter values most likely to generate observed data can be found, providing advantages in model prediction and interpretation. Compared with other parameter estimation methods, maximum likelihood estimation provides more stable and reliable coefficient estimation, especially in cases with larger sample sizes. The basic form of the likelihood function is as follows:
$M\left( \varphi \right)=\prod\nolimits_{u=1}^{b}{o_{u}^{{{t}_{u}}}{{\left( 1-{{o}_{u}} \right)}^{1-{{t}_{u}}}}}$ (10)
Taking the logarithm gives the log-likelihood function:
$\begin{aligned} & \ln [M(\varphi)]=\ln \left[\prod_{u=1}^b o_u^{t_u}\left(1-o_u\right)^{1-t_u}\right] \\ & =\sum_{u=1}^b\left[t_u\left(\beta_0+\beta_1 z_1+\beta_2 z_2+\cdots+\beta_b z_b\right)-\ln \left(1+r^{\beta_0+\beta_1 z_1+\beta_2 z_2+\cdots+\beta_b z_b} \; \, \right)\right]\end{aligned}$ (11)
Taking the partial derivatives of M(ϕ) with respect to β0,β1,β2,...,βb, and setting them to 0, β0,β1,β2,...,βb can be solved.
To effectively evaluate the predictive performance of the model, guide model optimization, and enhance the credibility and acceptance of the study, this article selects the Hosmer-Lemeshow goodness-of-fit index as the indicator for evaluating the goodness-of-fit of the constructed logistic regression equation. The Hosmer-Lemeshow test is a group-based goodness-of-fit test method. By grouping the observed values according to the predicted probability and calculating the difference between actual observations and predictions within each group, the predictive performance of the model in different probability ranges can be intuitively evaluated. This helps to understand the potential flaws and shortcomings of the model when predicting thermal comfort. The statistical formula is similar to the Pearson X2(Pearson), assuming the sample data is divided into groups according to the predicted probability value, and the number of groups is represented by H (H≤10), the number of observed values in group h is represented by th, the number of samples in group h is represented by bh, the predicted probability value is represented by $\widehat{O}_h$, and the number of predicted events by bh$\widehat{O}_h$, it is expressed as follows:
$HL=\sum\nolimits_{E=1}^{H}{\frac{{{t}_{h}}-{{b}_{h}}{{{\hat{o}}}_{h}}}{{{b}_{h}}{{{\hat{o}}}_{h}}\left( 1-{{{\hat{o}}}_{h}} \right)}}$ (12)
In the context of urban building thermal comfort analysis, this article chooses to perform the Wald test on the constructed Logistic regression equation. By comparing the ratio of the regression coefficient estimates of each explanatory variable to their standard error (i.e., the Wald statistic), we can determine whether the explanatory variables have a significant impact on the dependent variable (thermal comfort). This helps to identify the factors with significant impacts on thermal comfort. At the same time, we can remove explanatory variables that do not have a significant impact on thermal comfort from the model to obtain a simpler and more easily interpretable model. This helps us to further understand the relationships between explanatory variables and their impact on thermal comfort. Through the Wald test, we can identify explanatory variables with significant impacts on thermal comfort, thereby deepening our understanding of the urban building thermal comfort analysis scenario. This helps to provide a solid basis for formulating corresponding policies and intervention measures. The expression for the Wald test is given as follows:
$Q={{\left( {{\hat{\alpha }}}/{A{{R}_{{{{\hat{\alpha }}}_{j}}}}}\; \right)}^{2}}$ (13)
The PMV (Predicted Mean Vote) model is a mathematical model used to assess human thermal comfort, which integrates various environmental factors (such as temperature, humidity, wind speed, and radiant temperature) and human characteristics (such as metabolic rate and clothing thermal resistance). This allows for a more accurate assessment of human thermal comfort in specific environments, providing strong support for the evaluation and improvement of urban building thermal comfort. The PMV model is based on heat balance theory, which assesses thermal comfort by balancing the heat generated and lost by the human body. Specifically, let L represent the human body's metabolism, Q represent the work done by the human body, L-Q represent the remaining heat of the human body, haj represent the skin, waj represent the respiratory tract, A represent the storage value of surplus or deficit heat, V represent convective heat exchange, E represent radiant heat exchange, RRL represent the total heat carried by water vapor, RSR represent latent heat dissipation, and VSR represent sensible heat dissipation. The PMV model calculates the human thermal comfort index through the following formulas:
$L-Q={{w}_{RL}}+{{w}_{SR}}+A=\left( V+E+{{R}_{RL}} \right)+\left( {{V}_{SR}}+{{R}_{SR}} \right)+A$ (14)
$L-Q={{w}_{RL}}+{{w}_{SR}}+A=\left( V+E+{{R}_{RL}} \right)+\left( {{V}_{SR}}+{{R}_{SR}} \right)$ (15)
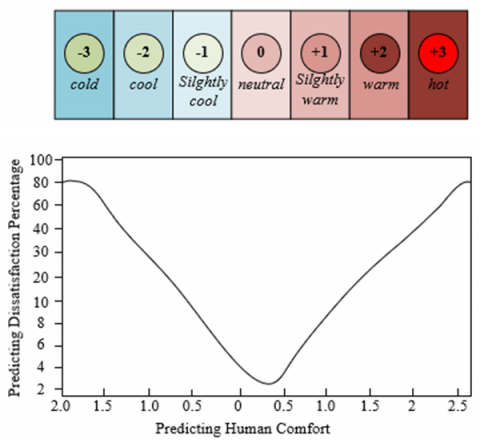
When the heat balance reaches a stable state, the human body feels comfortable. The range of PMV values is from -3 to +3, representing the human body's comfort evaluation of the environment. The closer the PMV value is to 0, the higher the thermal comfort. The further the PMV value deviates from 0, the lower the thermal comfort. Let γ represent the emissivity of the human body surface, $\delta$ represent the Stefan-Boltzmann constant; the correction factor for the effect of body posture on the effective surface area, yRT represent the human body surface temperature, and ye represent the mean radiant temperature, then:
$E=\gamma \times {{d}_{CL}}\times {{d}_{EF}}\times \delta \times \left( Y_{CL}^{4}-Y_{e}^{4} \right)$ (16)
Convective heat exchange V is represented as:
$V={{d}_{CL}}\times {{g}_{v}}\times \left( {{y}_{CL}}-ys \right)$ (17)
Skin evaporation heat dissipation RRL is represented as:
${{R}_{RL}}={{R}_{DI}}+{{R}_{HY}}$ (18)
Skin surface temperature YRL is represented as:
${{Y}_{RL}}=35.7-0.0275\times \left( L-Q \right)$ (19)
Sweat evaporation heat dissipation RHY is represented as:
${{R}_{HY}}=0.42\times \left( L-Q-58 \right)$ (20)
Sensible heat dissipation VSR can be calculated through the following formula:
${{V}_{SR}}=0.0014\times L\times \left( 34-ys \right)$ (21)
Latent heat dissipation RSR can be calculated through the following formula:
${{R}_{SR}}=0.0173\times L\times \left( 5.87-os \right)$ (22)
$\begin{align} & OLC=\left[ 0.303*\exp \left( -0.036*L \right)+0.028 \right]*\left( L-Q \right) \\ & -3.05*{{10}^{-3}}*\left[ 5733-6.99*\left( L-Q \right)-os \right] \\ & -0.42*\left[ \left( L-Q \right)-58.15 \right] \\ & -1.7*{{10}^{-5}}*L*\left( 5.867-os \right)-0.0014*L*\left( 34-{{y}_{s}} \right) \\ & -3.96*{{10}^{-8}}*{{d}_{CL}}*\left[ {{\left( {{y}_{CL}}+273 \right)}^{4}}{{\left( {{{\bar{y}}}_{e}}+273 \right)}^{4}} \right] \\ & -{{d}_{f}}*{{g}_{v}}*\left( {{y}_{CL}}-{{y}_{s}} \right) \\\end{align}$ (23)
When the human thermal comfort OLC equals 0, not everyone is in a satisfactory thermal comfort state. Figure 3 shows the percentage of dissatisfaction corresponding to the human thermal comfort situation. The calculation of the percentage of dissatisfaction with the thermal environment OOF can be performed through the following formula:
$OFF=100-95\exp \left[ -\left( 0.03353OL{{C}^{4}}+0.2179OL{{C}^{2}} \right) \right]$ (24)
Figure 3. Percentage of dissatisfaction corresponding to human thermal comfort situation
Individuals have different perceptions and adaptability to thermal comfort, which may be related to factors such as age, gender, and health status. Adaptive thermal comfort models can account for these individual differences and more accurately predict comfort responses. Moreover, people gradually adapt to the temperature and humidity conditions of a particular climate environment when exposed to it for a long time. Adaptive thermal comfort models consider this environmental adaptation process, thus providing more suitable comfort recommendations under different climate conditions. Building adaptive thermal comfort models is of great significance in urban building thermal comfort analysis scenarios, as the human body is stimulated by the hot and humid environment, causing physiological and psychological adaptive adjustments. Adaptive thermal comfort models can better explain and predict people's comfort responses under different environmental conditions, thus providing more effective references for architectural design and improvement.
Assume the adaptive coefficient is represented by η. The expression of the adaptive thermal comfort model SOLC is:
$SOLC=\frac{OLC}{\left( 1+\eta OLC \right)}$ (25)
Urban building thermal comfort is affected by various factors, including air temperature, relative humidity, mean radiant temperature, air speed, metabolism, clothing thermal resistance, and others. The following are the effects of these factors on thermal comfort: In addition to the above factors, urban building thermal comfort is also affected by the following factors mentioned in the collected sample data:
(1) Building structure and design: The structure and design of a building affect air circulation, heat transfer, and heat dissipation. For example, buildings with good daylighting and ventilation can improve thermal comfort, while compact, enclosed buildings may lead to a stuffy indoor environment.
(2) Building materials: The thermal conductivity of building materials affects indoor temperature distribution and thermal comfort. For example, materials with good insulation performance can reduce energy consumption, maintain stable indoor temperatures, and thus improve thermal comfort.
(3) Vegetation cover: Surrounding vegetation cover can provide shade, reduce outdoor temperatures, and thus affect the thermal comfort of buildings. Well-greened areas can lower indoor temperatures and improve thermal comfort during hot seasons.
(4) Urban heat island effect: The urban heat island effect refers to the generally higher temperatures in urban central areas compared to surrounding rural areas. The heat island effect can cause indoor temperatures to rise, thereby reducing building thermal comfort. Therefore, measures to reduce the heat island effect should be considered in urban planning and architectural design to improve thermal comfort.
By comprehensively considering these factors, a more comprehensive analysis of the influencing factors of urban building thermal comfort can be conducted, providing a strong basis for designing and improving urban buildings.
Assuming air temperature is represented by ys, wind speed by C, and indoor black globe temperature by yh, the conversion formula for mean radiant temperature is as follows:
${{y}_{MR}}=yh+2.4{{C}^{0.5}}\left( yh-ys \right)$ (26)
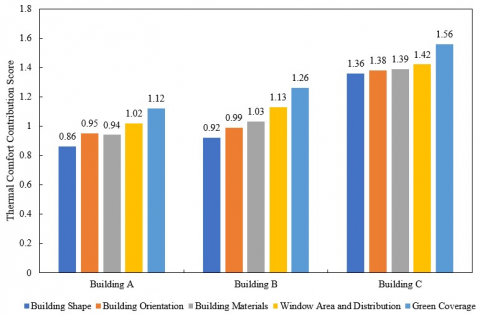
Figure 4. Contributions of different building parameters to building thermal comfort
This study selects three actual buildings A, B, and C for thermal environment and thermal comfort analysis. Table 1 shows the basic thermal environment conditions of different sample points in different buildings. Through analysis, it can be seen that the highest indoor temperature in building B is generally higher than that in buildings A and C, which may be related to building structure, design, materials, and other factors. The highest indoor temperatures of buildings A and C are relatively close, but building C has significantly higher indoor temperatures at samples 3 and 5. In terms of maximum comfort value, lower comfort values indicate better thermal comfort. Building A has relatively lower maximum comfort values in all samples, indicating better thermal comfort. Buildings B and C have higher maximum comfort values, especially in samples 1 and 2 of building C. In terms of comfort duration, building A generally has higher comfort duration, indicating that building A provides a comfortable living environment for people for more extended periods. Buildings B and C have lower comfort durations, especially in samples 4 and 5 of building B, which may require measures to improve thermal comfort. In terms of cooling load satisfying comfort, building A has relatively low cooling loads in samples 1, 4, and 5, indicating that building A has lower cooling requirements in these sample points. Buildings B and C have higher cooling loads, which may require more energy consumption to meet comfort needs.
Figure 4 shows the contributions of different building parameters to building thermal comfort. Based on the contribution of different building parameters to building thermal comfort in Figure 4, the following analysis can be made. First, in terms of building morphology, the value of building C is the highest, indicating that the morphology of building C has the most significant impact on its thermal comfort. In contrast, the values of buildings A and B are lower, indicating that the morphology of these two buildings has a relatively smaller impact on thermal comfort. Second, in terms of building orientation, building C also has the highest value, meaning that the orientation of building C has the greatest impact on its thermal comfort. Buildings A and B have relatively lower values, indicating that their orientation has a smaller impact on thermal comfort. For building materials, the value of building C is still the highest, indicating that building materials have the most significant impact on the thermal comfort of building C. Buildings A and B have slightly lower values, indicating that their building materials have a relatively smaller impact on thermal comfort. In terms of window area and distribution, building C has the highest value, indicating that window area and distribution have the most significant impact on the thermal comfort of building C. Buildings A and B have lower values, indicating that window area and distribution have a relatively smaller impact on the thermal comfort of these two buildings. Finally, in terms of green coverage, building C has the highest value, indicating that green coverage has the most significant impact on the thermal comfort of building C. Buildings A and B have relatively lower values, indicating that green coverage has a smaller impact on the thermal comfort of these two buildings. In summary, it can be concluded that the thermal comfort of building C is most affected by building parameters, which means that optimization of building C in practical applications will bring significant improvements to its thermal comfort. The thermal comfort of buildings A and B is relatively less affected by building parameters, but it can still be improved by adjusting the corresponding parameters.
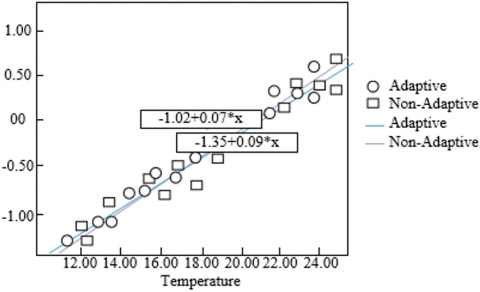
Figure 5 shows the regression analysis fitting curve of human comfort under different temperature conditions in winter for building kitchens and bedrooms. Based on the fitting curve, the following curve analysis can be performed. As the temperature increases, the human comfort in winter buildings gradually increases. This is because in winter, the outdoor temperature is lower, and the indoor temperature is further from the comfortable temperature. As the indoor temperature gradually increases, the heat loss of the human body decreases, thereby making the environment more comfortable. Therefore, in winter buildings, appropriately increasing the indoor temperature can improve human thermal comfort. However, it should be noted that excessively high indoor temperatures may lead to energy waste and excessive consumption, so it is essential to ensure reasonable temperature control while maintaining comfort.
1)
2)
Figure 5. Human comfort situation in building kitchen and bedroom in winter
1)
2)
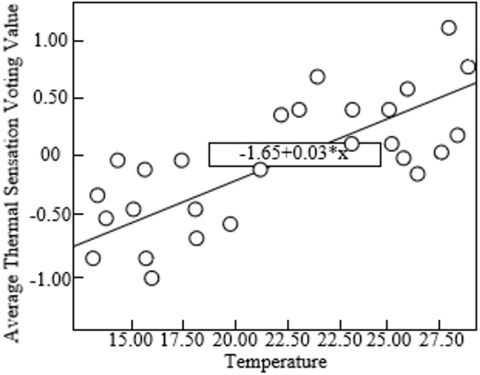
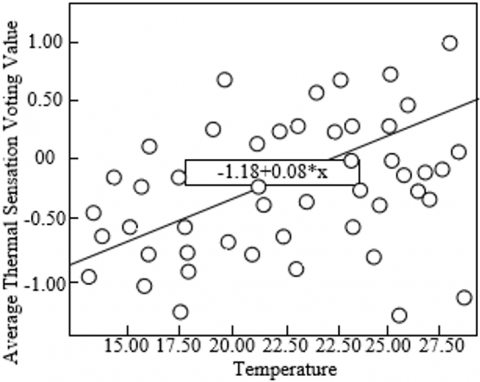
Figure 6. Winter building average thermal sensation voting situation
Figure 7. Temperature variation curves for different samples over time
Figure 6 shows the regression analysis fitting curve of the average thermal sensation vote value with temperature changes in winter buildings. Based on the regression analysis fitting curve, the following curve analysis can be performed. As the temperature increases, the average thermal sensation vote value in winter buildings gradually increases. This indicates that in winter, as the indoor temperature gradually increases, people feel more comfortable in the indoor thermal environment. In winter buildings, due to the low outdoor temperature, there is a significant difference between the indoor temperature and the comfortable temperature. As the indoor temperature increases, the human perception of thermal comfort gradually improves, leading to a rise in the average thermal sensation vote value. It should be noted that moderately increasing the indoor temperature can improve human thermal comfort, but excessively high indoor temperatures may lead to energy waste and excessive consumption. Therefore, while ensuring comfort, it is essential to pay attention to the reasonable control of indoor temperature to achieve both energy-saving and comfortable goals.
Figure 7 shows the temperature change values over time for different sample points. Based on the temperature change values over time for different sample points in Figure 7, the following analysis can be made. First, observe the temperature change of each sample point. At different time points, the temperature of each sample point shows a certain degree of fluctuation, which is consistent with the results predicted by the urban building thermal comfort analysis method based on ArcGIS and building parameters proposed earlier. This indicates that our method can effectively capture the temperature change characteristics of urban buildings. Second, we can find that at the same time point, there are certain differences in temperature among different sample points. This suggests that the thermal comfort of different buildings may be affected by building parameters, building structure, materials, and other factors, which are considered in our analysis method. Therefore, our method can effectively reflect the differences in thermal comfort between different buildings. Finally, from the overall trend, the temperature of each sample point changes regularly over time, providing a strong basis for further optimizing building design and adjusting the indoor environment. This also indicates that the urban building thermal comfort analysis method based on ArcGIS and building parameters proposed in this study has a certain validity. In conclusion, combined with the temperature change values over time for different sample points in above table and the previous Q&A, it can be concluded that the urban building thermal comfort analysis method based on ArcGIS and building parameters proposed in this study is effective in practical applications and can provide strong support for optimizing urban building thermal comfort.
According to the building thermal environment situation before and after the implementation of improvement measures in Table 2, the following analysis can be conducted. For Building A, the indoor maximum temperature slightly decreased after optimization, from 32.15°C to 31.62°C. The maximum comfort index also increased, from 2.41 to 2.61. Meanwhile, the comfortable duration increased from 23.6 to 26.9, and the cooling load satisfying the comfort requirements decreased from 15243.12 KWh/yr to 9142.50 KWh/yr. These data indicate that the optimization measures have a certain improvement effect on the thermal environment of Building A. For Building B, the indoor maximum temperature increased after optimization, from 30.26°C to 39.57°C. However, the maximum comfort index slightly decreased, from 2.03 to 1.95. The comfortable duration increased from 25.69% to 32.14%, and the cooling load satisfying the comfort requirements decreased from 16523.84 KWh/yr to 9163.48 KWh/yr. Although the indoor maximum temperature increased, the overall comfort duration and cooling load were improved, indicating that the optimization measures had a positive impact on the thermal environment of Building B. For Building C, the indoor maximum temperature significantly decreased after optimization, from 39.52°C to 31.41°C. The maximum comfort index decreased from 2.57 to 2.38. The comfortable duration remained basically unchanged, slightly increasing from 26.48% to 26.59%, and the cooling load satisfying the comfort requirements increased from 12659.41 KWh/yr to 16253.72 KWh/yr. Although the maximum comfort index decreased, the significant decrease in indoor maximum temperature indicates that the optimization measures have a significant improvement effect on the thermal environment of Building C. In summary, after implementing improvement measures in building structure and design, building materials, and vegetation coverage, the thermal environments of these three buildings have been improved. Buildings A and B achieved better results in terms of comfort index and cooling load, while Building C showed better improvement in reducing indoor maximum temperature. Therefore, it can be concluded that the improvement measures proposed in this study have a certain improvement effect on the thermal environment of these three buildings.
Table 1. Basic thermal environment conditions of different sample points in buildings
|
|
Building |
Sample 1 |
Sample 2 |
Sample 3 |
Sample 4 |
Sample 5 |
|
Maximum indoor temperature |
A |
36.25℃ |
34.29℃ |
34.15℃ |
30.14℃ |
36.52℃ |
|
B |
39.42℃ |
35.28℃ |
39.62℃ |
36.95℃ |
39.27℃ |
|
|
C |
33.52℃ |
30.61℃ |
38.41℃ |
31.42℃ |
38.15℃ |
|
|
Maximum comfort value |
A |
2.16 |
2.06 |
2.15 |
2.51 |
2.05 |
|
B |
2.84 |
2.19 |
2.49 |
2.03 |
2.69 |
|
|
C |
2.95 |
2.85 |
2.58 |
2.17 |
2.38 |
|
|
Comfort duration |
A |
24.15% |
25.61% |
20.63% |
26.59% |
25.37% |
|
B |
29.16% |
29.58% |
24.51% |
22.53% |
21.05% |
|
|
C |
28.47% |
27.43% |
28.16% |
21.24% |
26.18% |
|
|
Cooling load satisfying comfort (KWh/yr) |
A |
16253.15 |
13528.41 |
9152.34 |
9162.35 |
8152.63 |
|
B |
10925.59 |
16295.57 |
13524.15 |
9425.14 |
9142.27 |
|
|
C |
14251.62 |
10263.29 |
16392.48 |
16253.48 |
18254.36 |
Table 2. Basic thermal environment conditions of buildings before and after improvement measures implementation
|
|
Building |
Before Optimization |
After Optimization |
|
Indoor Maximum Temperature |
A |
32.15 |
31.62 |
|
B |
30.26 |
39.57 |
|
|
C |
39.52 |
31.41 |
|
|
Maximum Comfort Value |
A |
2.41 |
2.61 |
|
B |
2.03 |
1.95 |
|
|
C |
2.57 |
2.38 |
|
|
Comfort Duration |
A |
23.6 |
26.9 |
|
B |
25.69% |
32.14% |
|
|
C |
26.48% |
26.59% |
|
|
Cooling Load that Meets Comfort (KWh/yr) |
A |
15243.12 |
9142.50 |
|
B |
16523.84 |
9163.48 |
|
|
C |
12659.41 |
16253.72 |
This study conducted a study on urban building thermal comfort improvement measures based on ArcGIS and building parameters. The classification of sample data needed for urban building thermal comfort research was presented, combining logistic regression with ArcGIS spatial statistics and spatial analysis to explore the influencing factors of urban building thermal comfort from different perspectives, thus improving the comprehensiveness and depth of the research. An urban building human thermal comfort model was constructed, and the construction principle of the adaptive thermal comfort model was provided. The actual buildings A, B, and C were selected for thermal environment and thermal comfort analysis in combination with examples. The contribution of different building parameters to building thermal comfort was presented, and the regression analysis fitting curves of human comfort index with temperature changes and the average thermal sensation vote with temperature changes were provided. The temperature changes with time under different sample points were analyzed, and the analysis conclusions were drawn. The effectiveness of the urban building thermal comfort analysis method based on ArcGIS and building parameters proposed in this study was verified in practical applications, providing strong support for optimizing urban building thermal comfort. Finally, a comparative analysis of the building thermal environment before and after the implementation of improvement measures was conducted. It can be concluded that the improvement measures proposed in this study have a certain improvement effect on the thermal environment of these three buildings.
This paper was supported by Guiding Plan for Construction Science and Technology Research Projects in Hebei Province in 2022 from the department of Housing and Urban-Rural Development of Hebei Province in China; Establishment of Hebei Industrial Heritage Planning Comprehensive Database Based on Geographic Information System GIS and Preservation Planning Strategy and Management Based on Database (Grant No.: 2022-2108).
[1] Yang, Y., Wang, D., Dogan, T. (2022). How the urban microclimate and outdoor thermal comfort can affect intra-city mobility patterns: Evidence from New York City. In 2022 Annual Modeling and Simulation Conference (ANNSIM), 523-536. https://doi.org/10.23919/ANNSIM55834.2022.9859328
[2] Yan, H., Wu, F., Nan, X., Han, Q., Shao, F., Bao, Z. (2022). Influence of view factors on intra-urban air temperature and thermal comfort variability in a temperate city. Science of The Total Environment, 841: 156720. https://doi.org/10.1016/j.scitotenv.2022.156720
[3] Roshan, G., Oji, R., Fdez-Arróyabe, P. (2022). Future impact of cloudiness and wind changes on thermal comfort conditions in the city of Tabriz (Iran) in the frame of climate change. Sustainable Cities and Society, 77: 103575. https://doi.org/10.1016/j.scs.2021.103575
[4] Kajjoba, D., Kasedde, H., Olupot, P.W., wanyaga, J.D. (2022). Evaluation of thermal comfort and air quality of low-income housing in Kampala City, Uganda. Energy and Built Environment, 3(4): 508-524. https://doi.org/10.1016/j.enbenv.2021.05.007
[5] Moisa, M.B., Dejene, I.N., Roba, Z.R., Gemeda, D.O. (2022). Impact of urban land use and land cover change on urban heat island and urban thermal comfort level: a case study of Addis Ababa City, Ethiopia. Environmental Monitoring and Assessment, 194(10): 736. https://doi.org/10.1007/s10661-022-10414-z
[6] Cilek, M.U., Uslu, C. (2022). Modeling the relationship between the geometric characteristics of urban green spaces and thermal comfort: The case of Adana city. Sustainable Cities and Society, 79: 103748. https://doi.org/10.1016/j.scs.2022.103748
[7] Stepani, H.M.N., Emmanuel, R. (2022). How Much Green Is Really “Cool”? Target Setting for Thermal Comfort Enhancement in a Warm, Humid City (Jakarta, Indonesia). Atmosphere, 13(2): 184. https://doi.org/10.3390/atmos13020184
[8] Roshan, G., Sarli, R., Fitchett, J.M. (2022). Urban heat island and thermal comfort of Esfahan City (Iran) during COVID-19 lockdown. Journal of Cleaner Production, 352 131498. https://doi.org/10.1016/j.jclepro.2022.131498
[9] Su, Y., Zhao, Q., Zhou, N. (2022). Improvement strategies for thermal comfort of a city block based on PET Simulation-A case study of Dalian, a cold-region city in China. Energy and Buildings, 261: 111557. https://doi.org/10.1016/j.enbuild.2021.111557
[10] Arrar, F.H., Kaoula, D., Matallah, M.E., Abdessemed-Foufa, A., Taleghani, M., Attia, S. (2022). Quantification of outdoor thermal comfort levels under sea breeze in the historical city fabric: The case of algiers casbah. Atmosphere, 13(4): 575. https://doi.org/10.3390/atmos13040575
[11] Abdallah, A.S.H., Mahmoud, R.M.A. (2022). Urban morphology as an adaptation strategy to improve outdoor thermal comfort in urban residential community of new assiut city, Egypt. Sustainable Cities and Society, 78: 103648. https://doi.org/10.1016/j.scs.2021.103648
[12] Yilmaz, S., Irmak, M.A., Qaid, A. (2022). Assessing the effects of different urban landscapes and built environment patterns on thermal comfort and air pollution in Erzurum city, Turkey. Building and Environment, 219: 109210. https://doi.org/10.1016/j.buildenv.2022.109210
[13] Chkeir, A., Bouzidi, Y., El Akili, Z., Charafeddine, M., Kashmar, Z. (2022). The Effects of Orientation and Ceiling Height on the Thermal Comfort in the Traditional and Contemporary House in Byblos City Lebanon. In 2022 13th International Renewable Energy Congress (IREC), pp. 1-6. https://doi.org/10.1109/IREC56325.2022.10002118
[14] Nouadje, B.A.M., Kapen, P.T. (2022). Three-dimensional numerical simulation of indoor thermal comfort for sleeping environments: A case study of residential buildings in the city of Bandjoun, Cameroon. Solar Energy, 242: 56-69. https://doi.org/10.1016/j.solener.2022.07.012
[15] Przesmycka, N., Kwiatkowski, B., Kozak, M. (2022). The Thermal Comfort Problem in Public Space during the Climate Change Era Based on the Case Study of Selected Area in Lublin City in Poland. Energies, 15(18): 6504. https://doi.org/10.3390/en15186504
[16] Guo, J., Chen, Q., An, Z., Zhu, X. (2022). Research on intelligent energy-saving design strategy of building thermal comfort experience in western Sichuan based on Climate Consultant software-Take the unlimited bookstore of Santai Middle School in Mianyang city as an example. In 2022 2nd International Conference on Bioinformatics and Intelligent Computing, pp. 173-178. https://doi.org/10.1145/3523286.3524537
[17] Shamseldin, A., Alwetaishi, M., Alzaed, A. (2021). Visual comfort achievement in compliance with thermal comfort recommendations in educational buildings in Taif City, KSA. In 2021 International Conference of Women in Data Science at Taif University (WiDSTaif), pp. 1-6. https://doi.org/10.1109/WiDSTaif52235.2021.9430251
[18] Homod, R.Z., Almusaed, A., Almssad, A., Jaafar, M.K., Goodarzi, M., Sahari, K.S. (2021). Effect of different building envelope materials on thermal comfort and air-conditioning energy savings: A case study in Basra city, Iraq. Journal of Energy Storage, 34: 101975. https://doi.org/10.1016/j.est.2020.101975
[19] A’yun, Q., Yunardi, R.T., Rizqillah, S.A., Hidayati, U. N. (2021). Thermal comfort analysis of residential home in coastal city based on physiological equivalent temperature (PET) index and operative temperature zone. In IOP Conference Series: Earth and Environmental Science, 738(1): 012004. https://doi.org/10.1088/1755-1315/738/1/012004
[20] Meili, N., Acero, J.A., Peleg, N., Manoli, G., Burlando, P., Fatichi, S. (2021). Vegetation cover and plant-trait effects on outdoor thermal comfort in a tropical city. Building and environment, 195: 107733. https://doi.org/10.1016/j.buildenv.2021.107733
[21] Rusdayanti, N., Karuniasa, M., Nasrullah, N. (2021). Thermal comfort assessment over the past two decades in different landscape areas within Palembang City. In IOP Conference Series: Earth and Environmental Science, 724(1): 012010. https://doi.org/10.1088/1755-1315/724/1/012010
[22] Wang, Y., Dong, Q., Guo, H., Yin, L., Gao, W., Yao, W., Sun, L. (2023). Indoor thermal comfort evaluation of traditional dwellings in cold region of China: A case study in Guangfu Ancient City. Energy and Buildings, 288: 113028. https://doi.org/10.1016/j.enbuild.2023.113028
[23] Danks, R., Shilston, R., Ozkan, E., Jayyaratnam, K. (2022). Development of the city of london thermal comfort guidelines. Building Simulation Conference Proceedings, 1373-1380.
[24] Imran, H.M., Hossain, A., Shammas, M.I., Das, M.K., Islam, M.R., Rahman, K., Almazroui, M. (2022). Land surface temperature and human thermal comfort responses to land use dynamics in Chittagong city of Bangladesh. Geomatics, Natural Hazards and Risk, 13(1): 2283-2312. https://doi.org/10.1080/19475705.2022.2114384
[25] Kalogeropoulos, G., Dimoudi, A., Toumboulidis, P., Zoras, S. (2022). Urban heat island and thermal comfort assessment in a medium-sized mediterranean city. Atmosphere, 13(7): 1102. https://doi.org/10.3390/atmos13071102