Ammar M. Abdulateef![]()
© 2023 IIETA. This article is published by IIETA and is licensed under the CC BY 4.0 license (http://creativecommons.org/licenses/by/4.0/).
OPEN ACCESS
Steam condenser plays a vital role in the metabolism of a coal fired power plant used for generating the energy, which employed in various fields. The aim of this research is to determine the relationship between various parameters, such as heat transfer coefficient by convection (h), Condenser Pressure (CP), Cold Water Flow (CWF) rate and Cold Water Temperature (CWT) towards evaluating the thermal performance of steam condenser unit. Experimental work is employed by four series based on condensate mass flow rate (Gcond), included G = 75 t/h, G = 50 t/h, G = 63 t/h and G = 89 t/h, respectively. The effect of condenser back pressure on power output from the turbine (N) and CWToutlet, as well as the effect of exhaust steam temperature (Texh) on h are investigated. Logarithmic Mean Temperature Difference (LMTD) is the major non-invasive method used for simulating this work by general heat transfer equations. The results obtained present the main characteristics of input and output parameters in addition to compression of the effect of CWTinlet on CP and h, respectively. The heat load via effectiveness as a function of CWF rate have also been reported. Ultimately, the findings obtained from CWT, CWF rate, CP and h of steam condenser have been validated. The water steam condenser has a number of important implications for further future practice to enhance the thermal power cycle of a coal fired power plant.
steam condenser back pressure, turbine power output, cold water temperature, Cold Water Flow rate, convection heat transfer coefficient, logarithmic mean temperature difference
The steam condenser is a significant component in a power plant system, and plays a key role in heat exchanger rate and power generation by high-speed turbine blades [1]. These components, such as turbines, compressors, heat exchangers and pumps can be operated as steady flow, a long periods of time with non-stop before shutting down for maintenance. The condenser heat exchanger is generally used for condensing the water steam by circulating cooling water from a cooling tower to the outside (atmosphere or river, lake, etc.) to reject waste heat. Therefore, heat loss from the thermal power plant cycles is one of greatest challenges due mainly to heat rejection from steam condenser. Moreover, in the new global economy, thermal power plants have become a central issue for compensating the loss of generation through the grid stability.
Different theories and experiments exist in the literature regarding to parameters of condenser, such as Cooling Water Temperature (CWT) [2, 3], mass flow rate of cooling water [4] and steam pressure [5]. These studies have shown that the CWTinlet at condenser was varying. This is for daily and annual temperatures of the near water source. However, the changing in condensing steam pressure and Cold Water Flow (CWF) rate seen as a result to variations in the system load. The impacts of cooling water and steam are considered, particularly for design of condenser and operation. In addition, flow arrangement, tubes configuration and material modification are most common design aspects for enhancing the surface area of condenser [6, 7]. Sereda et al. [8] experimentally studied the heat transfer of freons (R22 and R407), where the condensing steam is inside a plain tube (17 mm diameter) with stratified phase flow at saturated temperature of 40℃. The mass velocity of the steam was between 6 to 57 kg/m2-s and the quality of vapor changed from 0.23 to 0.95. The results showed a good increased in thermal energy efficiency. Correction and effectiveness are currently the most popular methods for assessing condenser performance [9, 10]. Vera-García et al. [11] designed a special condenser heat exchanger consists of shell and tube to evaluate the outlet conditions by employing some equations that relate with the coefficient of heat transfer by convection. Qureshi and Zubair [12] investigated the thermal performance of two units: evaporative cooler and condenser. The findings showed that the decrease in effectiveness was 75% in steam condenser. On the other hand, the concept of heat exchanger efficiency has recently been defined by numerous studies demonstrating as the ratio of the actual to the optimum heat transfer rate [13, 14]. Therefore, it can be defined the condenser effectiveness as the temperature difference ratio or the function of the parameters: the overall h, heat transfer area (A), CWF rate and CWT. Cengel [9] and Holman [10] displayed a number of cross sectional studies suggest an association between h of water and steam. The evaluating was from criteria relations as function of the Reynolds and Prandtl numbers as an example.
The objective of this study is to explore and develop the relationship between the correlations for h, Condenser Pressure (CP), CWT and CWF rate towards evaluating the thermal performance of steam condenser, as well as the conditions for reliable operation of the turbine used in a coal fired power plant system. The experimental and simulation model are more practical ways of analyzing the characteristics of these parameters, which are presented for different operation conditions.
2.1 System description
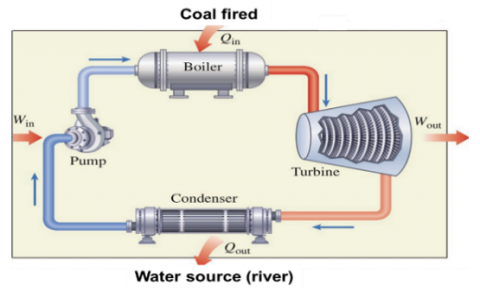
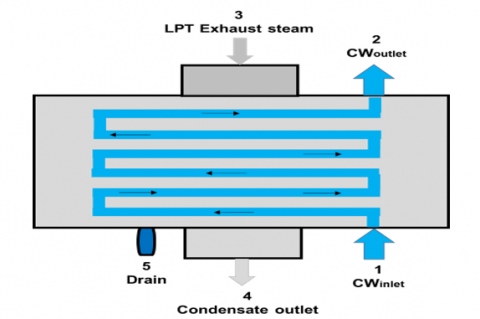
A coal fired power plant is shown in Figure 1a, is adopted in this study and consists of pump, boiler, turbine and condenser. A turbine unit consists of a big cylinder with 20 stages and it can be divided into: High Pressure Turbine (HPT) included three low-pressure heaters, Intermediate Pressure Turbine (IPT) and Low Pressure Turbine (LPT) included one high-pressure heater. The number of stages of the turbine unit was 10, 6 and 4 for HPT, IPT and LPT, respectively. The condenser is used for condensation of the exhaust steam, which is a major part of the overall system as shown in Figure 1b, and consists of two parts: shell and tube heat exchanger. The process for this system has shown that the cooling water flows through the tube as an open unit, while the exhaust steam flows through the shell from LPT. The condenser heat exchanger is equipped of 4290 number of welded 90/10 copper tubes wherever the thermal conductivity of copper used, is 387.6 W/m-K [15]. The tube surface has a highest heat transfer rate due to highest value copper thermal conductivity. In the condenser, the CP is maintained at 3.04 kPa with CWT of 15℃. Further, much of the design steam condenser to now has been descriptive in Table 1. On the other side and based on condensate mass flow rate (Gcond), there were four series of experiments, which investigated in a purely condensing mechanism as following: 1) with steam flow entering into the turbine (G = 75 t/h); 2) with steam flow entering into the turbine (G = 50 t/h); 3) with steam flow entering into the turbine (G = 63 t/h); and 4) with steam flow entering into the turbine (G = 89 t/h) and the change of cooling water rate. The back pressure in these first three series is increased by reducing the steam pressure inside the ejector. The circulation of water flow through the condenser is low in the last series. The exhaust steam temperature (Texh) was superheated of 68.4℃ when the steam left the turbine. The Texh was lower than saturation temperature (Tsat) for two experiments, the difference between them was approximately of 2℃. The CWF rate through the condenser unit was measured by an orifice flowmeter, while the CWT was measured by thermocouples. Ultimately, the sub-cooling temperature (Tsub) can be calculated by this formula: Tsub = Tsat -Tcond, where Tsat and Tcond are saturation and condensate temperatures, respectively.
Figure 1a. Schematic of a steam power plant
Figure 1b. Flow of cold water in the steam condenser
Table 1. Parameters of steam condenser heat exchanger
|
Parameters |
Values |
|
Cold water temperature (CWT) |
15℃ |
|
Cold water temperature (CWT) rise |
10℃ |
|
Condenser back pressure |
3.04 kPa |
|
Cold Water Flow (CWF) rate |
5000 $\mathrm{m}^3 / \mathrm{h}$ |
|
Number of pass |
2 |
|
Number of tubes |
4290 |
|
Tube diameter/thickness |
24/2 mm |
|
Tube/material |
90/10 copper |
|
Surface area |
1750 $\mathrm{m}^2$ |
|
Steam flow |
20.3 kg/s |
Logarithmic Mean Temperature Difference (LMTD) is the main non-invasive method used for analyzing the impacts of CP, CWT and CWF rate on heat transfer surface and steam condenser effectiveness by employing thermodynamics laws used for a coal fired power plant. Specifically, this was under the relation W net,out = Q in - Q out in kJ where this plant totally worked as closed system, see Figure 1a. This analysis is also included correlation of h and condenser heat exchanger effectiveness ($\varepsilon_{\mathrm{c}}$). Therefore, the general convection heat transfer equation is:
$\dot{Q}=\mathrm{hAdTM}$ (1)
where, $\dot{\mathrm{Q}}$ is a heat transfer rate in W; h is heat transfer coefficient by convection in W/ $m^2$-K; A is an area of surface through, which heat transfer by convection is occupied in $m^2$; and dTM is a mean temperature difference in ℃. Applying energy balance of first law of thermodynamics between heat transfer surface to the CWF rate through inlet and outlet points $\dot{\mathrm{Q}}_{1-2}$, and remove the heat from the hot water flow through inlet, outlet and drain points $\dot{Q}_{3-4-5}$, respectively as shown in Figure 1b. These can be expressed by [16]:
$\dot{\mathrm{Q}}_{1-2}=\dot{\mathrm{m}}_1\left(\mathrm{~h}_2-\mathrm{h}_1\right)=\dot{\mathrm{m}}_1 \mathrm{C}_{\mathrm{pw}}\left(\mathrm{T}_2-\mathrm{T}_1\right)$ (2)
$\begin{gathered}\dot{\mathrm{Q}}_{3-4-5}=\dot{\mathrm{m}}_3 \mathrm{~h}_3+\dot{\mathrm{m}}_5 \mathrm{~h}_5-\dot{\mathrm{m}}_4 \mathrm{~h}_4=\dot{\mathrm{m}}_3 \mathrm{C}_{\mathrm{pw}} \mathrm{T}_3+ \\ \dot{\mathrm{m}}_5 \mathrm{C}_{\mathrm{pw}} \mathrm{T}_5-\dot{\mathrm{m}}_4 \mathrm{C}_{\mathrm{pw}} \mathrm{T}_4\end{gathered}$ (3)
where, $\dot{\mathrm{m}}$ is a rate of mass flow in kg/s; h is an enthalpy in kJ/kg; T is a temperature in ℃; and $C_{\text {pw }}$ is a specific heat of water in (kJ/kg-K). All these through the points 1, 2, 3, 4 and 5 as shown in Figure 1b. The following relation can be considered for Eqns. (1), (2) and (3) as shown:
$\mathrm{hAdTM}=\dot{\mathrm{m}}_1 \mathrm{C}_{\mathrm{pw}}\left(\mathrm{T}_2-\mathrm{T}_1\right)$ (4)
However, there is no heat loss can be taken place during this process, therefore $\dot{Q}=\dot{Q}_{1-2}=\dot{Q}_{3-4-5}.$ For LMTD method and from Eq. (1) the dTM is derived as shown [17]:
$\mathrm{dTM}=\left(\mathrm{T}_2-\mathrm{T}_1\right) / \ln \left(\left(\mathrm{T}_{\mathrm{sat}}-\mathrm{T}_1\right) /\left(\mathrm{T}_{\mathrm{sat}}-\mathrm{T}_2\right)\right)$ (5)
Traditionally, velocity traversing method has been assessed by determining the CWF rate. The benefit of this approach is to measure an average velocity of cold water through the pipe, which has an effective diameter by:
$\dot{\mathrm{m}}_1=$ density $\times$ velocity $\times$ area (6)
where the density and velocity of water are considered through diameter of pipe. The validation was then assayed for measuring cold water using the ultrasonic flow meter and by applying energy balance method. For determining the condenser duty:
$\begin{gathered}\text { Cond_duty }=\left(\dot{Q}_{\mathrm{MS}}+\dot{Q}_{\text {SHSpray }}+\dot{Q}_{\mathrm{CRH}}+\right. \left.\dot{Q}_{\mathrm{RHSpray}}+\dot{Q}_{\mathrm{BFP}}\right)-860\left(\dot{Q}_{\text {gen }}+\dot{Q}_{\text {genloss }}+\dot{Q}_{\mathrm{rad}}\right)\end{gathered}$ (7)
where, $\dot{Q}_{\mathrm{MS}}$ is a main steam of heat added in $\mathrm{kW}$; $\dot{Q}_{\mathrm{SHSpray}}$ is a super heater spray of heat added in $\mathrm{kW}$; $\dot{Q}_{\mathrm{CRH}}$ is a cold reheat steam of heat added in $\mathrm{kW} ; \dot{Q}_{\mathrm{RHSpray}}$ is a reheat spray of heat added in $\mathrm{kW}$; $\dot{Q}_{\mathrm{BFP}}$ is a boiler feed pump of heat added in $\mathrm{kW}$; $\dot{Q}_{\text {gen }}$ is a gross generation in $\mathrm{kW} ; \dot{Q}_{\text {genloss }}$ is a generation loss in $\mathrm{kW}$; and $\dot{Q}_{\mathrm{rad}}$ is a radiation heat loss in $\mathrm{kW}$. The CWF rate is determined by measuring the $\mathrm{CWT}_{\text {inlet }}, \mathrm{CWT}_{\text {outlet }}$ and condenser duty as shown by:
CWF rate $=$ Cond $_{\text {duty }} / \mathrm{C}_{\mathrm{pw}}\left(\mathrm{CWT}_{\text {outlet }}-\mathrm{CWT}_{\text {inlet }}\right)$ (8)
On the other hand, to identify the effectiveness method, the following parameters were used as a function of surface area, CWF rate and h or as a temperature differences ratio [8, 18], as shown:
$\varepsilon_{\mathrm{c}}=\frac{\left(\mathrm{T}_2-\mathrm{T}_1\right)}{\left(\mathrm{T}_{\mathrm{sat}}-\mathrm{T}_1\right)}=1-\mathrm{e}^{-\frac{\mathrm{hA}}{\mathrm{\dot m}_1 \mathrm{C}_{\mathrm{pw}}}}$ (9)
4.1 Experimental results
As mentioned in this study, an experimental approach was adopted by four series based on Gcond. The basis for selecting this capacity was depended on the variety of steam mass flow rate entering to condenser from the turbine. However, the correlations for h, CP, CWT and CWF and the conditions for reliable operation of the turbine used in a coal fired power plant system.
4.1.1 Effect of CP on N
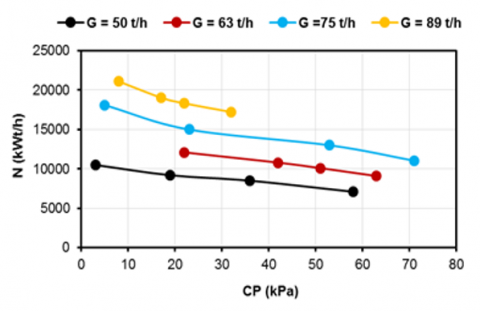
Figure 2 provides the experimental data on condenser back pressure (CP) in kPa with power output (N) from the turbine in kWt/h. It is apparent from the figure that the increase in CP leads to reduce the power output. This power is maximum at G = 89 t/h when the condenser back pressure is 32 kPa and decreases at G = 50 t/h, compared to other series. This is accordingly to minimum steam consumption during the turbine at the moment of CP of 58 kPa. The power output from the turbine is also decreased approximately to 10100 kWt/h at G = 75 t/h when the steam back pressure is increased to 70 kPa. The temperatures of steam in this experiment were around 62℃ to 65℃. On the other side, the ejector is continuous working steadily, the change in steam CP can be seen in every ejector stages. The operation of ejector was determined by some conditions, such as the lack of steam flow rate left from ejector and condenser back pressure readings in the test.
Figure 2. Effect of condenser back pressure (CP) on power output (N) from the turbine
4.1.2 Effect of CP on CWToutlet
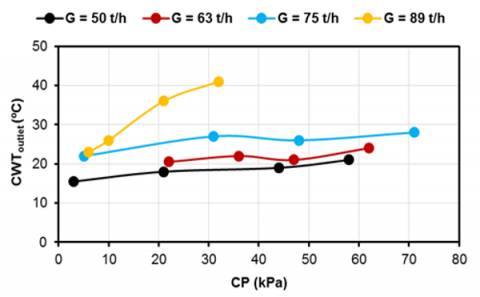
The results obtained from the totally analysis of CWToutlet on the steam CP are shown in Figure 3. The CWToutlet is dropped to 15℃ at G = 50 t/h and increased to 41℃ at G = 89 t/h. More result, the CWToutlet is approximately at 21℃ then starting to increase gradually to 29℃ at G = 75 t/h according to the change in condenser back pressure from 5 kPa to 72 kPa, respectively. This is because of decreasing in water flow rate that entering to the condenser and some disruption in the pump. On the other hand, the condenser is steadily operated at maximum heating water flow rate and minimum steam consumption. The turbine is operated at high steam flow rate of G = 90 t/h and heating water flow rate of 1500 m3/h to the condenser.
Figure 3. Effect of condenser back pressure (CP) on cooling water outlet temperature (CWToutlet)
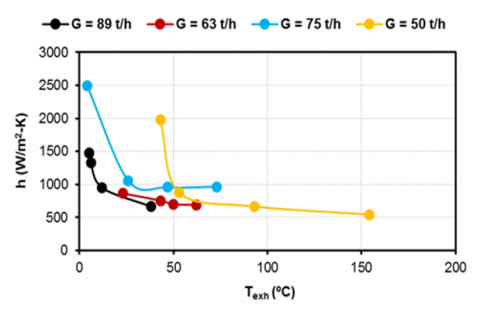
4.1.3 Effect of Texh on h
The breakdown of Texh effects on h through the condenser presented according to the findings in Figure 4. The most striking result to emerge from the data is that the h is reduced because of increasing the Texh. Therefore, the maximum value of h was approximately of 2499 W/m2-K then dropped to 1001 W/m2-K at G = 75 t/h due to changing in Texh from 4℃ to 76℃, respectively. The lower value of h was 503 W/m2-K when the steam temperature reached approximately to 154℃ at G = 50 t/h. The lower value of steam pressure in ejector leads to increase steam CP, the heat transfer deterioration and consequently, the h is reduced. This is caused by air entering to some spaces in the condenser. In this work, the vacuum pump in condensate steam turbine is used to reduce air value in steam. As a result, the value of 1% air in steam decreases the h around two times in the condenser. Further, an increase in h, lower air leakage and heat losses reduction can be effectively seen during operation condenser as a district water heater.
Figure 4. Effect of exhaust steam temperature (Texh) on convection heat transfer coefficient (h)
4.2 Simulation results
Characterizations of CWT and CWF rate are important for our increased understanding of steam condenser heat exchanger operation as a major part in power plant system. Shell and tube heat exchanger are combinations of the condenser, which used for condensation of the exhaust steam, see Figure 1b. The cooling water flows through the tube, while the exhaust steam flows through the shell from LPT. However, heat mass transfers to condenser and the latent heat removes from exhaust vapor affected on the steam CP and h in addition to the heat load, effectiveness and heat rate ratio in turbine operation as parameters considered in this study.
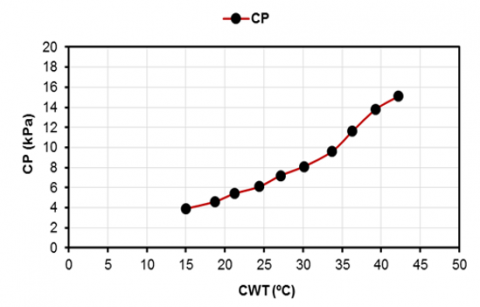
4.2.1 Effect of CWT on CP and h
Table 2 presents the results obtained from the simulation analysis of the model and illustrates the main characteristics of input and output parameters used for this study. Figure 5 compares the effect of results obtained from the analysis of CWT on steam CP and h. The observed increase in CWT, and decrease in heat flow rate could be attributed to increase in CP for entering the CWF rate. It is also seen that the relation between the CWT and steam CP is exponential, see Figure 5a. On the other side, the increase in h can be seen from 15℃ to 43℃ as a result to increase in CWT and the relation between them is found nonlinear, see Figure 5b. This is due to change in thermodynamics properties of water. More descriptions, the findings in Figure 5 (a and b) show that the relation of CWT with h and CP is established as $\mathrm{h}=-0.79 \mathrm{~T}_1^2+63.1 \mathrm{~T}_1+1684.32$ and $\mathrm{P}_{\text {cond }}=1.978 \mathrm{e}^{0.0491 \mathrm{~T}_1}$, respectively. There are, however, other possible explanations during condition of steady state where steam CP and h are gradually increased by the CWT. To maintain like this operation, the CWF rate should reach completely stream, depending on CWT and load provided.
Table 2. Input and output parameters of simulation study
|
Input |
Output |
|||
|
$\mathrm{m}_3$ (kg/s) |
$\operatorname{VF}_1\left(\mathrm{~m}^3 / \mathrm{h}\right)$ |
$\mathrm{T}_1\left({ }^{\circ} \mathrm{C}\right)$ |
$\mathrm{h}\left(\mathrm{W} / \mathrm{m}^2-\mathrm{K}\right)$ |
CP (kPa) |
|
127.56 |
25452 |
15 |
2448.54 |
4.13 |
|
127.56 |
25452 |
18 |
2571.32 |
4.79 |
|
127.56 |
25452 |
21 |
2672.833 |
5.56 |
|
127.56 |
25452 |
24 |
2755.73 |
6.46 |
|
127.56 |
25452 |
27 |
2822.32 |
7.51 |
|
127.56 |
25452 |
30 |
2874.64 |
8.72 |
|
127.56 |
25452 |
33 |
2914.45 |
10.10 |
|
127.56 |
25452 |
36 |
2943.32 |
11.68 |
|
127.56 |
25452 |
39 |
2962.59 |
13.49 |
|
127.56 |
25452 |
41 |
2971.15 |
14.83 |
|
102.04 |
27000 |
33 |
3001.78 |
8.65 |
|
89.29 |
27000 |
33 |
3001.78 |
8.11 |
|
76.53 |
27000 |
33 |
3001.78 |
7.60 |
|
63.78 |
27000 |
33 |
3001.78 |
7.11 |
|
51.02 |
27000 |
33 |
3001.78 |
6.65 |
|
127.56 |
40000 |
30 |
3603.74 |
7.16 |
(a)
(b)
Figure 5. Effect of cold water temperature (CWT) on (a) condenser pressure (CP) and (b) convection heat transfer coefficient (h)
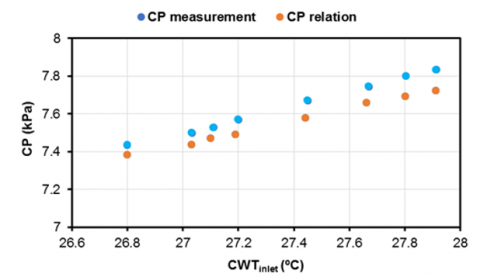
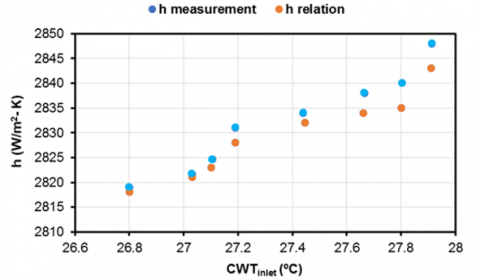
4.2.2 Comparison of measured parameters
Figure 6 presented a comparison of CWTinlet based on relation with CP and h. The steam CP and CWT inlet are derived the relation from Figure 5 and h has been calculated by Eq. (1) at CWF rate of 25500 m3/h. In this section, the error precision accurately for these results was less than 1%. The CWTinlet that effected on steam CP and h can be considered as variable parameter under like this operation conditions. These factors may explain the relatively good correlation between CP measurement, CP relation in side, h measurement and h relation in other side. This will help to provide the requirements of instrument calibration of power plant system to operate and to achieve the optimum steam CP.
(a)
(b)
Figure 6. Comparison of cold water inlet temperature (CWTinlet) based on relation for (a) condenser pressure (CP) and (b) convection heat transfer coefficient (h)
4.2.3 Effect of CWF rate on CP and h
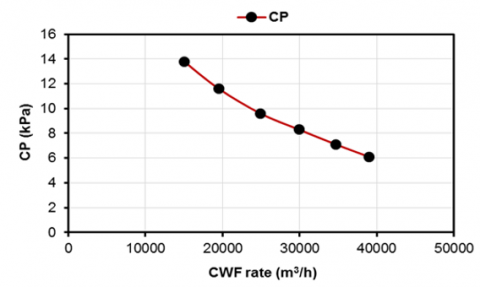
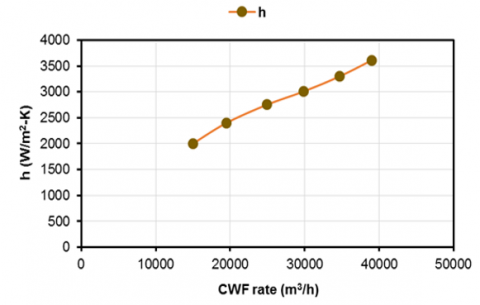
One interesting finding is that at fixed unit load of 211000 kW and CWT of 33.5℃, the variation in CP and h with CWF rate is shown in Figure 7. The increase in steam CP is maximum when the CWF rate changes from 15500 m3/h to 40000 m3/h. In addition, the change in steam CP is minimized at every increase of 5000 m3/h according to the relation that is derived from Table 3 as $\mathrm{P}_{\text {cond }}=0.000000011 \mathrm{VF}_1^2-0.00071 \mathrm{VF}_1+22.95$, see Figure 7a. On the other hand, there is no change in the CWF rate. When the CWT increases, condenser LMTD decreases and h increases. The increase in h was between 2000 W/m2-K to 3550 W/m2-K when the change in CWF rate was between 15500 m3/h to 40000 m3/h, see Figure 7b. This was the same change in CWF rate related with steam CP. Some of the issues that emerges from these findings are that the relationship between CP, CWF in side and h, CWF rate in other side is approximately linear as a result of effecting the CWT. Further, lower cold water velocity and higher the fouling potential that occur in tubes need more cleaning unit to enhance the thermal efficiency of steam CP. One more, clean cold water pipes causes greatest h when the CWT increases.
(a)
(b)
Figure 7. Effect of Cold Water Flow (CWF) rate on (a) condenser pressure (CP) and (b) convection heat transfer coefficient (h)
Table 3. Response of condenser with the variation of CWF rate at different CWT
|
$\mathbf{T}_{\mathbf{1}}$ (ºC) |
$V F_1\left(\mathrm{~m}^3 / \mathrm{h}\right)$ |
Q (kW) |
LMTD (ºC) |
U (m/s) |
h $\left(\mathbf{W} / \mathbf{m}^2-\mathbf{K}\right)$ |
CP (kPa) |
|
30 |
15000 |
290112.1 |
9.00 |
0.43 |
2206.83 |
12.25 |
|
30 |
30000 |
294485.8 |
6.46 |
0.87 |
3120.93 |
8.05 |
|
33 |
15000 |
288609.53 |
8.84 |
0.43 |
2237.40 |
14.07 |
|
33 |
40000 |
294121.13 |
5.51 |
1.16 |
3653.66 |
8.34 |
|
36 |
15000 |
287092.04 |
8.70 |
0.43 |
2259.56 |
16.14 |
|
36 |
35000 |
292068.87 |
5.80 |
1.01 |
3451.53 |
10.18 |
|
36 |
40000 |
292571.17 |
5.43 |
1.16 |
3689.84 |
9.70 |
4.2.4 Effect of steam CP on generation and cycle heat rate
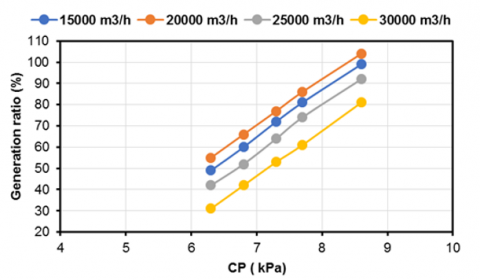
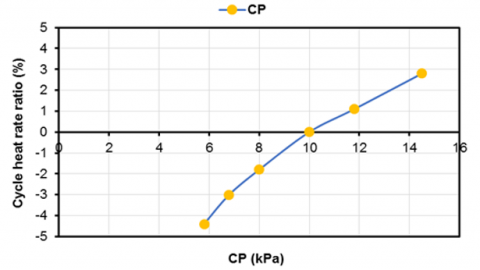
The results of the correlational analysis of steam CP, unit generation and CWF rate are set out in Figure 8a. The CWF rate is from 15000 m3/h to 30000 m3/h at a constant CWT of 33.5℃. However, steam CP improves by increasing in load demand and increasing in CWF rate. These findings may help us to ensure a good steam condenser in addition to decrease the pump load supplied. One more, maintaining the CP and CWF rate represent essentially requests under like these steady state operations. Surprisingly, some parameters were found that CP increased when the CWF rate decreased in case CWF rate of 15000 m3/h. Therefore, the performance of steam condenser is minimized due to higher CP. The results shown in Figure 8b, indicate that the effect of steam CP on cycle of heat rate in turbine with changing in CWT. The change of 1℃ in CWT leads to the increasing in steam CP by 14.1 kPa. This causes the increasing in heat rate by 0.3% in addition to generation of 33000 kW. The fuel consumption of power plant system will be approximately of 0.115 kg/s. Moreover, at the CWT and deposition in pipes of heat exchange, the heat transfer surface decreases and causes to increase the steam CP. To obtain a better heat transfer surface by convection in the condenser and to enhance the steady state operations, the CWF rate should be at maximum value. In addition, the heat load is at a maximum value in this process. After that, it is rejected from hot surface to cold surface, steam and water, respectively.
(a)
(b)
Figure 8. Effect of condenser pressure (CP) on (a) generation ratio and (b) cycle heat rate ratio
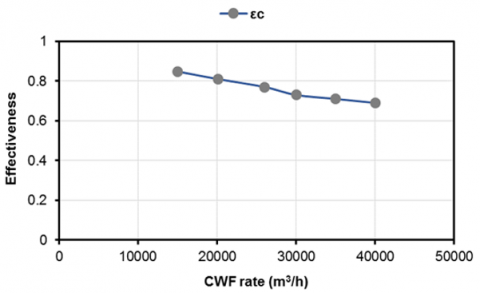
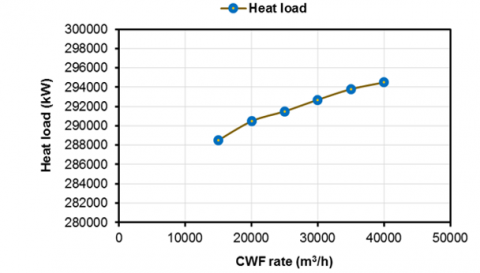
4.2.5 Function of CWF rate for effectiveness and heat load
Figure 9 displays heat load via effectiveness as a function of CWF rate. There is a clear trend of rising in CWF rate, which causes reduction in condenser effectiveness and increase in heat load because of dropping in the steam CP. These results confirm the association between CWT of 33.5℃ and rate of steam flow of 127.55 kg/s in addition to increasing CWF rate from 15500 m3/h to 41000 m3/h. It can also be seen that the maximum value of effectiveness factor of the condenser is 0.81, see Figure 9a and maximum value of heat load is 294100 kW, see Figure 9b. The minimum values was 0.69 and 288010 kW, respectively.
(a)
(b)
Figure 9. Function of Cold Water Flow (CWF) rate for (a) effectiveness $\left(\varepsilon_c\right)$ and (b) heat load
This research has gone most way towards enhancing the thermal performance of steam condenser heat exchanger, as well as the conditions for reliable operation of the turbine used in a coal fired power plant. An experimental approach was adopted by four series based on Gcond included G = 75 t/h, G = 50 t/h, G = 63 t/h and G = 89 t/h, respectively. The results confirmed that the N is increased at G = 89t/h when the condenser back pressure was 32 kPa and minimized at G = 50 t/h, compared to other series. The CWT outlet is approximately at 21℃ then increases gradually to 29℃ at G = 75 t/h according to the change in CP from 5 kPa to 72 kPa, respectively. One more, the h is reduced due to increase the Texh. On the other side, LMTD method is particularly useful in simulating this model and for its reliability and validity, the findings obtained by general heat transfer equations. It is a suitable form used for average temperature difference and analyzing the heat transfer inside heat exchangers, but taking the time is not short. The findings contributes to our understanding of increasing in CWT and decreasing in heat flow rate could be attributed to increase in steam CP for entering the CWF rate. The relation between the CWT and steam CP was exponential. The findings reported here shed new light on percentage change in steam CP that is at maximum value when the CWF rate changes from 15500 m3/h to 40000 m3/h. The change in CP is at minimum value with every increase of 5000 m3/h. It can also be seen the steam CP has been improved by increasing the load demand and CWF rate, respectively. Heat load via effectiveness were attended as a function of CWF rate. Clear trend of rising in CWF rate causes the reduction in condenser effectiveness. Further research could also be conducted to enhance the effectiveness of power cycle of a coal fired power plant.
The author gratefully appreciates the financial support provided by Bilad Alrafidain University College, Diyala, Iraq.
|
A |
area (m2) |
|
CP |
condenser pressure |
|
CWT |
cold water temperature |
|
CWF |
cold water flow rate |
|
$C_{\text {pw }}$ |
specific heat of water (kJ/kg-K) |
|
$C_{p h}$ |
specific enthalpy (kJ/kg) |
|
d |
diameter of pipe (mm) |
|
Gcond |
condensate mass flow rate (t/h) |
|
h |
heat transfer coefficient by convection (W/m2-K) |
|
LMTD |
logarithmic mean temperature difference |
|
$\dot{\mathrm{m}}$ |
mass flow rate (kg/s) |
|
p |
pressure (kPa) |
|
$\dot{\mathrm{Q}}$ |
rate of heat transfer (kW) |
|
$\dot{\mathrm{Q}}_{\mathrm{MS}}$ |
main steam of heat added (kW) |
|
$\dot{\mathrm{Q}}_{\mathrm{CRH}}$ |
cold reheat steam of heat added (kW) |
|
$\dot{\mathrm{Q}}_{\mathrm{SHspray}}$ |
super heater spray of heat added (kW) |
|
$\dot{\mathrm{Q}}_{\text {RHspray }}$ |
reheat spray of heat added (kW) |
|
$\dot{\mathrm{Q}}_{\mathrm{BFP}}$ |
boiler feed pump of heat added (kW) |
|
$\dot{\mathrm{Q}}_{\text {gen }}$ |
gross generation (kW) |
|
$\dot{\mathrm{Q}}_{\text {genloss }}$ |
generation loss (kW) |
|
$\dot{\mathrm{Q}}_{\mathrm{rad}}$ |
radiation heat loss (kW) |
|
T |
temperature (℃) |
|
Tcond |
condensate temperature (℃) |
|
Texh |
exhaust steam temperature (℃) |
|
Tsat |
saturation temperature (℃) |
|
Tsub |
Sub-cooling temperature (℃) |
|
N |
turbine power output kWt/h |
|
U |
water velocity (m/s) |
|
VF |
volume flow rate (m3/h) |
|
Greek letter |
|
|
$\varepsilon_{\mathrm{c}}$ |
effectiveness |
|
$\rho$ |
density of water (kg/m3) |
|
Subscript |
|
|
dTm |
mean temperature difference |
|
c |
condenser |
[1] Laskowski, R. (2016). Relations for steam power plant condenser performance in off-design conditions in the function of inlet parameters and those relevant in reference conditions. Applied Thermal Engineering, 103: 528-536. https://doi.org/10.1016/j.applthermaleng.2016.04.127
[2] Attia, S.I. (2015). The influence of condenser cooling water temperature on the thermal efficiency of a nuclear power plant. Annals of Nuclear Energy, 80: 371-378. https://doi.org/10.1016/j.anucene.2015.02.023
[3] Durmayaz, A., Sogut, O.S. (2006). Influence of cooling water temperature on the efficiency of a pressurized-water reactor nuclear-power plant. International Journal of Energy Research, 30(10): 799-810. https://doi.org/10.1002/er.1186
[4] Anozie, A.N., Odejobi, O.J. (2011). The search for optimum condenser cooling water flow rate in a thermal power plant. Applied Thermal Engineering, 31(17-18): 4083-4090. https://doi.org/10.1016/j.applthermaleng.2011.08.014
[5] Wang, W., Zeng, D., Liu, J., Niu, Y., Cui, C. (2014). Feasibility analysis of changing turbine load in power plants using continuous condenser pressure adjustment. Energy, 64: 533-540. https://doi.org/10.1016/j.energy.2013.11.001
[6] Kim, M.S., Lee, K.S., Song, S. (2008). Effects of pass arrangement and optimization of design parameters on the thermal performance of a multi-pass heat exchanger. International Journal of Heat and Fluid Flow, 29(1): 352-363. https://doi.org/10.1016/j.ijheatfluidflow.2007.05.010
[7] Chung, K., Lee, K.S., Kim, W.S. (2002). Optimization of the design factors for thermal performance of a parallel-flow heat exchanger. International Journal of Heat and Mass Transfer, 45(24): 4773-4780. https://doi.org/10.1016/S0017-9310(02)00195-3
[8] Sereda, V., Rifert, V., Gorin, V., Baraniuk, O., Barabash, P. (2021). Heat transfer during film condensation inside horizontal tubes in stratified phase flow. Heat and Mass Transfer, 57(2): 251-267. https://doi.org/10.1007/s00231-020-02946-2
[9] Cengel, Y.A. (2015). Heat Transfer, McGraw-Hill. https://www.mhhe.com/engcs/industrial/blank.
[10] Holman, J.P. (2002). Heat Transfer, McGraw-Hill, New York, 2002. https://www.mhhe.com/engcs/industrial/blank.
[11] Vera-García, F., García-Cascales, J.R., Gonzálvez-Maciá, J., Cabello, R., Llopis, R., Sanchez, D., Torrella, E. (2010). A simplified model for shell-and-tubes heat exchangers: Practical application. Applied Thermal Engineering, 30(10): 1231-1241. https://doi.org/10.1016/j.applthermaleng.2010.02.004
[12] Qureshi, B.A., Zubair, S.M. (2005). The impact of fouling on performance evaluation of evaporative coolers and condensers. International Journal of Energy Research, 29(14): 1313-1330. https://doi.org/10.1002/er.1120
[13] Cabezas-Gómez, L., Navarro, H.A., Sáiz-Jabardo, J.M., de Morais Hanriot, S., Maia, C.B. (2012). Analysis of a new cross flow heat exchanger flow arrangement–Extension to several rows. International Journal of Thermal Sciences, 55: 122-132. https://doi.org/10.1016/j.ijthermalsci.2012.01.001
[14] Fakheri, A. (2008). Efficiency and effectiveness of heat exchanger series. J. Heat Transfer, 130(8). https://doi.org/10.1115/1.2927404
[15] Abdulateef, A.M., Mat, S., Abdulateef, J., Sopian, K., Al-Abidi, A.A. (2018). Thermal performance enhancement of triplex tube latent thermal storage using fins-nano-phase change material technique. Heat Transfer Engineering, 39(12): 1067-1080. https://doi.org/10.1080/01457632.2017.1358488
[16] Linnhoff, B., Townsend, D.W., Boland, D., Hewitt, G.F., Thomas, B.E.A., Guy, A.R., Marsland, R.H. (1982). A User Guide on Process Integration for Efficienct Use of Energy, Warwick Printing Company Ltd, Warks. https://find-and-update.companyinformation.service.gov.uk/company/01995758.
[17] Sinnott, R. (2014). Chemical engineering design. Elsevier Butter- Worth Heinemann, Oxford, 2005.
[18] Anozie, A.N., Odejobi, O.J. (2011). The search for optimum condenser cooling water flow rate in a thermal power plant. Applied Thermal Engineering, 31(17-18): 4083-4090. https://doi.org/10.1016/j.applthermaleng.2011.08.014