Ravindra Kumar* | Sandip Chavan
© 2022 IIETA. This article is published by IIETA and is licensed under the CC BY 4.0 license (http://creativecommons.org/licenses/by/4.0/).
OPEN ACCESS
Fast charging and discharging are keen focus areas of electric vehicles (EVs) in order to reduce vehicle down time and support the variable load requirement. In EVs, mainly lithium batteries with various chemistry such as NCA (nickel cobalt aluminum oxides), LTO (lithium titanate oxide), LFP (lithium iron phosphate), LNO (lithium nickel oxide) and NMC (nickel manganese cobalt oxides) are used as energy storage system. Performance of lithium batteries varies with the chemistry and temperature of batteries along with surrounding conditions. More heat is generated during fast charging and discharging of batteries which lead to high temperature rise and further impact the performance, life and safety of batteries. Thus, it’s essential to study the thermal behaviour for fast charging and discharging of various lithium batteries to provide desired thermal management system for safety and better performance. In this paper, the thermal characteristics of various 18650 lithium batteries including NCA, NMC and LFP are investigated experimentally and numerically from slow charging and discharging loading rate of 0.5C to fast charging and discharging loading rates of 1.5C and 2.5C at different surrounding temperature of 27℃ and 45℃. In the numerical investigation, the internal resistance of the batteries is first measured experimentally at various SOCs and battery temperatures, and then the battery surface temperature is determined using an appropriate numerical method for solving the energy balance equation. From slow to fast loading rates at varying ambient temperatures, the numerical study approach presented in this work estimates the battery surface temperature with at least 90% accuracy for the whole duration of the load cycle. The thermal assessment of NCA, NMC, and LFP batteries in this work can help to determine battery management system operating strategies and, ultimately, to develop an appropriate thermal management system.
numerical investigation, experimental investigation, battery thermal management, electric vehicle and lithium battery
Interest in electric vehicles (EVs) have surged assuredly in few years because of stricter environmental rules on greenhouse gas emissions. To address the operational needs of electric vehicles, the electric vehicle market requires high specific power and energy density batteries as part of technological advancement [1, 2]. Currently, lithium-ion batteries such as NCA, LTO, NMC, LNO and LFP are mainly used in electric vehicles because of their high open circuit cell voltage and efficiency, high power and energy density, low self discharging rate, light weight and extended lifespan [3]. Range anxiety and long charge times compared to refueling gasoline vehicles are the main issues that hinder the widespread adoption of electric vehicles. Therefore, the fast charging has become an important function required in the battery and electric vehicle industry. High rate charging i.e. fast charging has shown accelerated degradation in battery capacity and power capabilities. Internal resistance, specific heat, entropic coefficient and state of charge (SOC) [4], must be studied in order to perform accurate estimations of different protection controlling parameters.
Lithium-ion batteries work effectively at temperatures ranging from 20°C to 50°C. Temperatures outside this range have a significant effect on thermal efficiency of battery, resulting in substantial performance and battery lifetime degradation. Every degree of battery temperature rise reduced the battery lifespan by 2 months [5]. Also, the variation in temperature of battery pack cannot exceed 5°C [6]. The battery's energy and power capacity were reduced when the temperature dropped, and its internal impedance increased [7]. Increased internal resistance causes a 60% loss in capacity at 20°C [8]. Thus, charging and discharging at subzero temperatures is a huge challenge. While high temperatures increase the reaction rate, which occurs most frequently during high current state activities such as rapid charging and discharging, resulting in higher power delivery and improved capacity, it also leads to increase in thermal load, and battery efficiency degradation [9]. Furthermore, high temperatures may induce lithium leakage, as well as the degrading of active substances, which can result in capacity loss. Emitted heat in the battery pack should be removed otherwise battery temperature may rise uncontrollably, resulting in material and component damage [10] or even battery thermal runaway [11]. The key obstacles are the heat created by the cell while charging and discharging, as well as its rise in battery cells. Unless the heat generated by the lithium-ion battery system or cell is effectively transported, it will build up, raising the temperature of each battery and the entire system. As a result, battery cell or battery pack failure may occur sooner. The rate of electrochemical reactions in various zones of a single cell varies due to non-uniform temperature distribution within the cell, causing partial energy utilization and lower battery lifespan [12]. Higher than 5°C variation in the temperature at different location of battery pack produces a 25% increase in thermal degradation and 10% power capacity reduction, according to research [13-15]. The capacity, voltage, and internal resistance of different batteries of a battery pack are varies [16]. Different thermal behavior occurs from these differences, ultimately results in temperature gradient throughout the battery pack [17]. A 5°C temperature difference in the battery pack can result in a 1.5-2% capacity loss [18], as well as a 10% reduction in power capabilities [19].
The thermal investigation of 18650 lithium batteries with various chemistry, such as NCA, NMC and LFP is the emphasis of this paper. Using experimental and numerical techniques, this thermal investigation is carried out from slow charging and discharging rate of 0.5C to fast rates of 1.5C and 2.5C at different surrounding temperature of 27°C and 45°C. The specifications of different chemistry batteries investigated in this research are list down in Table 1.
Table 1. Specification of 18650 Batteries
|
Chemistry |
NMC |
NCA |
LFP |
|
Material |
LiNiMnCoO2 |
LiNiCoA1O2 |
LiFePO4 |
|
Rated Capacity (Ah) |
3.5 |
2.9 |
1.55 |
|
Nominal Voltage (V) |
3.635 |
3.6 |
3.2 |
|
Mass of Battery (kg) |
0.049 |
0.0475 |
0.042 |
|
Specific Heat (J/kgK) |
997 |
859 |
1150 |
|
Entropy Coefficient (V/K) |
0.00009 |
0.00007 |
0.0000113 |
Battery generates heat during charging and discharging load cycle. Even more heat is generated during fast charging as compared to slow charging. A portion of the generated heat is released into the environment, while the remainder increase the battery temperature. As a result, battery temperature can be reduced by increasing the release of heat to environment and further it can be increased by reducing the release of heat to the environment. Thus, it is critical to precisely construct the equation of energy, which includes generated and transported heat along with adequate boundary conditions in order to anticipate the correct temperatures during charge and discharge load. The equation of energy for measuring the battery inside temperature can be stated in the following way using the energy conservation law:
$Q=\frac{d}{d x}\left(k x \frac{d T c}{d x}\right)+\frac{d}{d y}\left(k y \frac{d T c}{d v}\right)+\frac{d}{d z}\left(k z \frac{d T c}{d z}\right)+$$m \cdot C p \frac{d T c}{d t}$ (1)
In above Eq. (1) m, Cp, Tc and t are the mass, specific heat, battery temperature and time respectively and battery thermal conductivities is represented by kx, ky, and kz in different directions. In Eq. (1), right side include conduction of heat in x, y, z directions and energy stored in the battery and left side indicates heat generation as a result of charge or discharge loads.
There are mainly two basic source of heat generation. The first is irreversible heat, which is caused by internal resistance of battery, and other is reversible heat, which is caused by a change in entropy as a result of a chemical reaction. As a result, generated heat due to charge and discharge loads can be written as below:
$Q=I^2 R+I . T_c . E C$ (2)
where, R, I, and EC represents internal resistance, charge/discharge current and entropic coefficient respectively. Uniform temperature is considered in all directions within the battery to reduce computing work without affecting accuracy. The heat transferred to the battery's surface by conduction is dissipated to the environment via convection, as follows:
$\frac{d}{d x}\left(k x \frac{d T c}{d x}\right)+\frac{d}{d y}\left(k y \frac{d T c}{d y}\right)+\frac{d}{d z}\left(k z \frac{d T c}{d z}\right)=h \cdot A_s .\left(T_c-T_s\right)$ (3)
where, As, h and Ts represent battery surface area, heat transfer coefficient and environmental temperature respectively. After replacing, conduction term from Eq. (3) and generated heat term from Eq. (2) to Eq. (1), and then by rearranging the variables, Eq. (1) can be stated in form as given below:
$m \cdot C_{p .} \cdot\left(\frac{d T c}{d t}\right)=\left(I^2 R+h A_s T_s\right)+\left(I . E C-h A_s\right) \cdot T_c$ (4)
Different analytical and numerical method can be used to solve the Eq. (4). It is very important to measure the temperature in Eq. (4) with minimum error. In this paper for measuring the temperature at different charging and discharging cycles using Eq. (4), Euler’s formula is used [20, 21]. Eq. (4) can be written in following form,
$T_{\mathrm{c}}^{\prime}(t)=f\left(t, T_{\mathrm{c}}\right)$ (5)
where, $T_{\mathrm{c}}{ }^{\prime}(\mathrm{t})=\frac{d T c}{d t}$ and $f\left(t, T_c\right)=\left[(1 /(m C p)]\left[\left(I^2 R+h A_s T_s\right)+\right.\right.$ $\left.\left(I . E C-h A_s\right) \cdot T_c\right]$.
As per Euler’s Method, Solution of differential Eq. (5) is given by,
$T_c^{i+1}=T_c^i+\left(t^{i+1}-t^i\right) f\left(t^i, T_c{ }^i\right)$ (6)
where, i denotes the various instances of time and i = 0,1,2,3,4,......,t, t+1,......
After replacing the the value of f (t, Tc) in Eq. (6), the battery temperature can be written in equation form as shown below,
$T_c^{i+1}=T_c^i+\left(t^{i+1}-t_s^i\right) \cdot\left[\left(1 /(m C p)^i\right]\left[\left(I^2 R+h A_s T_s\right)^i+\right.\right.$$\left.\left(I \cdot E C-h A_s\right)^i \cdot T_c^i\right]$ (7)
In above Eq. (7), for measuring the temperature at any time (i+1), the different parameter values of previous time (i) is used. The next sections go over the parameters needed to calculate the battery surface temperature profile using Eq. (7).
2.1 Internal resistance (R)
When a load is applied to the battery, the internal resistance influences the quantity of energy that is burned as heat and the amount of voltage drop that happens. With a higher resistance, more energy is squandered and converted to heat. Lower resistance indicates a more efficient battery with less energy squandered. For delivering high current pulses, higher resistance batteries show poor performance. Internal battery resistance varies with battery temperature and state of charge (SOC) [22-24]. The SOC of battery can be determine as follows;
$\mathrm{SOC}(\mathrm{t}+1)=\mathrm{SOC}(\mathrm{t})+\frac{1}{C n} \int_t^{t+1} I(t) \cdot d t$ (8)
SOC(t +1) and SOC(t) in above Eq. (8) are SOC of battery at time t+1 and t respectively and, I (t) and Cn are current at time t and battery capacity. Internal resistance at different temperature and SOC for all batteries are measured experimentally during charge and discharge testing. The internal resistance of a battery reduces with an increase in temperature and SOC. This is due to the faster flow of ions at higher temperature and SOC.
2.2 Specific heat
Specific heat is a physical property of a material object. The specific heat capacity varies from one battery to other because of differences in materials, manufacturing processes, and internal structure. A high amount of heat is required to increase the temperature of the substance with high specific heat. It will give an indication of how much energy will be required to cool or heat an object of given mass by given amount. Furthermore, batteries have a complicated chemical composition, and the battery undergoes complex chemical reactions during charging, discharging, and ageing, resulting in a change in phase structure and on its electrodes. As a result, SOC, SOH, and temperature will alter the battery's specific heat capacity [25]. The specific heat values of the 18650 NCA, NMC, and LFP batteries are shown in Table 1.
2.3 Entropic coefficient
The thermal behaviour of a lithium battery is influenced by the reversible heat source, especially during the early charge and discharge states. The entropic coefficient (EC) is one factor that influences the magnitude and direction of reversible heat [26]. The entropic coefficient measures the reversible change in the OCV in response to a change in the battery's temperature [27]. The value of the entropic coefficient varies depending on the SOC level and temperature. Entropy change in the electrochemical reaction is an important thermodynamic component in battery thermal design and heat control. The reversible heat generation of the battery has been discovered to account for a large fraction of the total heat generation rate [28].
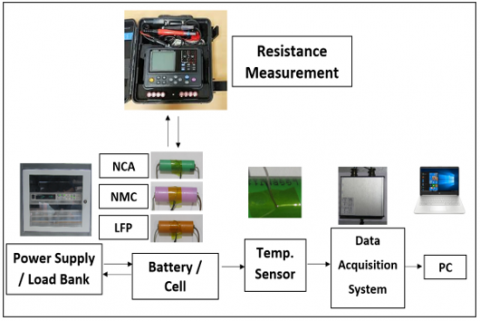
For investigating the thermal behavior for 18650 lithium battery with various chemistry, the surface temperatures were measure experimentally at different duty cycle from slow charge rate and slow discharge rate of 0.5C to fast charge rates and fast discharge rates of 1.5C and 2.5C at different surrounding temperature of 27°C and 45°C. A test set up used to measure the temperature include power supply and load bank, battery, thermal sensor, battery tester, data acquisition system (DAQ) and a PC for monitoring and recording. Charge and discharge load cycle was applied to a battery after connecting it to a power supply/load unit. Temperature sensor was affix at the lateral battery surface for measuring the battery surface temperature. To monitor and record the temperature of battery surface, the temperature sensor was linked to data acquisition system which was further connected to computer. Internal resistance was checked at different SOC by powering off the power supply and disconnecting the battery and then again powering on it. Temperature with each cycle varies and obtained as an output through this experiment. Figure 1 shows the test setup and electrical connection diagram for experimental measurement. Voltage and current parameters of the source and load are used for the application and control of charge and discharge duty cycles.
(a) Test Setup
(b) Electrical connection diagram
Figure 1. Test setup and electrical connection diagram for experimental measurement
4.1 Boundary conditions
The temperature of all batteries as mentioned in Table 1 was measured using both numerical and experimental method to investigating thermal behavior of NCA, NMC and LFP batteries and further validated the accuracy of numerical investigation method proposed in this paper. Both charge and discharge testing were carried out for slow (0.5C) and fast (1.5C, 2.5C) charging/discharging rate at a surrounding temperature of 27°C and further for 0.5C and 1.5C rate at higher surrounding temperature of 45°C. The charging load cycle include initially constant current charging until voltage hits its maximum limit, then constant voltage (CV) charging until current reaches to the limit of C/10. Discharging load cycle is similar to charging in that it involves discharge at constant current until it hits lower limit of voltage, then constant voltage discharge until the current is decreased to C/10 of capacity of battery.
4.2 Internal resistance measurement
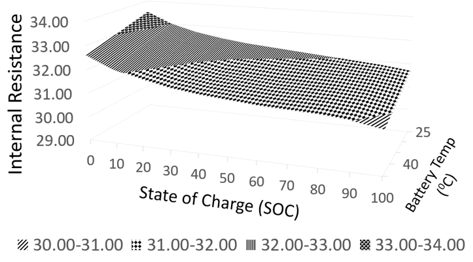
Figures 2, 3 and 4 show the surface plot of internal resistance with respect to SOC and temperature for 18650 NCA, NMC and LFP batteries respectively. By comparing all the images, it can be observed that internal resistance of all three chemistry batteries is reduced with increase in temperature and SOC. Resistance varies more with the variation in SOC as compared to temperature. Furthermore, it can be seen that resistance of NMC and LFP batteries varies more at less than 20% SOC and higher than 80% SOC, and almost constant in between 20% to 80% SOC but for NCA battery resistance varies more in between 20% to 80% SOC and almost constant below 20% and above 80% SOC. This varies internal resistance with respect to SOC and temperature was used in numerical investigation.
Figure 2. Internal resistance surface plot for NCA battery
Figure 3. Internal resistance surface plot for NMC battery
Figure 4. Internal resistance surface plot for LFP battery
4.3 Experimental temperature measurement
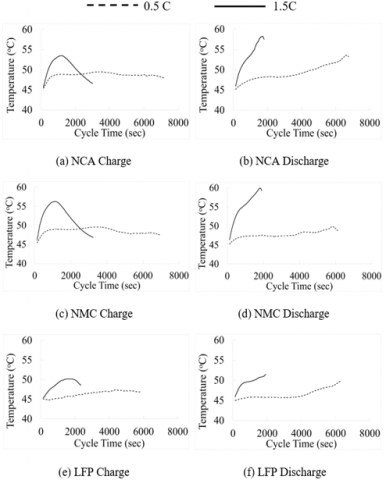
The surface temperatures for NCA, NMC and LFP batteries as specified in Table 1 are experimentally measured using test setup as shown in Figure 1. The temperature plots of all batteries for 0.5C, 1.5C and 2.5C rates at 27℃ and 0.5C and 1.5C at 45℃ surrounding temperature are shown in Figure 5 and Figure 6 respectively. By comparing all these temperature plot, it can be observed that the temperature profile of all chemistry batteries during charging is different from the temperature profile during discharging and the maximum temperature of NCA, NMC and LFP batteries at 27℃ surrounding is 45.3℃, 45.7℃ and 34.7℃ respectively at 2.5C charging rate and 59.8℃, 61.1℃ and 40.1℃ respectively at 2.5C discharge rate. It means for the same chemistry batteries, the maximum temperature during discharging is much more than the charging with same rate and it is valid for all charge and discharge rate and both surrounding temperature of 27℃ and 45℃. Furthermore, it is also observed that peak temperature at 27℃ surrounding for 0.5C, 1.5C and 2.5C discharge rates is 31.9℃, 47.8℃ and 59.8℃ respectively for NCA battery, 32.9℃, 47.9℃ and 61.1℃ respectively for NMC battery and 30.1℃, 34.3℃ and 40.1℃ respectively for LFP battery. According to Table 1, the LFP battery has a significantly lower rated capacity than the other two batteries, which results in a significantly lower temperature than that of the other two batteries. Hence as expected temperature distribution of all chemistry batteries at higher discharging rate is more than the temperature distribution at lower discharge rate and it is applicable to charging as well and for both the surrounding temperatures.
Figure 5. Experimental temperature plot at 27℃
Figure 7 shows the temperature rise as compared to initial conditions for all the batteries at 1.5C charge and discharge rates and for both surrounding condition of 27℃ and 45℃. By comparing all these images of temporaries rise, it is observed that the maximum temperature rises at 27℃ and 45℃ surrounding for 1.5C charging rate is 12.2℃ and 8.8℃ respectively for NCA battery, 12.8℃ and 11.6℃ respectively for NMC battery and 5.9℃ and 5.4℃ respectively for LFP battery. Hence even though as expected maximum battery temperatures for all chemistry batteries are higher at higher surrounding temperatures than at lower surrounding temperatures, but temperature rises are lower at higher surrounding temperatures than at lower surrounding temperatures, and this is true for all charge and discharge rates. As a result, the rate of temperature rise slows as the ambient temperature rises for a given duty cycle.
Figure 6. Experimental temperature plot at 45℃
Figure 7. Temperature rise comparison for 1.5C loads at 27℃ and 45℃
4.4 Validation of numerical investigation method
The proposed numerical investigation method in this paper is validated with the experimentally measured data for different charge/discharge rate at different surrounding conditions. The surface temperature of 18650 NCA, NMC and LFP batteries is numerically calculated using Eq. (5) for 0.5C, 1.5C and 2.5C charge/discharge rates at 27℃, and 0.5C and 1.5C rates at 45℃ as mentioned in boundary condition. Figure 8 and Figure 9 provide a comparison of temperature profiles of all chemistry batteries evaluated using numerical approach vs temperature obtained using experimental method for all specified charging and discharging rates in both environments. By comparing all these temperatures profile, it is observed that the temperature plot of numerical investigation is very close to the temperature plot of experimental investigation.
Figure 8. Numerical and experimental measured temperature comparisons at 27℃
Figure 9. Numerical and experimental measured temperature comparisons at 45℃
For all batteries, there is a strong correlation of the temperature profile between numerical and experimental methodologies for all charge and discharge rates at both ambient temperatures. For both lower and higher ambient temperatures, the maximum temperature deviation observed with NCA, NMC, and LFP batteries for the whole charge and discharge cycle is 9.7%, 9.9%, and 6.1 percent, respectively. As a result, the numerical method suggested in this study can forecast temperature with no less than 90.1 percent accuracy for 18650 NCA, NMC, and LFP batteries during the full charge and discharge cycle from slow to fast loading C-rate and diverse nearby temperatures.
4.5 Temperature Comparison Study for 18650 NCA, NMC and LFP batteries
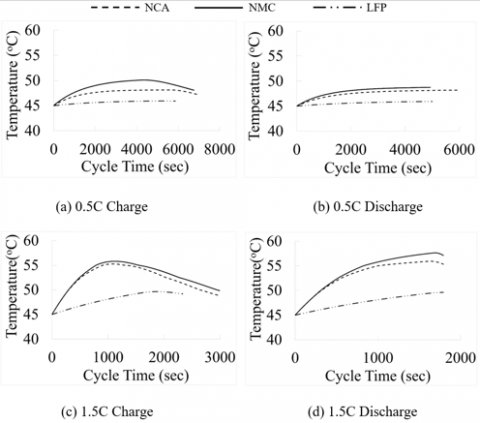
Figure 10. Temperature comparison plot for 18650 NCA, NMC and LFP Batteries at 27℃
Figure 11. Temperature comparison plot for 18650 NCA, NMC and LFP Batteries at 45℃
Figure 10 and Figure 11 show the temperature comparison plot for all chemistry batteries for 0.5C, 1.5C and 2.5C charging and discharging rate at 27℃ surrounding temperature and 0.5C and 1.5C rates at 45℃ surrounding temperature. Similar profile of temperature is observing for all the chemistry batteries separately in charging and also in discharging conditions. By comparing all these temperatures plots it’s observed that for all the charge/discharge rate, the LFP battery temperature is much lower compared to the temperature of NCA and NMC batteries during entire charging and discharging cycle. It is also observed that the temperature of NMC battery are slightly more than the temperatures of NCA battery. As shown in Table 1, the NMC battery has a marginally higher rated capacity than the NCA battery, which results in a marginally higher temperature for the NMC battery than the NCA battery.
Numerical and experimental investigations for thermal behavior were carried out for the 18650 NCA, NMC and LFP cylindrical Li-ion batteries. The surface temperature of all these batteries were measured for different charging and discharging rates of 0.5C, 1.5C and 2.5C at 27℃ surrounding temperature and 0.5C and 1.5C at 45℃ surrounding temperature. Further proposed numerical investigation method was validated with the experimentally measured surface temperature for all the batteries. In the numerical investigation, the internal resistance of the batteries is first measured experimentally at various SOCs and battery temperatures, and then the battery surface temperature is determined using an appropriate numerical method. Following conclusion can be made from current research,
The numerical investigation method presented in this paper can be used for measuring temperature of 18650 NCA, NMC and LFP batteries at any loading rate between 0.5C and 2.5C and surrounding temperature between 27℃ and 45℃. Thermal investigation of 18650 NCA, NMC and LFP batteries conducted in current research can be useful for selection for the battery management system strategies and also in designing and development of an optimal thermal management system.
The authors gratefully acknowledge the support provided by Automotive Research Association of India (ARAI) during the physical testing of lithium-ion batteries.
|
m |
mass, kg |
|
Cp |
specific heat, J. kg-1. K-1 |
|
Tc |
battery temperature, K |
|
t |
Time, sec |
|
k |
thermal conductivity, W.m-1. K-1 |
|
R |
internal resistance, ohm, Ω |
|
I |
charge/discharge current, A |
|
V |
Nominal Voltage, V |
|
EC |
entropic coefficient, V K-1 |
|
As |
surface area, m2 |
|
h |
heat transfer coefficient, W.m-2. K-1 |
|
Ts |
surrounding temperature, K |
|
Abbreviation |
|
|
EVs |
Electric vehicles |
|
NCA |
Nickel cobalt aluminum oxides |
|
NMC |
Nickel manganese cobalt oxides |
|
LFP |
Lithium iron phosphate |
|
LTO |
Lithium titanate oxide |
|
LNO |
Lithium nickel oxide |
|
SOC |
State of charge |
[1] Rao, Z., Wang, Q., Huang, C. (2016). Investigation of the thermal performance of phase change material/minichannel coupled battery thermal management system. Applied Energy, 164: 659-669. https://doi.org/10.1016/j.apenergy.2015.12.021
[2] Cheng, K.W.E., Divakar, B.P., Wu, H., Ding, K., Ho, H.F. (2011). Battery-management system (BMS) and SOC development for electrical vehicles. IEEE Transactions on Vehicular Technology, 60(1): 76-88. https://doi.org/10.1109/TVT.2010.2089647
[3] Ianniciello, L., Biwolé, P.H., Achard, P. (2018). Electric vehicles batteries thermal management systems employing phase change materials. Journal of Power Sources, 378: 383-403. https://doi.org/10.1016/j.jpowsour.2017.12.071
[4] Zou, C., Manzie, C., Nešic´, D., Kallapur, A.G. (2016). Multi-time-scale observer design for state-of-charge and state-of-health of a lithium-ion battery. Journal of Power Sources, 335: 121-130. https://doi.org/10.1016/j.jpowsour.2016.10.040
[5] Zhao, R., Gu, J., Liu, J. (2015). An experimental study of heat pipe thermal management system with wet cooling method for lithium ion batteries. Journal of Power Sources, 273: 1089-1097. https://doi.org/10.1016/j.jpowsour.2014.10.007
[6] Pesaran, A.A. (2002) Battery thermal models for hybrid vehicle simulations. Journal of Power Sources, 110: 377-382. https://doi.org/10.1016/S0378-7753(02)00200-8
[7] Jaguemont, J., Boulon, L., Dube, Y., Martel, F. (2016). Thermal Management of a Hybrid Electric Vehicle in Cold Weather. IEEE Transactions on Energy Conversion, 31(3): 1110-1120. https://doi.org/10.1109/TEC.2016.2553700
[8] Peng, X., Chen, S., Garg, A., Bao, N., Panda, B. (2019). A review of the estimation and heating methods for lithium-ion batteries pack at the cold environment. Energy Science & Engineering, 7: 645-662. https://doi.org/10.1002/ese3.279
[9] Jaguemont, J., Omar, N., Abdel-Monem, M., Van den Bossche, P., Van Mierlo, J. (2018). Fast-charging investigation on high-power and high-energy density pouch cells with 3D-thermal model development. Applied Thermal Engineering, 128: 1282-1296. https://doi.org/10.1016/j.applthermaleng.2017.09.068
[10] Jaguemont, J., Boulon, L., Dubé, Y. (2016). A comprehensive review of lithium-ion batteries used in hybrid and electric vehicles at cold temperatures. Applied Energy, 164: 99-114. https://doi.org/10.1016/j.apenergy.2015.11.034
[11] De Hoog, J., Jaguemont, J., Abdel-Monem, M., Van Den Bossche, P., Van Mierlo, J., Omar, N. (2018). Combining an electrothermal and impedance aging model to investigate thermal degradation caused by fast charging. Energies, 11(4): 804. https://doi.org/10.3390/en11040804
[12] Cai, H., Xu, C., Liao, Y., Su, L., Weng, Z. (2019). Mass maldistribution research of different internal flowing channels in the cooling plate applied to electric vehicle batteries. Applied Sciences, 9(4): 636. https://doi.org/10.3390/app9040636
[13] Han, X., Lu, L., Zheng, Y., Feng, X., Li, Z., Li, J., Ouyang, M. (2019). A review on the key issues of the lithiumion battery degradation among the whole life cycle. eTransportation, 1: 100005. https://doi.org/10.1016/j.etran.2019.100005
[14] Larsson, F., Mellander, B.-E. (2014). Abuse by external heating, overcharge and short circuiting of commercial lithium-ion battery cells. Journal of The Electrochemical Society, 161(10): A1611-A1617. https://doi.org/10.1149/2.0311410jes
[15] Feng, X., Zheng, S., Ren, D., et al. (2019). Investigating the thermal runaway mechanisms of lithium-ion batteries based on thermal analysis database. Applied Energy, 246: 53-64. https://doi.org/10.1016/j.apenergy.2019.04.009
[16] Lu, L., Han, X., Li, J., Hua, J., Ouyang, M. (2013). A review on the key issues for lithium-ion battery management in electric vehicles. Journal of Power Sources, 226: 272-288. https://doi.org/10.1016/j.jpowsour.2012.10.060
[17] Iraola, U., Aizpuru, I., Gorrotxategi, I., Segade, J.M.C., Larrazabal, A.E., Gil, I. (2015). Influence of voltage balancing on the temperature distribution of a li-ion battery module. IEEE Transactions on Energy Conversion, 30(2): 507-514. https://doi.org/10.1109/TEC.2014.2366375
[18] Feng, X., Xu, C., He, X., Wang, L., Zhang, G., Ouyang, M. (2018). Mechanisms for the evolution of cell variations within a LiNixCoyMnzO2/graphite lithium-ion battery pack caused by temperature non-uniformity. Journal of Cleaner Production, 205: 447-462. https://doi.org/10.1016/j.jclepro.2018.09.003
[19] Kuper, C., Hoh, M., Houchin-Miller, G., Fuhr, J. (2009). Thermal management of hybrid vehicle battery systems. In Proceedings of the 24th International Battery, Hybrid and Fuel Cell Electric Vehicle Conference and Exhibition (EVS-24), Stavanger, Norway, pp. 1-10
[20] Kumar, R., Chavan, P. (2021). Coupled electro-chemical and thermal modeling for cylindrical lithium-ion batteries, SAE Technical Paper 2021-26-0156. https://doi.org/10.4271/2021-26-0156
[21] Kumar, R., Chavan, S. (2022). Investigation of thermal behavior of cylindrical lithium-ion batteries for electric vehicle. ECS Transactions, 107(1): 8099–8112. https://doi.org/10.1149/10701.8099ecst
[22] Wang, J., Liu, S., Lin C., Wang F. (2018). Experimental study on the internal resistance and heat generation characteristics of lithium ion power battery with NCM/C material system. SAE International Journal of Passenger Cars - Electronic and Electrical Systems, 11(2): 131-138. https://doi.org/10.4271/07-11-02-0012
[23] Wang, D., Bao, Y., Shi J., (2017). Online lithium-ion battery internal resistance measurement application in state of charge estimation using the extended kalman filter. Energies, 10(9): 1284. https://doi.org/10.3390/en10091284
[24] Kim, J., Lee, S., Lee, J., Cho, B. (2007) A new direct internal resistance and state of charge relationship for the li-ion battery pulse power estimation. 7th Internatonal Conference on Power Electronics, https://doi.org/10.1109/ICPE.2007.4692563
[25] Lei, B., Zhao, W., Ziebert, C., Uhlmann, N. (2017). Experimental analysis of thermal runaway in 18650 cylindrical Li-ion cells using an accelerating rate calorimeter. Batteries, 3(2): 14. https://doi.org/10.3390/batteries3020014
[26] Bazinski, S. J., Wang, X. (2014). The influence of cell temperature on the entropic coefficient of a lithium iron phosphate (LFP) pouch cell. Journal of Electrochemical Society, 161(1): A168-A175. https://doi.org/10.1149/2.082401jes
[27] Lempert, J., Kollmeyer, P., Malysz, P., Gross, O. (2020). Battery entropic heating coefficient testing and use in cell-level loss modeling for extreme fast charging. SAE International Journal of Advances and Current Practices in Mobility, 2(5): 2712-2720. https://doi.org/10.4271/2020-01-0862
[28] Lu, W., Belharouak, I., Vissers, D., Amine, K. (2006). In Situ thermal study of Li1+x[Ni1/3Co1/3Mn1/3]1-xO2 using isothermal micro-clorimetric techniques. Journal of Electrochemical Society, 153(11): A2147-A2151. https://doi.org/10.1149/1.2349287