Hasan S. Majdi | Monaem Elmnifi | Atheer R. Abdullah | Abdalla S. Eltawati | Laith J. Habeeb*
© 2022 IIETA. This article is published by IIETA and is licensed under the CC BY 4.0 license (http://creativecommons.org/licenses/by/4.0/).
OPEN ACCESS
A double-sided solar cell (a bifacial photovoltaic (PV) cell arrangement) consisting of two back-to-back silicon photovoltaic cells is examined in this paper, and compared with a Monofacial cell. It was installed on a two-axis solar tracker. Temperature and radiation were monitored on sunny noonday in El-Marg city, Libya. The purpose of this investigation is to demonstrate the generation and matching of bifacial solar cells made by back-stacking two monoclinic solar cells. The face in the front accepts direct solar radiation, while the face in the back accepts indirect solar radiation that is reproduced from the ground, clouds, and surrounding buildings. The chief focus is on determining how ambient temperature affects the performance of bifacial photovoltaic panels. On two hot summer days in Al-Marg city, important photovoltaic parameters of the binary system (short-circuit photocurrent density, open circuit photovoltaic voltage, maximum power conversion efficiency) was verified. The PV performance of each individual cell shows remarkable variability with the movement of the tracer to the effect of radiation and the surface temperature of each cell. The results showed that the back cell performs better than the front cell. Although the back cell was exposed to fewer illuminations, it provided the front with higher power conversion efficiency than the front cell.
bifacial, dual-axis solar trackers, design optimization, front cell, Monofacial, solar energy, PV, ray tracing
For the time being to achieve a CO2-free energy system, the multiple challenges related to the development of renewable energy and its technologies face the transition towards clean energy. Since 1983, the Swedish Meteorological and Hydrological Institute, SMHI, has been collecting global irradiation data. From then until 2006, global solar radiation saw an overall increase of 8% and weather during 2018 brought a new peak [1, 2]. Increased global insolation with rising greenhouse gases in the atmosphere has increased the demand to switch to renewable energy sources. Therefore, it is necessary to find suitable technologies designed to solve and, at the same time, take advantage of the increasing global insolation. One technology that has recently grown remarkably is photovoltaic (PV). Solar cell research and development have resulted in a broad range of topologies, including cells of organic solar and heterojunction solar [3, 4].
However, single-crystal silicon solar cell technology is the most well-established, accounting for over 90% of all PV shipments. Despite the fact that it has been 64 years meanwhile the presentation of the major silicon solar cell [5] significant research on this technology is currently ongoing. The output power per unit area of a p-n junction silicon solar cell is limited via the thermodynamic limit (also known as the Shockley limit). The conjunction silicon cell is essentially limited to maximum efficiency of 33% [6]. Unabsorbed photons with energies a lesser amount than the loss of silicon phonon and/or bandgap owing to absorption of photon with energies greater than the silicon bandgap determine this limit. A finite area constrains the PV station in various situations. As a result, an alternate solar cell of silicon arrangement should be necessary to enhance production power per unit area. Using of the backdrop light diffused from the ground (albedo) to illuminate the backside of panel. The top surface of ordinary silicon solar cells is the sole site where sunlight is received and turned into power. The backside is usually covered in an opaque coating of metal contact that does not allow light to pass through. The backside is usually covered with an ambiguous coating of metal connection that doesn’t allow light to pass through. In place of a blanket of metal layer, a metallic grid is put onto the rear of the cell to capture the albedo. To produce a back-surface field, the backside is either over doped (p++) or drugged with a donor contamination to make a junction of p-n form. This arrangement permits ambient light to pass through the backside of cell and be turned into energy. The increased electrical power output is due to the more light absorbed via the backside of the cell. A bifacial solar cell is a name for this design. By the end of 1979, the bifacial solar cell had been patented [7]. Even yet, there is a paucity of literature on this solar cell architecture [8-11]. Both sides can use this sort of cell. The semiconductor substrate is silicon solar cells can be either n or p kind. We possess a polycrystalline solar panel with two separate solar panels joined back-to-back to increase irradiance of albedo and output power per unit area. The argument over power management in light of renewable energy sources, technology, and efficiency is a current subject. Continuous advances in PV technology are required in order to effectively exploit the resources of insolation in today's PV systems. Adapting PV system technology to diverse weather and climatic conditions throughout the world is one way to handle the resource more efficiently. The bifacial module is a relatively recent concept in PV technology. Bifacial PV panels have the advantage of receiving energy from both sides of the panel, as opposed to monofacial panels, which only collect energy from one side. As a result, if the PV modules have a high tilt angle or a high albedo, these may be particularly well suited. At this time, nothing is known regarding the potential benefits of bifacial cells at higher latitudes. In Libya, for example, the most raised issues relate to the installation, profitability, taxation and risk assessment of conventional single-sided PV systems [12]. As a result, understanding and diffusion of bifacial photovoltaic technology is critical. The influence of hot and harsh weather on photovoltaic cell deployment is a challenge, especially in the climate of the country's south. This mostly relates to the temperature as well as the amount of dust and sand on the PV panel frame's bottom edge. As a result, the PV panel's surface is partially covered during several months of the year, reducing power output [13]. There has been little previous research on PV systems in the southern environment, and there is a lack of studies that compare bifacial and frameless PV systems to traditional framed PV systems in the Libyan climate. The absence of prior research in this subject, together with the rising interest in and need for solar technology, makes it worthwhile to look into the possible benefits of bifacial photovoltaic panels in the country's south. As a result, the intriguing question is how much will the power output of bifacial solar panels rise. Rooftop solar cells are subject to a broad temperature range for operating (usually between 0 & 70℃). As a result, it is of great interest to examine the ambient temperature effect on the parameters of bidirectional solar panels. The purpose of this investigation is to demonstrate the generation and matching of bifacial solar cells made by back-stacking two monoclinic solar cells. The face in the front accepts direct solar radiation, while the face in the back accepts indirect solar radiation that is reproduced from the ground, clouds, and surrounding buildings. The chief focus is on determining how ambient temperature affects the performance of bifacial photovoltaic panels. On two hot summer days in Al-Marg city, important photovoltaic parameters of the binary system (short-circuit photocurrent density, open circuit photovoltaic voltage, maximum power conversion efficiency) was verified.
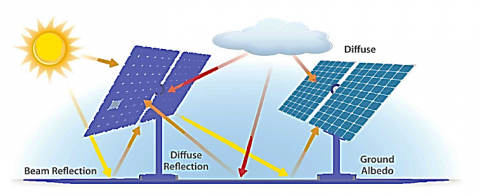
When compared to monofacial panels, the bifacial design allows for a greater collection of solar irradiances due to additional direct, diffuse, and reflected solar irradiation from the backside (See Figure 1). This is especially useful if the amount of space available in the installation is a constraint [14]. In addition, when compared to monofacial modules, bifacial modules' design may be used in more aspects and applications., such as sun blinds, railings, and noise barriers [15]. A front-side glass, solar cells, and back-side glass make up a conventional bifacial PV panel [16]. Unlike monofacial panels, which have four millimeters of glass on the front, bifacial panels have two millimeters of glass on the front and the same on the back. Even though it is made up of two glass sheets, the bifacial may be as hefty as a monofacial. However, a novel advancement on lightweight monofacial panels with two-millimeter front glass has just emerged [17].
Figure 1. Solar radiation direct, diffuse, and reflected from the front & rear
The optical model requires information about the sun's position as well as total observed global horizontal radiation (GHI) at the unit point. The diffuse horizontal radiation (GD) can be calculated from actual data or by applying a model to the GHI, such as the Arps model [18]. Horizontal beam irradiation (GB) is the difference between GHI and GD. A differentiation is created between oceanic diffuse and isotropic radiation using the anisotropic sky model. The model in ref. [18] is used to determine the resultant beam radiation, diffused light, and ground reflection on an inclined unit surface.
$G_{{TOTAL }}=G_{{Front }}+G_{{Rear }} \times \varphi \times\left(1-\eta_{ {loss }}\right)$ (1)
$\mathrm{G}_{\text {Rear }}=\mathrm{G}_{\text {Diffuse }}+\mathrm{G}_{\text {Reflected }}+G_{\text {Beam }}$ (2)
The bifacial gain (bifaciaity $\varphi$) is then calculated as the ratio of the rear bifacial unit output to the frontal single-sided output unit at the same location:
$\varphi=\frac{P_{R \mathrm{e} a r}}{P_{ {Front }}}$ (3)
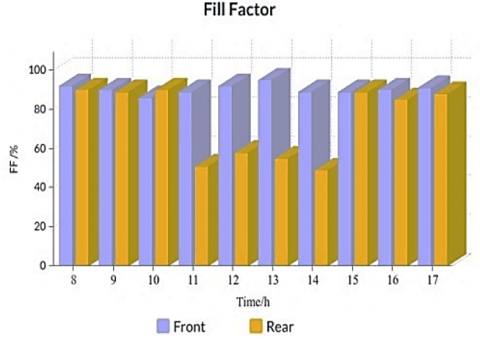
The Fill Factor (FF) is simply a metric for the solar cell's quality. It's computed by comparing the greatest power to the theoretical power that would be produced if the open-circuit voltage and short-circuit current were both equal.
$F F=\frac{P}{V_{o c} \times I_{s c}} \times 100 \%$ (4)
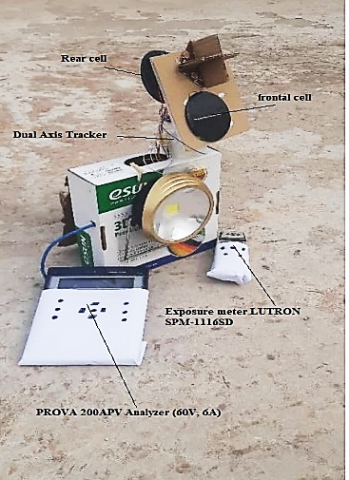
The data were collected in Al-Marj city (latitude: 32.488; longitude: 20.832) in mid-August. The sun is at its optimum angle of elevation for that day, time, and place. This time was chosen because the sun is at its peak in the summer, and the aim of the research is to test the solar tracker with double cells and the effect of heat on the cells in the harshest conditions. In this paper, two p-n silicon polycrystalline photovoltaic cells were evaluated on a p-type wafer. The two cells (5×5 cm) were attached back-to-back and mounted at a height of 0.5 m on a two-axis ground tracker. The model used is a two-axis solar tracker designed with front and rear solar cells. Its design components are an Arduino panel, light sensors, a DC motor and silicon cells. As shown in the figure, the system is placed directly in the south, with the front facing south and back toward the ground shown in Figure 2. Data were collected from 8.00 a.m. to 17.00 p.m., during daylight hours.
Figure 2. The experimental model used in this study
The Prova-200 PV portable module analyzer was used to measure the cells outside. Additional characteristics for example extreme solar power, voltage and current at supreme power, short circuit current, and open-circuit voltage are included in the swept current and voltage statistics., are all provided by this analyzer. The obtained data was also used to determine solar cell efficiency and fill factor. During the experiment, an environmental meter (SPM-1116S) and a solar power meter (Extech EN300) were used to assess the cell surface temperature and sunshine illumination. Data were composed at various times during the day and on several days to get a precise comparison of the impact of temperature and the reproduced sunlight on the double-sided solar cell presentation. The intensity of reflected radiation on the back cell is affected by the kind of ground, which in turn impacts the energy quantity collected from the back cell. At this experiment, we installed the device on a concrete ground that was not painted.
3.1 Error analysis
The result R is generally calculated in some way from the data, Xi. Thus we can write:
$R=R\left(X_1, X_2, \ldots, X_i\right)$ (5)
The uncertainty interval (e) in the result can be given as:
$e_R=\left\lceil\left(\frac{\partial R}{\partial X_1} e_{x_1}\right)^2+\left(\frac{\partial R}{\partial X_2} e_{x_2}\right)^2+\cdots\left(\frac{\partial R}{\partial X_i} e_{x_i}\right)^2\right]^{0.5}$ (6)
In dimensionless form:
$\frac{e_R}{R}=\left\lceil\left(\frac{\partial R}{\partial X_1} \frac{e_{X_1}}{X_1}\right)^2+\left(\frac{\partial R}{\partial X_2} \frac{e_{X_2}}{X_2}\right)^2+\cdots\left(\frac{\partial R}{\partial X_i} \frac{e_{X_i}}{X_i}\right)^2\right]^{0.5}$ (7)
The above formula gives the errors in instantaneous solar cell efficiency.
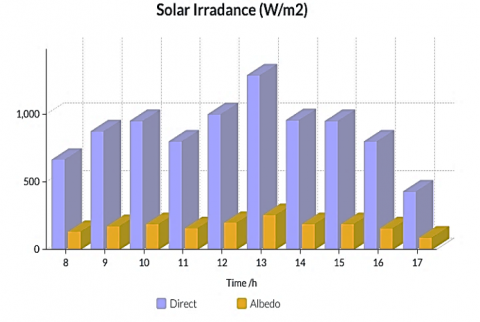
Figure 3 displays the average direct and reflected solar radiation at various hours measured with a standard silicon energy meter. Direct exposure signifies the strength of solar energy falling directly on the surface at a certain angle, in contrast diffuse reception exemplifies the strength of solar energy reflected from the ground to the back side of the surface. The solar radiation will be fewer than direct exposure because the back surface is shaded. The figure displays that radiation in the shade is approximately five times fewer than in direct exposure. The radiation reaches 1287 W/m2 at midday, which is a value close to standard radiation.
Figure 3. Solar radiation from direct radiation and Albedo exposure
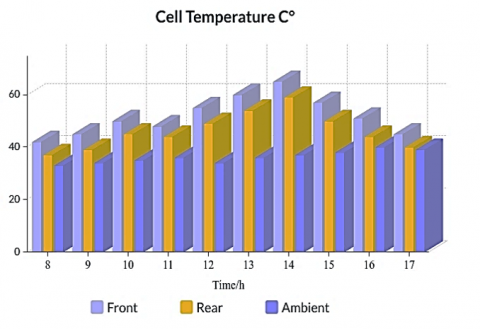
Figure 4 shows the surface temperature variation at different hours of the day monitored with a k-type thermocouple. The surface on the front withstands a greater temperature related to surface in the back. We find the temperature at front surface is 63℃, while it is 58℃ for the back surface at the same 14 pm measurement hour. This difference is important in the operation of the solar cells and can greatly affect the performance of the cell.
Figure 4. The surface temperature of the cell for direct exposure and albedo
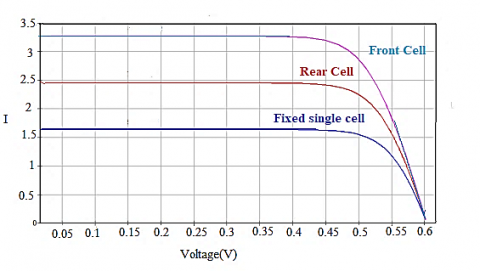
The current and voltage curves for front and rear photovoltaic cells are shown in Figure 5. In this experiment, it is evident that the posterior cell has better quadrature than the anterior cell. This suggests that the rear cell's fill factor, and hence its energy conversion efficiency, is higher than the front cell's. The voltage deterioration in the front cell JV curves is mostly due to the influence of temperature rise on the front cell (see Figure 4). The front cell's short circuit current, on the other hand, is substantially greater than the rear cells. This is because of the fact that the anterior cell receives more radiation (see Figure 3).
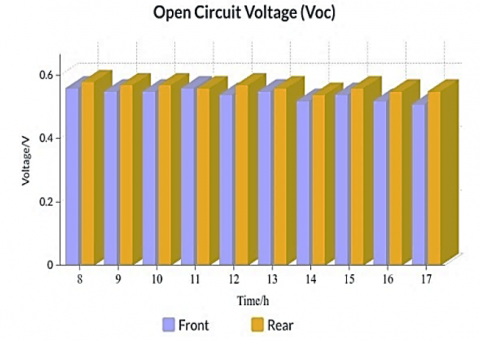
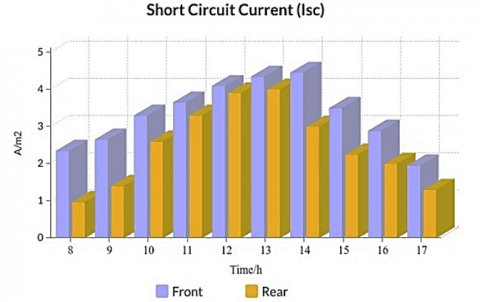
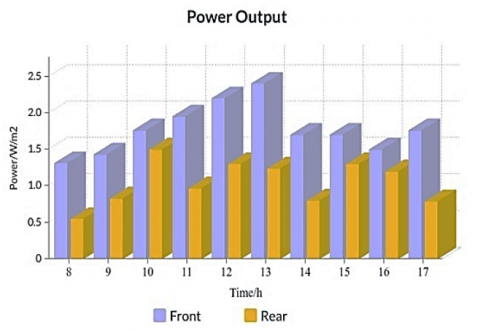
The photoelectric performance of the front and rear cells is shown in Figures 6(a) to 6(d). Because the front cell receives more radiation (approximately five times more) than the rear cell, it produces more VOC and energy, as demonstrated in Figure 6(c). The FF of the posterior cell, on the other hand, is noticeably greater than the comparable values for the anterior cell. This intriguing outcome may be traced back to the temperature of the cells. As illustrated in Figure 6(d), a greater fore-cell temperature (9℃ higher than the background) decreases the fore-overall cell's performance, resulting in decreased FF. This finding suggests that in extremely hot temperatures, a silicon solar cell might perform better in the shade than in the light.
Figure 5. Voltage and current curves for the front and rear cell
(a)
(b)
(c)
(d)
Figure 6. Parameters for the front and Rear cell:(a) VOC, (b) ISC, (c) Pm, and (d) FF
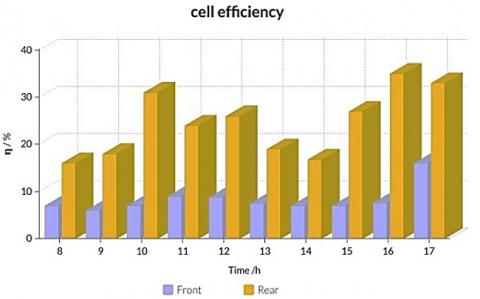
The front and rear cells' conversion efficiency (PCE) is shown in Figure 7. The PCE of the rear cell is higher than the corresponding values for the front cell, as shown in the diagram. The temperature of the plate is directly responsible for this intriguing finding. Higher front cell temperature (about 9℃) lowers total front cell function, resulting in decreased PCE. This finding suggests that in extremely hot conditions, silicon solar panels might be more efficient in the shade than in the sun. It is reasonable in terms of efficiency alone.
Figure 7. Conversion efficiency of front and rear cells
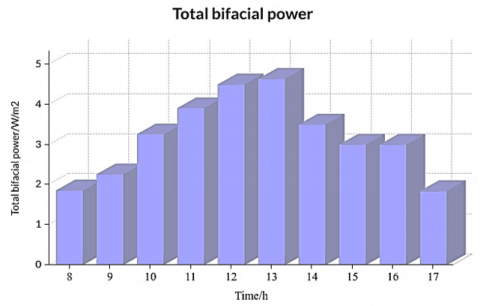
The output forces of the front and rear cells are coupled to replicate the bifacial structure, as shown in Figure 8. When two cells are linked in series, the current is restricted via the lower of the two cells' currents, whereas the voltage is equal to the total of the cell voltage. The voltage in parallel is restricted by the lowest voltage of the two cells, whereas the current is equal to the total of the two cells' currents.
Figure 8. Total bifacial energy of the two cells
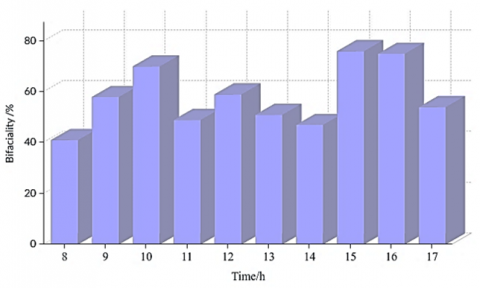
The name "bifaciality" refers to the difference between the rated maximum power when the solar radiation is distributed to the bifacial system from the front and rear. It demonstrates the ideal bifaciality system. In reality, if the bifaciality is close to unity, the system produces high binary quality. The finest quality bifacial is when the temperature differential between the two cells is the minimum, as shown in Figure 9. The overall output power is maximum when the front cell gets more radiation at small angles than the rear cell, when the temperature difference between the two cells is the lowest, the energy collected is the largest at 10:00 a.m., 3:00, and 4:00 p.m. because at highest radiation in midday, the temperature difference between the two cells is the highest.
Figure 9. Bifaciality of the bifacial system
The PV presentation of the bifacial silicon solar cell is exposed to be particularly sensitive to the operating temperature in this work. In hot conditions, a cell exposed to albedo can give better efficiency than one exposed to direct sunlight since the surface temperature can be decreased by 9 degrees Celsius when compared to the front surface temperature. And this rise significantly affects the energy production in the long run, and from the results it was shown that the use of the double cell gives better efficiency. The FF of the posterior cell is likewise greater than the comparable values for the anterior cell, according to the findings. This intriguing outcome may be traced back to the temperature of the cells.
The authors would like to thanks Al-Mustaqbal University College for the assistance in completing this work.
[1] Boman, K., Adolfsson, I., Ekbring, S. (2019). Bifacial photovoltaic systems established in a Nordic climate: A study investigating a frameless bifacial panel compared to a monofacial panel.
[2] Baloch, A.A., Armoush, M., Hindi, B., Bousselham, A., Tabet, N. (2017). Performance assessment of standalone bifacial solar panel under real time conditions. In 2017 IEEE 44th Photovoltaic Specialist Conference (PVSC), Washington, DC, USA, pp. 1058-1060. https://doi.org/10.1109/PVSC.2017.8366448
[3] Ismail, R.A., Hassan, K.I., Abdulrazaq, O.A., Abode, W.H. (2007). Optoelectronic properties of CdTe/Si heterojunction prepared by pulsed Nd: YAG-laser deposition technique. Materials Science in Semiconductor Processing, 10(1): 19-23. https://doi.org/10.1016/j.mssp.2006.12.001
[4] Ramidi, P., Abdulrazzaq, O., Felton, C.M., Gartia, Y., Saini, V., Biris, A.S., Ghosh, A. (2014). Triplet sensitizer modification of poly (3‐hexyl) thiophene (P3HT) for Increased efficiency in bulk heterojunction photovoltaic devices. Energy Technology, 2(7): 604-611. https://doi.org/10.1002/ente.201402008
[5] Chapin, D.M., Fuller, C.S., Pearson, G.L. (1954). A new silicon p‐n junction photocell for converting solar radiation into electrical power. Journal of Applied Physics, 25(5): 676-677. https://doi.org/10.1063/1.1721711
[6] Shockley, W., Queisser, H.J. (1961). Detailed balance limit of efficiency of p‐n junction solar cells. Journal of Applied Physics, 32(3): 510-519. https://doi.org/10.1063/1.1736034
[7] Luque, A. (1979). U.S. Patent No. 4,169,738. Washington, DC: U.S. Patent and Trademark Office.
[8] Cuevas, A., Luque, A., Eguren, J., del Alamo, J. (1982). 50 Per cent more output power from an albedo-collecting flat panel using bifacial solar cells. Solar Energy, 29(5): 419-420. https://doi.org/10.1016/0038-092X(82)90078-0
[9] Poulek, V., Libra, M. (2000). A very simple solar tracker for space and terrestrial applications. Solar Energy Materials and Solar Cells, 60(2): 99-103. https://doi.org/10.1016/S0927-0248(99)00071-9
[10] Ohtsuka, H., Sakamoto, M., Tsutsui, K., Yazawa, Y. (2000). Bifacial silicon solar cells with 21·3% front efficiency and 19·8% rear efficiency. Progress in Photovoltaics: Research and Applications, 8(4): 385-390. https://doi.org/10.1002/1099-159X(200007/08)8:4%3C385::AID-PIP340%3E3.0.CO;2-B
[11] Zhao, W.C., Wang, J.M., Shen, Y.L., Wang, Z.Q., Chen, Y.L., Hu, Z.Y., Li, G.J., Chen, J.H., Xiong, J.F., Guillevin, N., Heurtault, B.J.B., Geerligs, L.J., Weeber, A.W., Bultman, J.H. (2012). 0.35% Absolute efficiency gain of bifacial N-type Si Solar cells by industrial metal wrap through technology. In 2012 38th IEEE Photovoltaic Specialists Conference, pp. 002289-002291. https://doi.org/10.1109/PVSC.2012.6318055
[12] Valdivia, C.E., Li, C.T., Russell, A., et al. (2017). Bifacial photovoltaic module energy yield calculation and analysis. In 2017 IEEE 44th Photovoltaic Specialist Conference (PVSC), Washington, DC, USA, pp. 1094-1099. https://doi.org/10.1109/PVSC.2017.8366206
[13] Moria, H., Elmnifi, M. (2020). Feasibility study into possibility potentials and challenges of renewable energy in Libya. International Journal of Advanced Science and Technology, 29(3): 12546-12560.
[14] Sun, X., Khan, M.R., Deline, C., Alam, M.A. (2018). Optimization and performance of bifacial solar modules: A global perspective. Applied Energy, 212: 1601-1610. https://doi.org/10.1016/j.apenergy.2017.12.041
[15] Shoukry, I., Libal, J., Kopecek, R., Wefringhaus, E., Werner, J. (2016). Modelling of bifacial gain for stand-alone and in-field installed bifacial PV modules. Energy Procedia, 92: 600-608. https://doi.org/10.1016/j.egypro.2016.07.025
[16] Guerrero-Lemus, R., Vega, R., Kim, T., Kimm, A., Shephard, L.E. (2016). Bifacial solar photovoltaics–A technology review. Renewable and Sustainable Energy Reviews, 60: 1533-1549. https://doi.org/10.1016/j.rser.2016.03.041
[17] Kopecek, R., Libal, J. (2018). Bifacial Photovoltaics: Technology, Applications and Economics. Institution of Engineering and Technology.
[18] Duffie, J.A., Beckman, W.A., Blair, N. (2020). Solar Engineering of Thermal Processes, Photovoltaics and Wind. John Wiley & Sons.