Nguyen Tat Thang
© 2022 IIETA. This article is published by IIETA and is licensed under the CC BY 4.0 license (http://creativecommons.org/licenses/by/4.0/).
OPEN ACCESS
Ultrasonic methods, such as the Ultrasonic Velocity Profile - UVP method, have a number of advantages over other conventional measurement methods. They are non-intrusive, applicable to opaque wall or fluid, and capable of obtaining instantaneous velocity profiles along a measurement line in real time. This paper reports on the development of a multiwave Doppler UVP method for the measurement of bubbly two-phase flow in a Taylor-Couette flow configuration. Due to its highly complex nature, two-phase flow still attracts considerable interest in both experimental measurement as well as numerical simulation. In this study the new multiwave Doppler UVP method exploits two basic ultrasonic frequencies 2 MHz and 8 MHz. The 2 MHz frequency is for the measurement of the bubble phase. The 8 MHz frequency is for that of the liquid phase. The signal processing technique is based on the pulse repetition Doppler method. A new phase discrimination method is proposed to eliminate bubble velocity included in the data of the liquid phase measured by the 8 MHz frequency. Measurements of bubbly two-phase Taylor-Couette flow have been demonstrated and discussed.
ultrasonic measurement, UVP, two-phase flow, multiwave UVP method, phase discrimination, Taylor-Couette flow
The Ultrasonic Velocity Profile - UVP method uses ultrasound and signal processing techniques for the online measurement (i.e. in real time) of instantaneous velocity profiles along a measurement line that is the line of ultrasound propagation in the flow field. One of the early studies in this field was the ultrasonic measurement of blood flow [1]. In this method, typically, one ultrasonic sensor is used to work in a repeated cyclic process: first the sensor emits a short ultrasonic pulse into the flow field; then the same sensor listens the reflected echo. Time-gating and signal processing electronics permit the exact positioning of the reflected signal along the measurement line, and the real-time calculating of the velocity at the corresponding positions. Hence the instantaneous velocity profile of the flow is obtained online during the time of measurement. The method has a number of advantages over other conventional velocity measurement methods such as Pitot tube, hot-wire anemometry, optical visualization etc. Its important characteristics are non-intrusive, non-invasive, and applicable to measurements of opaque fluid in non-transparent containers because ultrasound can propagate through various materials. In addition, the ultrasonic sensor and hardware is highly compact. Hence the UVP method is not only highly suitable for laboratory experiments but also appropriate for measurements of existing systems without any modifications to the flow facility. This is especially important in extreme industrial conditions such as high pressure, high temperature etc. Moreover, the UVP method can also facilitate high measurement resolutions, both space and time. Therefore, measurement of short time transient fluid dynamics phenomenon which typically exist in two-phase flow can be facilitated [2].
Early and extensive development of ultrasonic measurement methods was mainly carried out in the medical field. Typical applications in the field were ultrasonic imaging and blood flow visualization [3]. Flow visualization uses pulsed ultrasonic techniques. Pulsed techniques have two main signal processing algorithms for the calculation of the velocity of the fluid flow. These are the pulsed Doppler technique and the pulsed correlation-based signal processing [4, 5]. In this paper, the two techniques are abbreviated as the Doppler and the correlation methods. Applications of the Doppler method outside of the medical field have been successfully attempted (e.g. see Takeda [6, 7]). And the Doppler method has become an important tool for velocity profile measurement in both research and engineering, and well established for single phase flow. Commercial Doppler-based UVP systems have become popular. Typically, the Doppler signal processing exploits multiple consecutive ultrasonic pulses (e.g. 16, 32, 64 pulses depending on the flow condition). The temporal resolution of measurement is reduced if more pulses are used. But the positive consequence is that the noise effect is also limited which is always preferable in practical measurements where noise cannot be ignored. In this method, due to the Nyquist’s sampling theorem the maximum measurable velocity is limited by the pulse emission frequency [8]. The maximum measurable velocity depends on the ultrasonic basic frequency used. An alternative to the Doppler method is the correlation method. Theoretically, the correlation method just requires the echo signal of two consecutive ultrasonic pulses to analyze the velocity profile. Thus, it has higher temporal resolution in comparison with the Doppler method. The correlation method works in the time domain, it does not suffer from the limitation of the Nyquist sampling frequency [9, 10]. Hence theoretically the maximum measurable velocity can be very high. However, the method is highly sensitive to noise. The accuracy of the received results need to be processed with care [10, 11]. Due to the complex nature of multiphase flow, practical applications of the correlation method to the measurements of multiphase systems are therefore in continuous investigations. Presently literature review confirms the advantages of the Doppler method in two-phase flow measurement, e.g. see [12-14]. Thus, the Doppler method is exploited in this study.
Two-phase flow exists in many important industrial and engineering systems such as two-phase flow reactors, centrifugal extractor etc., e.g. [15, 16], and heat-mass transfer and power generating systems of all scale, e.g. [17]. It is one of the most complex flow phenomenon that is still under continuous investigations both experimentally and numerically. The main characteristic that makes bubbly two-phase flow highly complex is the presence of the deformable phase-interface between liquid and gas, e.g. see [17, 18]. Development of efficient methods for the measurement of two-phase flow is of great importance. Take into account their advantages [19-25], development of UVP methods for two-phase flow measurement is always of great interest. When the UVP method is applied to the measurement of bubbly two-phase flow, the received echo includes the reflected signal from the liquid phase and that from the gas-liquid interface. Generally, ultrasound does not penetrate gas bubbles. Therefore, the measured velocity profile includes both bubble (or more exactly bubble surface) and liquid velocities. To get the velocity of the bubble phase and that of the liquid phase separately, a phase discrimination/phase separation technique is required as shown in, e.g., Aritomi et al. [19, 20], Zhou et al. [21], Kikura et al. [22], Suzuki et al. [23].
An alternative method has been proposed by Murakawa et al. [24]. The method uses a specially designed ultrasonic sensor called a multiwave sensor that can emit and receive two ultrasonic basic frequencies, 2 MHz and 8 MHz, at the same time. The 8 MHz frequency has shorter wavelength and is tuned to successfully measure the velocity of the liquid phase. However, if bubbles cross the 8 MHz measurement line, strong reflected signal from the gas-liquid interface is included in the 8 MHz frequency and the velocity measured by the 8 MHz frequency includes the bubble velocity which needs to be eliminated. The 2 MHz frequency which has longer wavelength is tuned to properly measure only the bubble phase by eliminating weak reflected signal from the liquid phase. Synchronized electronics enable the instantaneous and simultaneous measurements of both phases at the same positions along the measurement line. For each frequency of the multiwave system, the signal processing based on the correlation method has been developed [25]. Phase separation was achieved by comparing the strength of the reflected signals.
The correlation method is sensitive to noise. This problem would have strong effect in multiphase systems. Therefore, in this study, the development of a multiwave Doppler UVP method for bubbly two-phase flow measurement has been attempted. The signal processing is based on the pulse repetition Doppler method. The method also exploits the multiwave ultrasonic sensor that has two basic frequencies 2 MHz and 8 MHz. A new phase separation technique is proposed to discriminate the bubble velocity included in the measured data of the 8 MHz frequency by using the data of the 2 MHz frequency. The applicability of the new method has been demonstrated in the measurement of bubbly two-phase Taylor-Couette flow. In reported literature, extensive experimental study of single-phase Taylor-Couette flow has been carried out, e.g. see [6, 7]. However, due to the limitations of two-phase measurement methods, experimental measurement of two-phase Taylor-Couette flow is still a subject of further investigations. Any contributions in this field are of significant interest.
Practically, as shown in Figure 1, the Doppler method analyzes a number of ultrasonic echo pulses to detect the Doppler shift frequency fd that is the change in frequency of the echo sound in comparison with the emitted sound as the result of the Doppler effect. Moreover, taking into account the direction of the movement and the direction of the sound propagation, fd is usually calculated using Eq. (1):
$f_d=2 f_0 \frac{v}{c} \cos (\theta)$ (1)
where, $\mathcal{V}$ is the velocity of fluid particles at the measurement position; f0 is the basic ultrasonic frequency, i.e. the center frequency of the ultrasonic sensor, θ is the angle between the flow direction and the sound path. As shown in Eq. (1), the Doppler effect is maximum when the sound path is in line with the flow direction. If they are perpendicular to each other, there is no Doppler effect. In general, the working principle of the Doppler method is depicted in Figure 1. In the figure, Tprf is the period of ultrasonic pulse emission; t0 is the origin of the zero-crossing method which is presented as an example of the analyzing techniques to obtain the Doppler shift frequency fd.
Figure 1. The principle of the pulse repetition Doppler method
As depicted in Figure 1, in one emission-reception cycle, the ultrasonic sensor emits one ultrasonic pulse and then listen the echo sound reflected from positions/volumes along the sound path. The ultrasonic sound speed c in the working fluid is known a priori. Hence the measurement positions along the sound path and the corresponding echo from these positions are exactly determined based on the time lapse after the emission of each ultrasonic pulse. This is known as the time-gating technique. By analyzing a number of consecutive echoes from each measurement position, the Doppler shift frequency fd of the positions is calculated. From Eq. (1), the velocity of the fluid flow at the positions is obtained as shown in Eq. (2). And hence a velocity profile is determined along the measurement line.
$v=\frac{f_d}{f_0} \cdot \frac{c}{2 \cos (\theta)}$ (2)
There are several techniques for the detection of the frequency shift fd such as the zero crossing method, fast Fourier analysis (FFT), or autocorrelation based on the Wiener-Khinchine theorem, etc. [26, 27]. In the implementation of the Doppler method in this study, the autocorrelation technique is used as shown in Figure 2 based on the practical investigation in our previous related studies, e.g. see [28]. As depicted in Figure 2, in the autocorrelation Doppler signal processing, the conventional quadrature detection algorithm is applied to the digitized signal of each frequency 2 MHz and 8 MHz of the multiwave sensor [27-31]. The autocorrelation method requires the in-phase signal and the quadrature-phase one. The in-phase component is obtained by multiplying the echo signal with the basic signal of frequency f0. The quadrature-phase signal is obtained by multiplying the echo signal with the 90°-shift of the basic signal. Both components are low-pass filterred, thus only components of low frequency fd are remained. Then the autocorrelation algorithms are used to obtain the Doppler shift frequency fd.
Figure 2. Autocorrelation Doppler signal processing algorithm
Since echoes corresponding to several consecutive emitted ultrasonic pulses are required for the calculation of the frequency shift fd, the maximum measurable velocity of the Doppler method is limited due to the Nyquist’s sampling theorem. If the pulse emission period is Tprf which corresponds to the pulse repetition frequency Fprf, the maximum detectable Doppler shift frequency is fd ≤ Fprf / 2. Therefore, according to Eq. (2), the maximum measurable velocity vmax is limited by:
$v_{\max }=\frac{c F_{p r f}}{4 f_0 \cos (\theta)}$ (3)
As shown in Eq. (3), vmax also depends on f0. During practical measurements, care must be taken to ensure that the measured flow velocity does not exceed the maximum measurable velocity of the measurement system.
The new multiwave Doppler UVP method developed in this study uses the multiwave sensor. The design of the multiwave ultrasonic sensor is schematically shown in Figure 3. The sensor has two piezoelectric elements 2 MHz and 8 MHz. The 8 MHz element with diameter 3 mm is located at the center of the 2 MHz one which has diameter 10 mm [24]. The characteristics of this specially designed multiwave sensor have been investigated [25].
Figure 3. Multiwave ultrasonic sensor [24]
Synchronized electronics and the pulse repetition Doppler signal processing software have been devised for the multiwave UVP method. Echo signal of the 2 MHz and 8 MHz frequencies are received by the corresponding piezoelectric elements of the multiwave sensor. The working diagram of the multiwave UVP system is shown in Figure 4. The pulser/receiver electronics take the role to excite the piezoelectric elements of the multiwave sensor to generate and emit ultrasonics pulses into the flow field, and then receive the reflected ultrasonic sound in the form of radio frequency – RF signal. The RF signal of both frequencies is digitized by a synchronized high speed digitizer ADC and then transferred to a signal processing PC for real-time analysis. It is worth noting that real-time signal processing enables online measurement of instantaneous velocity of two-phase flows.
System specifications:
1) Multiwave sensor (2 MHz Φ10 and 8 MHz Φ3).
2) Pulser/receiver: 2 channels for the 2 MHz or 8 MHz piezoelectric elements of the multiwave sensor. Main specifications:
- Controlled excitation pulse length: 1-31 cycles,
- Controlled excitation pulse energy: 10-500 V,
- Controlled excitation pulse repetition frequency: 0.1 - 8 kHz.
3) ADC: 2 synchronized channels for 2 MHz and 8 MHz digital data acquisition, National Instrument NI PCI-5112 analog to digital converter, maximum digitizing rate 100 MS/s, 32 MB on board memory each channel.
4) PC: hosting signal processing library of the pulse repetition Doppler method developed using C++, and embedded into LabVIEW.
Figure 4. Multiwave UVP system
The working flowchart of the multiwave UVP software is presented in Figure 5. The measurement system has three working modes. The first mode is online visualization of phase velocity profiles in real time without saving data. This enables the selection of the most suitable measurement settings. The second mode is online visualization and saving data, also in real time. In this mode, the system will stop when a pre-specified number of velocity profiles of each phase is achieved. The third mode is wave data saving mode. In this mode, only digitized echo signal is saved for post-processing. This mode is also highly useful. Various signal processing experiments can be performed on the raw data obtained in this mode. In addition, the system can start operation by an excitation signal. This enables synchronization with other measurement systems such as optical flow visualization etc. In Figure 5, N is an input parameter that is specified before a measurement. UVP measurement stops when the number of the measured profiles exceeds N.
Figure 5. Working flowchart of the multiwave Doppler UVP software
Phase separation or phase discrimination is often required in two-phase flow measurement when the measured data of one phase is included in that of the other phase [32]. As noted in previous chapters, the 8 MHz frequency may contain bubble data if bubbles cross the measurement line. Therefore, bubble data have to be eliminated from the liquid data to obtain velocity profiles of liquid only. In order to do that, the following phase discrimination procedure has been proposed and presented below.
Figure 6. Flow patterns in bubbly two-phase flow measurement using the multiwave UVP method
The flow patterns that may exist in bubbly two-phase flow measurement using the multiwave UVP method include:
a) No bubbles cross the ultrasonic beam of the 2 MHz and 8 MHz frequencies;
b) Bubbles cross the 2 MHz frequency;
c) Bubbles cross both the 2 MHz and 8 MHz frequencies.
In pattern a) presented in Figure 6a, only fluid velocity profile is measured by the 8 MHz frequency. There is no bubble velocity along the 2 MHz measurement line. The 2 MHz frequency has no measured data. When bubbles cross the 2 MHz frequency, pattern b) depicted in Figure 6b, bubble velocity is measured by the 2 MHz frequency; fluid velocity is measured separately by the 8 MHz frequency at the same time. When bubbles cross the 8 MHz beam, pattern c), both frequencies measure bubble velocity. In this pattern, the 8 MHz frequency measures both fluid velocity and bubble velocity. However, the 8 MHz ultrasound is obstructed by the bubble. We suggest the measured data behind the bubble position be considered as noise and discriminated. As a result, the measured velocity of the fluid phase in the 8 MHz frequency behind the bubble position needs to be deleted as shown in Figure 6c.
With the proposed algorithm for phase separation, instantaneous velocity profiles of both liquid phase and bubble phase can be measured simultaneously along the measurement line. It is worth noting that relative velocity between bubble and liquid is not needed for phase separation.
5.1 Flow configuration and experimental apparatus
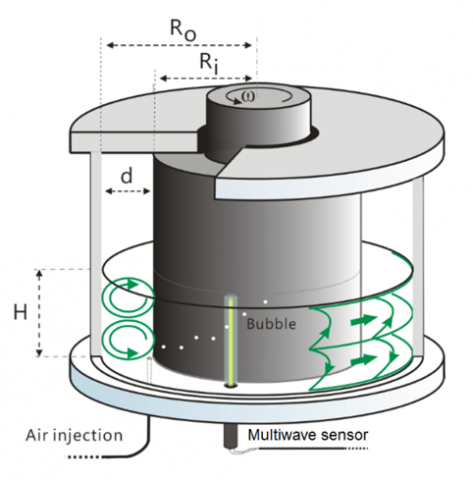
The developed multiwave Doppler UVP method is applied to the measurement of bubbly two-phase air-glycerol Taylor-Couette flow in the gap between two concentric rotating cylinders as shown in Figure 7. In this configuration, the inner cylinder rotates, the outer one fixes. The main specifications of the Taylor-Couette flow configuration are:
- Aspect ratio: $\Gamma=H / d$;
- Radius ratio: $\eta=R_i / R_o$ ;
- Reynolds number: $\mathrm{Re}=\omega R_i d / v$.
where, H, d, Ri, Ro and ω are shown in Figure 7.
In this type of flow configuration, when the rotational speed of the inner cylinder increases, the Taylor-Couette flow shows a transition from laminar Couette flow to Taylor vortex flow, wavy vortex flow, modulated wavy vortex flow and finally a chaos flow which is usually considered turbulent flow. UVP measurements of small aspect ratio single phase Taylor-Couette flow have been carried out, e.g. see [33]. In the multiwave UVP measurement of the bubbly two-phase Taylor-Couette flow in this study, the configurations are $\Gamma=2 ; \eta=0.667$; the flow regime is Taylor vortex flow. To generate bubbly two-phase flow in the system, air is injected from the bottom as shown in Figure 7. The multiwave sensor is positioned vertically upward at the bottom of the gap. The velocity profiles of liquid and rising bubbles are measured along the measurement line of the multiwave sensor as shown in Figure 7. It is worth noting that glycerol is used in this study since its viscosity is higher than that of water. That is an important factor to achieve all flow patterns mentioned above in the flow configuration.
Figure 7. Bubbly two-phase Taylor-Couette flow configuration
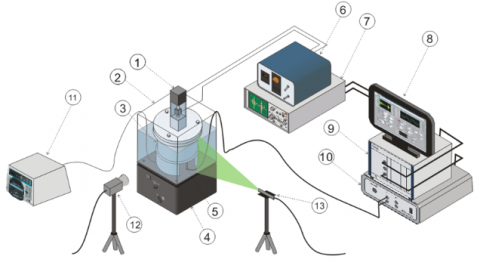
The experimental apparatus is schematically described in Figure 8 where the numbers in the figure correspond to: 1 Motor for driving the rotation of the inner cylinder; 2 Water box for flow visualization; 3 Taylor-Couette flow generator; 4 Isolator; 5 Multiwave sensor; 6 Motor controller; 7 Oscilloscope; 8 PC; 9 ADC, 10 Pulser/Receiver; 11 Air pump; 12 High speed camera; 13 Laser for flow visualization using the high speed camera 12.
Figure 8. Experimental apparatus
In addition to multiwave UVP measurements, flow visualization using the high speed camera 12 and laser sheet 13 was also conducted. In order to eliminate the effects of the curved surface on optical flow visualization, the Taylor-Couette flow system was submerged in the water box 2. Recorded images of the flow field were used for the observation of the flow structures, bubble behavior and PIV (Particle Imaging Velocimetry) analysis.
5.2 Experimental settings
Glycerol-water solution 68 wt. %, i.e. the weight percentage of glycerol is 68% in the solution, is used as the working fluid. The parameters and settings of the measurements are listed in Table 1 and Table 2. To demonstrate the applicability of the newly developed Doppler UVP measurement method, measurements were carried out in low void fraction condition in which the ratio between the volume of the gas phase to the total flow volume is small. Single bubbles were observed along the measurement line of the multiwave UVP sensor.
Table 1. Experimental settings
|
Parameter |
Abbreviation |
Setting |
|
Radius of inner cylinder |
$R_i$ |
50 mm |
|
Radius of outer cylinder |
$R_o$ |
75 mm |
|
Height of the fluid column in the gap |
H |
50 mm |
|
Inner cylinder rotational speed |
$\omega$ |
70 rpm |
|
Reynolds number |
$R e$ |
556 |
|
Diameter of the seeding particles, i.e. ultrasonic and PIV reflectors |
|
80 $\mu m$ |
|
Seeding particle concentration |
|
0.5 g/L |
|
Liquid temperature |
T |
20.1℃ |
|
Liquid density |
$\rho$ |
1.173 g/cm3 |
|
Liquid kinematic viscosity |
v |
16.468 mm2/s |
|
Sound speed in the working liquid (glycerol) |
c |
1820 m/s |
|
Air flow rate |
|
3 L/min |
|
Bubble diameter |
|
~1 mm |
Table 2. Multiwave UVP settings
|
Parameter |
Abbreviation |
Setting |
|
Multiwave frequencies |
$f_0$ |
2 MHz $(\phi 10)$ 8 MHz $(\phi 3)$ |
|
Spatial resolution of the multiwave UVP |
|
0.91 mm (2 MHz) 0.91 mm (8 MHz) |
|
Ultrasonic wavelengths |
$\lambda$ |
740 $\mu m$ (2MHz) 185 $\mu m$ (8MHz) |
|
Number of cycles of the excitation pulses |
$n$ |
2 (2 MHz) 8 (8 MHz) |
|
Ultrasonic pulse repetition frequency |
$F_{p r f}$ |
1 kHz |
|
Sampling rate of ADC |
|
25 MS/s |
The multiwave UVP sensor is fixed vertically at a distance 5 mm from the outer cylinder. Note that the visualization mode of the multiwave Doppler UVP developed here is highly important to the proper setting of the measurements. All flow parameters including liquid velocity, bubble velocity, measurement depth etc. are well confirmed to be in the working range of the measurement method before any measurements were carried out.
5.3 Measured results
Measurements have been carried out with the experimental settings shown in Table 1 and Table 2. With the settings, flow observation, e.g. see Figure 9, confirms that single bubbles cross the multiwave UPV measurement line. In this configuration, there exist two vortex structures as shown in the particle-streak image and the qualitative PIV velocity field in Figure 9 (left and middle). An example of particle images with bubbles present is shown on the right.
Figure 9. Optical flow visualization and analysis
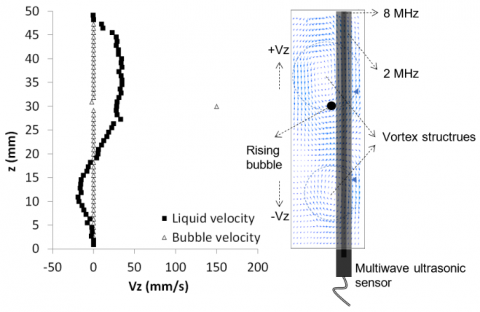
Instantaneous velocity profiles of both liquid phase and bubble phase have been successfully obtained online during the flow process. Typical profiles of the instantaneous velocity of the two phases, which show the process of bubbles crossing the multiwave UPV measurement line, are shown in Figure 10 (a to d). Figure 10 also shows the setting of the multiwave sensor in comparison with the Taylor-Couette flow structures (on the right). It is worth noting that, in the Doppler UVP method of this study, the sign convention is that the measured velocity is positive for the movement away from the sensor and negative for that toward the sensor.
As depicted in Figure 7, single bubbles detach from the air nozzle rising upward and following the Taylor-Couette flow from left to right. The movement of bubbles in bubbly two-phase flow is complex. Detailed observations in this experiment confirmed that bubbles typically did not cross right at the center of the sound path. Anyway the instantaneous velocity profile of the liquid phase was always captured by the 8 MHz frequency. Once the bubbles approached the measurement line of the multiwave sensor, their velocity was measured by the 2 MHz frequency. The bubble velocity profiles were obtained in the 2 MHz frequency until the bubbles leaved the measurement line. In Figure 10, z is the vertical direction along the measurement line, Vz is the velocity component of the liquid phase and bubble phase in the vertical direction.
a)
b)
c)
d)
Figure 10. Measured results of instantaneous velocity profiles of liquid and bubbles
As depicted in Figure 10a, when bubbles first approach the 2 MHz component of the measurement line of the multiwave sensor, bubble velocity profiles measured by the 2 MHz frequency show the data at one measurement position/volume (see Figure 1). Fluid velocity profiles are obtained by the 8 MHz frequency only.
When bubbles further cross the measurement line (Figure 10b, c), they occupy several measurement positions along the measurement line. As a result, reflected ultrasound comes from several positions along the measurement line. Hence the 2 MHz frequency captures the bubble velocity at a number of positions along its measured profile. However, bubbles do not actually come in contact with the 8 MHz frequency, the 8 MHz frequency does not show bubble velocity. Only at some measurement positions of the 8 MHz frequency, the fluid velocity is affected by the nearby the bubbles. Note that bubbles participate in several simultaneous movements and they randomly cross the measurement line of the multiwave sensor. As noted above, bubbles do not always cross the 8 MHz frequency whose diameter of the piezoelectric element is much smaller than that of the 2 MHz frequency.
Finally in Figure 10d, bubbles almost leave the measurement line of the multiwave sensor, the bubble velocity is only captured at one measurement position of the 2 MHz frequency. Therefore, in this typical situation, the measured velocity profiles of the two phases appear to belong to the flow pattern b in the phase separation procedure. Instantaneous velocity profiles of both liquid phase and bubble phase are successfully measured by the multiwave Doppler UVP method.
A multiwave Doppler UVP method for the measurement of bubbly two-phase Taylor-Couette flow has been developed and tested for the first time. This method exploited two ultrasonic frequencies to measure at the same time instantaneous velocity profiles of both liquid phase and bubble phase in real time, along one measurement line. A phase discrimination procedure has also been proposed. Measurements of bubbly two-phase flow in a Taylor-Couette flow configuration have been conducted. Based on the received results, the following concluding remarks have been established:
- The multiwave Doppler UVP method for the measurement of bubbly two-phase Taylor-Couette flow has been successfully developed.
- A new phase separation technique has been proposed to discriminate the bubble velocity from the measured data of the liquid phase.
- For the first time, the new method enables non-intrusive and online measurement of the instantaneous velocity profiles of both liquid phase and bubble phase in the bubbly two-phase Taylor-Couette flow configuration.
- Measurements of the bubbly two-phase Taylor-Couette flow has been performed using the new method. Instantaneous velocity profiles of only liquid and only bubbles have been obtained at the same positions along one measurement line. The received results have been analyzed and discussed.
The new method would be highly useful in further detailed visualization and study of multiphase Taylor-Couette flow, e.g. the flow physics, the phase separation phenomena, the interaction between the vortex structures and the dispersed phase etc.
The author is grateful to Prof. Hiroshige Kikura, Tokyo Institute of Technology – TIT, and Dr. Hideki Murakawa, Kobe University, Japan for technical help to carry out this research.
|
c |
sound speed in the working liquid, m. s-1 |
|
d |
the width of the gap between the inner cylinder and the outer one in the Taylor-Couette configuration, mm |
|
fd |
Doppler frequency shift, s-1 |
|
f0 |
basic ultrasonic frequency, s-1 |
|
Fprf |
pulse repetition frequency, s-1 |
|
H |
height of the fluid column in the gap, mm |
|
n |
number of cycles of the excitation pulses |
|
N |
number of velocity profiles to be measured |
|
Re |
Reynolds number |
|
Ri |
radius of inner cylinder, mm |
|
Ro |
radius of outer cylinder, mm |
|
t |
time, s |
|
Tprf |
pulse repetition period, s |
|
T |
liquid temperature, ℃ |
|
v |
velocity, m. s-1 |
|
vmax |
maximum measurable velocity of the Doppler UVP method, m. s-1 |
|
Vz |
Fluid velocity in the ultrasonic measurement line, m. s-1 |
|
z |
vertical axis along the UVP measurement direction |
|
Greek symbols |
|
|
λ |
ultrasonic wavelengths, m |
|
ν |
liquid kinematic viscosity, m-2. s |
|
ω |
rotational speed of the inner cylinder of the Taylor-Couette flow configuration, rad. s-1 |
|
ρ |
liquid density, kg. m-3 |
|
$\theta$ |
Doppler angle, rad |
[1] Satomurai, S. (1959). Study of the flow patterns in peripheral arteries by ultrasonics. Journal of Acoustic Society of Japan, 15: 151-158.
[2] Fan, J., Wang, F. (2021). Review of ultrasonic measurement methods for two-phase flow. Review of Scientific Instruments, 92(9): 091502. https://doi.org/10.1063/5.0049046
[3] Ensminger, D., Bond, L.J. (2011). Ultrasonics: Fundamentals, Technologies, and Applications. CRC Press.
[4] Bonnefous, O., Pesque, P. (1986). Time domain formulation of pulse-Doppler ultrasound and blood velocity estimation by cross correlation. Ultrasonic Imaging, 8(2): 73-85. https://doi.org/10.1016/0161-7346(86)90001-5
[5] Nguyen, T.T., Kikura, H., Duong, N.H., Murakawa, H., Tsuzuki, N. (2013). Measurements of single-phase and two-phase flows in a vertical pipe using ultrasonic pulse Doppler method and ultrasonic time-domain cross-correlation method. Vietnam Journal of Mechanics, 35(3): 239-256. https://doi.org/10.15625/0866-7136/35/3/3070
[6] Takeda, Y. (1986). Velocity profile measurement by ultrasound Doppler shift method. International Journal of Heat and Fluid Flow, 7(4): 313-318. https://doi.org/10.1016/0142-727X(86)90011-1
[7] Takeda, Y. (2012). Ultrasonic Doppler Velocity Profiler for Fluid Flow. Springer Science & Business Media.
[8] Povey, M.J. (1997). Ultrasonic Techniques for Fluids Characterization. Elsevier.
[9] Hein, I.A, Suorsa, V., Zachary, J., Fish, R., Chen, J., Jenkins, W.K., O'Brien Jr, W.D. (1989). Accurate and precise measurement of blood flow using ultrasound time domain correlation. Proceedings of IEEE Ultrasonics Symposium, pp. 881-886. https://doi.org/10.1109/ULTSYM.1989.67115
[10] Yamanaka, G., Kikura, H., Aritomi, M. (2002). Study on the development of novel velocity profiles measurement method using ultrasonic time-domain cross-correlation. Proceedings of 3rd Symposium on Ultrasonic Doppler Methods for Fluid Mechanics and Fluid Engineering, pp. 109-114.
[11] Wada, S., Furuichi, N. (2021). Improving accuracy of pipe flow rate measurement with ultrasonic time-domain correlation method under small number density of reflectors. Measurement, 179: 109439. https://doi.org/10.1016/j.measurement.2021.109439
[12] Takeda, Y. (2006). Ultrasonic velocity profiler - from present to future. Proceedings of 5th International Symposium on Ultrasonic Doppler Method for Fluid Mechanics and Fluid Engineering, pp. 1-2.
[13] Tan, C., Murai, Y., Liu, W., Tasaka, Y., Dong, F., Takeda, Y. (2021). Ultrasonic Doppler technique for application to multiphase flows: A review. International Journal of Multiphase Flow, 144: 103811. https://doi.org/10.1016/j.ijmultiphaseflow.2021.103811
[14] Nguyen, T.T. (2021). Simultaneous measurement of two-phase flow parameters for drift-flux model. International Journal of Heat and Technology, 39(4): 1343-1350. https://doi.org/10.18280/ijht.390434
[15] Ye, L., Wan, T., Xie, X., Hu, L. (2022). Study on flow characteristics and mass transfer mechanism of kettle Taylor flow reactor. Energies, 15(6): 2028. https://doi.org/10.3390/en15062028
[16] Schrimpf, M., Esteban, J., Warmeling, H., Färber, T., Behr, A., Vorholt, A.J. (2021). Taylor‐Couette reactor: principles, design, and applications. AIChE Journal, 67(5): e17228. https://doi.org/10.1002/aic.17228
[17] Ishii, M., Hibiki, T. (2010). Thermo-Fluid Dynamics of Two-Phase Flow. Springer Science & Business Media.
[18] Fatt, Y.Y., Goharzadeh, A. (2021). Modeling of particle deposition in a two-fluid flow environment. International Journal of Heat and Technology, 39(3): 1001-1014. https://doi.org/10.18280/ijht.390338
[19] Aritomi, M., Zhou, S., Nakajima, M., Takeda, Y., Mori, M., Yoshioka, Y. (1996). Measurement system of bubbly flow using ultrasonic velocity profile monitor and video data processing unit. Journal of Nuclear Science and Technology, 33(12): 915-923. https://doi.org/10.1080/18811248.1996.9732033
[20] Aritomi, M., Zhou, S., Nakajima, M., Takeda, Y., Mori, M. (1997). Measurement system of bubbly flow using ultrasonic velocity profile monitor and video data processing unit, (II). Journal of Nuclear Science and Technology, 34(8): 783-791. https://doi.org/10.1080/18811248.1997.9733742
[21] Zhou, S., Suzuki, Y., Aritomi, M., Matsuzaki, M., Takeda, Y., Mori, M. (1998). Measurement system of bubbly flow using ultrasonic velocity profile monitor and video data processing unit, (III). Journal of Nuclear Science and Technology, 35(5): 335-343. https://doi.org/10.1080/18811248.1998.9733869
[22] Kikura, H., Aritomi, M., Suzuki, Y., Mori, M. (2000). Investigation of structure around bubbles using ultrasonic Doppler method. Heat Transfer Science and Technology, 512-517.
[23] Suzuki, Y., Nakagawa, M., Aritomi, M., Murakawa, H., Kikura, H., Mori, M. (2002). Microstructure of the flow field around a bubble in counter-current bubbly flow. Experimental Thermal and Fluid Science, 26(2-4): 221-227. https://doi.org/10.1016/S0894-1777(02)00130-9
[24] Murakawa, H., Kikura, H., Aritomi, M. (2005). Application of ultrasonic Doppler method for bubbly flow measurement using two ultrasonic frequencies. Experimental Thermal and Fluid Science, 29(7): 843-850. https://doi.org/10.1016/j.expthermflusci.2005.03.002
[25] Murakawa, H., Kikura, H., Aritomi, M. (2008). Application of ultrasonic multi-wave method for two-phase bubbly and slug flows. Flow Measurement and Instrumentation, 19(3-4): 205-213. https://doi.org/10.1016/j.flowmeasinst.2007.06.010
[26] Takeda, Y. (1995). Velocity profile measurement by ultrasonic Doppler method. Experimental Thermal and Fluid Science, 10(4): 444-453. https://doi.org/10.1016/0894-1777(94)00124-Q
[27] Kasai, C., Namekawa, K., Koyano, A., Omoto, R. (1985). Real-time two-dimensional blood flow imaging using an autocorrelation technique. IEEE Transactions on Sonic and Ultrasonic, 32(3): 458-464. https://doi.org/10.1109/T-SU.1985.31615
[28] Nguyen, T.T., Murakawa, H., Tsuzuki, N., Kikura, H. (2013). Development of multiwave method using ultrasonic pulse Doppler method for measuring two-phase flow. Journal of the Japanese Society for Experimental Mechanics, 13(3): 277-284. https://doi.org/10.11395/jjsem.13.277
[29] Wada, S., Kikura, H., Aritomi, M., Mori, M., Takeda, Y. (2004). Development of pulse ultrasonic Doppler method for flow rate measurement in power plant - multiline flow rate measurement on metal pipe. Journal of Nuclear Science and Technology, 41(3): 339-346. https://doi.org/10.1080/18811248.2004.9715493
[30] Barber, W.D., Eberhard, J.W., Karr, S.G. (1985). A new time domain technique for velocity measurement using Doppler ultrasound. IEEE Transaction on Biomedical Engineering, 32(3): 213-229. https://doi.org/10.1109/TBME.1985.325531
[31] Sakagami, R., Murakawa, H., Sugimoto, K., Takenaka, N. (2011). Effects of frequency analysis algorithms on velocity data using ultrasonic Doppler method. Proceedings of ASME-JSME-KSME Joint Fluids Engineering Conference. https://doi.org/10.1115/AJK2011-11021
[32] Delhaye, J.M., Cognet, G. (2012). Measuring Techniques in Gas-Liquid Two-Phase Flows. Springer Science & Business Media.
[33] Ito, D., Kishikawa, S., Kikura, H., Kawai, H., Aritomi, M., Takahashi, H. (2004). UVP measurement of Taylor-Couette vortex flow with small aspect ratio. Proceedings of 4th International Symposium on Ultrasonic Doppler Method for Fluid Mechanics and Fluid Engineering, pp. 149-152.