Adel Mohamed Abdel-Dayem* | Mohammed Abdulrahman Baharith
© 2022 IIETA. This article is published by IIETA and is licensed under the CC BY 4.0 license (http://creativecommons.org/licenses/by/4.0/).
OPEN ACCESS
A solar adsorption ice maker was numerically studied. The system is an adsorption cycle that is connected to a separate solar heating system. An oil solar collector is connected to the generator of the adsorption cycle through a heat-exchanger in a closed loop. A refrigeration pair of Methanol-Activated Carbon (AC) was considered in the adsorption cycle. A mathematical model was developed for each component of the system. A transient numerical simulation was established, and the annual system performance was demonstrated under weather conditions of Makkah city, 21.5 ⸰N. The system unique design was achieved, and the ideal mass was predicted for the adsorbent and adsorbate together maintaining a constant percentage between them. It is found that the system which apply the Activated carbon/Methanol YKAC (14-20 MESH) might possibly deliver high solar system performance (SCOP) of about 0.26 during the cold days and 0.367 of cycle. As expected, lower temperature of the condenser and higher temperature of the evaporator can improve the system COP. In addition, three different kinds of collectors were considered and the maximum efficiency of about 0.80 was achieved for flat plate at optimum area of 3.15 m2 which is higher than both evacuated-tube (ETC) and parabolic trough collector (PTC) all over the year. The ETC efficiency is about 0.71 at ideal collector area of 3.5 square meters while the optimum area of the parabolic trough is 8.4 m2 at 0.79 of efficiency. In conclusion, the system results recommended that 22kg of ice could be produced every day for each square meter of solar collector.
solar adsorption, icemaker, methanol-activated carbon, numerical simulation, optimization
Due to the rapid expansion of population and industry, there is a growing need for refrigeration and air conditioning. In the last century, many refrigeration techniques were developed. A popular technique is called the vapor compression refrigeration cycle, which compresses the refrigerant in the steam engine, using the evaporated and condensed steam. Another well-known technique is the gas refrigeration cycle, which keeps the refrigerant at the steam stage. These traditional refrigeration systems consume lots of electricity [1].
The conventional systems of refrigeration consume a considerable amount of electricity. The refrigerants used in these systems include hydro chlorofluorocarbons (HCFCs) and chlorofluorocarbons (CFCs). These refrigerants have negative impact as it shares in the damage of the World's ozone layer. Once occur, different refrigeration technologies have turned to be increasingly significant, particularly as traditional energy sources for instance oil are predictable to totally depleted shortly. The human residence areas not completely covered by electricity. For the moment, there are several areas lacking electricity, mostly in the rural areas of numerous developing states. Consequently, persons dwelling in such areas are incapable to save their food or store immunizations in their confined clinics.
Since 1990, solar adsorption refrigeration technology has piqued research interests, due to its cleanness, low cost, and ease of application in air-conditioning, ice-making, food preservation, and vaccine storage. This technology utilizes the reversible physical adsorption of steam on the porous solid surface [2].
The intermittent solar adsorption icemaker is an attractive application composed of adsorption beds. During the day, an adsorption reactor is added to a solar collector to absorb and desorb materials. At night, when the refrigerant returns from the evaporator, the adsorbent takes effect to lower the temperature, and may produce several ice cubes [3].
The interesting application for this is the adsorbent bed-based sporadic adsorptive solar ice maker. In the present time, an adsorptive reactor synchronizes inside a solar-dependent collector for the sorbent desorption substance. Adsorption, in the dark, takes place through the adsorbent once the refrigerant comes back from the evaporator, causing a chilling impact and transfer of a limited pieces of ice. The main emphasis of the research is to figure out the thermodynamic methods of a sporadic adsorption refrigerating system and to explore the impact of operational factors on the performance of the system. The impact of practical parameters on system performance, also, will be investigated prior to recommending a solar adsorption icemaker in the weather conditions of Holy Makkah, which affect the ozone layer of the Globe adversely and cause it to run out.
Pons and Guillemiont [4] carried out a numerical investigation on the pair of Activated Carbon/Methanol ice maker which solar-reliant powered. The collectors of solar energy (of area 6 m2) hold 130 kg of AC altogether, the condensers are cooled by air, and the evaporator generates from 30 kg to 35 kg of ice for each sunshiny day. This ice maker has a total net solar COP of about 0.12, establishing and putting it as one of the best effective producers of solar ice.
Boubakri et al. [5] conducted study in which they created solar ice producers dependent on the pair of activated carbon/methanol. The building of a particular part of the solar collector and condenser is the feature which differentiates them. Two prototypes, in Agadir city, Morocco, were examined under natural conditions and they performed very well. For extra than 60 percent of the days examined, every single unit possibly will produce extra than 4 kg/m2 of the manufactured ice.
Study conducted by Headley et al. [6] indicated that a solar collector of compound parabolic concentrating (CPC) of a ratio of concentration about 3.9 and a pore size of 2.0 m2 which was used to supply power to an icemaker through activated charcoal (carbon) adsorption and using the methanol as the working liquid. An amount of 2.5 kg of an imported adsorbent was used to fill a copper duct receiver of the compound parabolic concentrating CPC. A quantity of 1 kg of ice was produced when the heat of the evaporator reached 6℃ with a net solar coefficient of performance (COP) equal to 0.02 at a highest receiver heat of about 154℃.
A flat-plate collector of surface area of 0.92 square meters was investigated by Sumathy [7]. This collector was daily used to synthesize and amount of 4 to 5 kilograms of ice. It is similarly planned to get a combined system that comprises ice makers and solar water heaters. The overall performance of this system could be enhanced approximately 30% through using such technique utilizing recently generated technology. The highest heat of the receiver is about 154℃.
A model of an ice maker of a solar adsorptive is made by Boubakri et al. [8] who tested this model apply a pair of methanol-carbon. The packed portion of the collector-condenser is regarded as the major prominent different feature of such devices. The daily ice output sensitivity versus the vital unit physical parameters is investigated using this model to forecast the constrains of the flat plate collectors in the technology of collector-condenser.
A working pair of Methanol/activated carbon and a flat-plate solid-adsorption refrigeration ice maker simulated at a laboratory-scale was explored by Li et al. [9]. The laboratory findings indicated that the current system can generate an amount of 4 to 5 kg of ice of a surface area of 0.75 square meter after getting a radiation energy of 14 to 16 MJ, and produce an amount of 7 to 10 kg of ice when the surface area of 1.5 square meters after getting a radiation energy of 28 to30 MJ. After a period of time, Li et al. [9] made a no-valve, flat plate solar ice maker which performed excellently on system working tasks.
A glass tube with a combined condenser and evaporator at one end and generator (sorption bed) at the other end was produced by Khattab [10], in addition to a simple plane reflector structured for generator heating. The day-to-day ice output is ranging from 6.9 kg/m2 to 9.4 kg/m2, and the gross solar COP for hot and cold areas is 0.159 and 0.136, respectively.
A solar adsorption ice maker was tested by Luo et al. [11], applying the pair of activated carbon/methanol in the lacking the circuit valves of the refrigerant. The annual performance indicates that the coefficient of performance of the solar ice maker is ranging from 0.083 to 0.127, and its everyday ice output is from 3.2 kg/m2 to 6.5 kg/m2 when the everyday solar radiation is ranging from 16 MJ/m2 to 23 MJ/m2 and the medium a day-to-day ambient temperature is ranging from 7.7℃ to 21.1℃.
Within similar meteorological conditions, Li et al. [12] tested binary activated carbon/Methanol pair and one pair of activated carbon/ethanol combinations. For ice production, the activated carbon/methanol pair has supported to be one of binary working pairings which pass solar adsorption cooling.
An activated carbon/methanol prototype pair is studied by Ahmed and Abd-Latef [13] into which the adsorbent bed contained within and activated Carbon (AC-35) mixed with infinitesimal particles of copper Cu element and a reflector made of glass mirror, which enhanced heat transfer via the adsorbent bed. The investigation results indicated that ice daily production of about 1.38 kg ice/m2 to 3.25 kg ice/m2 when the solar coefficient of performance (COP) is vary from 0.07 to 0.11 when the ambient temperatures vary from 12.4 MJ/m2 to 25.2 MJ/m2. When the regeneration temperature rise from 90℃ to 120℃, this result in increasing of the condensate methanol from 0.4 liters to 1.4 liter. An ice maker powered by solar energy is prototyped by Santori et al. [14] which uses a pair of an activated carbon-methanol adsorption. Santori et al. revealed that the current prototype could produce an amount of 5 kg of ice and the solar Coefficient of Performance (COPs) is about 0.08 utilizing an exposed solar collector of 1.2 square meters.
Seven working pairs, compared by Allouhi et al. [15], which are intended to be used in the cooling systems of solar adsorption. The highest adsorption capability was revealed to be for the pair activated carbon fiber ACF-methanol, then the pair activated carbon AC/methanol and finally came the pair of activated carbon AC/ethanol. When the condenser temperature is about 25 C and the mass of the adsorbent is 20 kg in a combined system of collector-reactor, the pair silica gel/water for air cooling could accomplish Coefficient of Performance COP of about 0.3843, while the pair of the activated carbon fiber ACF/methanol for air cooling could achieve an amount of 0.1726 of Coefficient of Performance COP.
Four numerical case studies were carried out by Ambarita and Kawai [16] about of adsorption cycles power by solar energy utilizing flat-plate collectors, and generators filled with an adsorbate pair of activated alumina (AA)/activated carbon (AC) with different combinations of proportions of 100%/0%, 75%/25%, and 0%/100%, respectively. The findings shows that the average values of the Coefficient of Performance COP for the different proportions of the AA (100%, 75%, and 25%) as well as 100% activated carbon AC comes in the following order 0.054, 0.056, 0.06, and 0.074.
A numerical performance development of an adsorption solar cooling system, is studied by Chekirou et al. [17], applying the pair activated carbon AC/methanol with a solar collector of a flat type with three diverse types of glaze configurations. These three glaze configurations include single- and double-glaze covers, in addition to the transparent insulation material (TIM) cover. The values of the coefficient of performances COPs ranges from 0.136 to 0.198 for the single- and double-glaze covers and 0.14 to 0.36 for transparent insulation material (TIM) cover in daily-bases insolation of 26.12 MJ/m2 and a mean room temperature of about 27.7℃.
A practical adsorption bed, which built from a solar evacuated glass tube of a solar-tracking parabolic channel, is formed and tested by Du et al. [18] utilizing the vapor of water as a refrigerant medium. The condenser cooled by water has values of coefficient of performance COP ranging from 0.122 to 0.169, while the condenser cooled by air has a COP ranging from 0.98 to 0.115.
Islam and Morimoto [19] conducted a work in which they introduced a solar collector which is packed with methanol and granular activated carbon. The heat of the evaporator of the solar-adsorption cooling system decreased to 12°C (in a sunny day) and up to value of 0°C (in a cloudy day); whereas the value of the COPs is 0.12.
Ammar et al. [20] indicated that the optimal COP was 0.73, with 18740.5 kJ as the total energy input. It corresponds to a total daily ice production of 13.65 kg at 3℃ using the AC - methanol as pair. Hamrahi et al. [21] showed that Nano-activated carbon with various mass fractions increases the adsorption level. Thus, the addition of Nano-activated carbon with mass fractions of 4.7%, 11.1% and 18.3% to the adsorbent bed at 30 and 34℃ caused 11%, 21%, 33% and 17%, 23%, 25% increase in COP respectively which varies from 0.11 to 0.139. Chen et al. [22] experimental results showed that it was far from a linear relationship between the adsorption amount and the adsorption time. In the first 600 s, the adsorption rate was very high, and the bed temperature is sudden increased. Thus, can increase the experimental error measurements.
This research aims study the operative parameters' effect on the system's performance using pair of Ac-Methanol integrated with solar collectors. Moreover, improving the system's performance will be investigated by studying the constructive parameters' effect and then proposing a solar adsorption icemaker under Makah's climatic conditions.
In the solar physical adsorption system, the electrical compressor is substituted by a compressor which is powered thermally, that is the adsorption bed contained inside the reactor. The system consists of a solar field and a separated adsorption cycle, as shown in Figure 1.
Figure 1. Schematic diagram of separated solar adsorption cooling process
The solar field includes a solar collector connected to a reactor along with a heat-exchanger by a switched pump. It used thermal oil (Therminol 66), which works from 0℃ to 650 °K, convenient for ETC and parabolic trough collector [23]. Its specific heat ranges from 1.495 to 2.88 KJ/kg.K. During the day, the pump is running to flow heated thermal oil from the collector into the reactor to heat the refrigerant (adsorbate) while the pump is switched off during night. The adsorption cycle includes an adsorption reactor connected to a condenser that outlets to an expansion valve which expands the refrigerant into an evaporator that is considered as an icemaker.
2.1 Solar collectors
In the simulation, three types of collectors have been used to be compared to each other under the same conditions. It is considered a commercial type of flat-plate, evacuated-tube and parabolic-trough collectors. In Table 1 the technical specifications of three different collectors are presented.
Table 1. Solar collectors’ specifications
|
Parameter |
Flat plate collector [24] |
Evacuated tube collector (ETC) [25] |
Parabolic trough collector (PTC) [26] |
|
Optical efficiency rate (ho), % |
81.8 |
0.714 |
0.8 |
|
Heat losses rate k1, W/(m2K) |
3.29 |
0.763 |
0.008843 |
|
Heat losses rate k2, W/(m2.K2) |
0.0134 |
- |
0. 000506 |
2.2 Adsorption cycle description
The basic cycle of an adsorption machine is completed after four processes inside the bed as shown in Figure 2 as described in the following four stages [27].
Process 1-2: The isosteric heat adsorption process Cold production started in the state 1 (Ta, Pe) during the morning, and the reactor is kept apart from the evaporator and condenser together using the valves No. 1 and No. 3. The solar collector’s heat Qg results in a continuing surge in temperature and pressure at the similar highest adsorbate concentration inside the adsorbent (Xmax) to get to the state 2 (Pc, Tg).
Figure 2. Basic adsorption refrigeration diagram
Process 2-3: Isobaric heating process, which takes place at constant pressure. In this process the valve No. 1 is opened, letting the desorbed vapor, which flow from the adsorbent bed, to flow to the condenser. The reactor still to be heated by solar radiation. The pressure, throughout this phase, remains unchanged at Pc whereas the heat increases to state 3. (Pc, Tmax).
Process 3-4: isosteric cooling process during this process once valve No. 1 is locked, temperature and pressure drop at the similar least concentration of adsorbate inside the adsorbent (Xmin) which continue to arrive at the state 4 (Pe, Tads). After that the valve No. 2 is released, permitting the condensate, which come from the storage tank, to flow into the evaporator. Next, the valve No. 3 is released, permitting the vapor of the refrigerant (adsorbate) to pass inside the reactor.
Process 4-1: cooling by means of isobaric pressure process During this process the phenomenon of adsorption takes place at stable pressure and then the cooling production started. The process is finished once the temperature of the adsorbent surpasses Ta. This cycle of the process is done for the second time in the following day.
Assuming that both heat losses and pressure drop are ignored during the system connections. In the following subsections the governing equations of the adsorption bed are indicated [27].
3.1 Adsorption cycle
As indicated before it should estimate the adsorption ratio, X; it presents the adsorbent's ability to capture the refrigerant. Adsorption capacity (Xo) is an important criterion used to evaluate a working pair performance. An essential step to determine this parameter is studying the adsorbate's concentration variation in the adsorbent as a function of the temperature.
$x=x_0 \exp \left[-K\left(\frac{T}{T_{\text {sat }}}-1\right)^n\right]$ (1)
where, x0 is the highest rate of adsorption, K is a coefficient specified by the structure of the adsorbent and is disparate from the refrigerant, n is the adsorbent pore diameter distribution, and the Tsat is the Tc or Te; it relies on the pressure process.
The Xo has been used for the Activated Carbon (AC)/Methanol pair 0.450 where the coefficients of K=13.38 and n=1.50 in Eq. (1) as indicated in the study [28].
In the calculations, Tg1 is associated with Tc in the calculation process, and Te accompany with Ta2. The next formula might be generated via the D-A equation solution at the two sides of xa2:
$T_{g 1}=T_{a 2} \frac{T_c}{T_e}$ (2)
In the calculations, Tg2 is linked with Tc in the process of calculations, and Te is linked with Ta1. The next formula might be generated through the D-A equation solution at the two sides of $x g 2$ :
$T_{a 1}=T_{g 2} \frac{T_e}{T_c}$ (3)
The equation of Clausius-Clapeyron could be applied to compute the heat of desorption for physical adsorption:
$H_r=\frac{R \times A \times T}{T_C}$ (4)
where, T is the heat of adsorbent bed, Tc is the temperature of condensation, R represents the common gas constant, and A is the coefficient of Clausius-Clapeyron equation; its value is 4432 for the methanol as a refrigerant.
3.2 Thermal properties
The specific heat of Methanol in both liquid (Cm,l) and gas (Cm,g) phases are indicated as a function of Methanol temperature.
$C_{m, l}=0.78019+0.005862 T$ (5)
$C m, g=0.66+0.221 \times 10^{-2} T+0.807 \times 10^{-6} T^2$$-0.89 \times 10^{-9} T^3$ (6)
where, the specific heat of Activated Carbon (Cc) can be estimated as:
$C_c=0.805+00211 T$ (7)
The Latent heat of vaporization (Lm) of Methanol and the heat of condensation (L) are the same and can be calculated as:
$L_m=1252.43-1.59593 \mathrm{~T}-0.00881551 \mathrm{~T}^2$ (8)
In vaporization heat equation, the unit of temperature is in Celsius °C, whereas the unit of temperature used in extra calculations is in Kelvin.
3.3 Isosteric heating process
The heat (Qh) needed during the isosteric process can be estimated as:
$Q_h=\int_{T_{a 2}}^{T_{g 1}} C_c(T) M_{a c} d T+\int_{T_{a 2}}^{T_{g 1}} C_{m, l}(T) M_c x_{a 2} d T+$$\int_{T_{a 2}}^{T_{g 1}} C_{\text {madb }}(T) M_{\text {madb }} d T$ (9)
where, Cac(T) is the adsorbent's specific heat capacity; CLc(T) is the liquid refrigerant's specific heat capacity, Cmadb(T) is the metal's specific heat which is inside the adsorbent bed, Mac, Macxa2, and Mmadb are the adsorbent's mass, fluid refrigerant, adsorbent bed metal, respectively.; xa2 is the amount of adsorption of the adsorbent bed at the final state of adsorption process when the temperature is equal to Ta2. The initial section of the formula is the adsorbent's sensible heat, the next section is the refrigerant's sensible heat, and the final section is the metal's sensible heat which is inside the adsorbent bed.
3.4 Isobaric desorption process
The sensible and latent heats during the isobaric desorption process are expressed as Qd as:
$Q_d=\int_{T_{g 1}}^{T_{g 2}} C_{a c}(T) M_c d T+\int_{T_{g 1}}^{T_{g 2}} C_{m, l}(T) M_c x d T+$$\int_{T_{g 1}}^{T_{g 2}} C_{\text {madb }}(T) M_{\text {madb }} d T-\sum_{T_{g 1}}^{T_{g 2}} M_c h_d \frac{d x}{d T} d T$ (10)
where, the dx is negative in the process of desorption, hd is heat of desorption, x is the adsorbent bed's quantity of adsorption.
3.5 Heat addition (Solar radiation heat)
The needed heat to the bed is the summation of heat for both heating and desorption processes. Therefore, the heat that should be supplied by the solar collectors equals both isosteric heat (Qh) and desorption heat (Qd).
$Q_g=Q_h+Q_d=I_t A_c \eta_c$ (11)
where, Qg is solar radiation heat (kJ), It is total radiation per day (W/m2), Ac is the area (m2) collector, and ηc is the collector efficiency.
If the parabolic-trough collector is considered It is replaced by the beam radiation only. The collector efficiency according to Hottel-Whillier can be defined as a function of optical efficiency (h0), inlet fluid temperature (Ti) and outlet fluid temperature (To) [29].
$\eta_c=\eta_0-\frac{k_1\left(T_o-T_i\right)}{I_t}+\frac{k_2\left(T_o-T_i\right)^2}{I_t}$ (12)
where, k1 and k2 are the heat loss coefficients and they are obtained during the collector testing.
3.6 Evaporation energy
The heat of evaporation (Qevas) can be determined as:
Qevas $=M_c \Delta x\left[L_m\left(T_e\right)-\int_{T_e}^{T_c} C_{m, l} d t\right]$ (13)
where, Lm is the latent heat of vaporization of Methanol and Cm,l is the specific heat of liquid methanol.
3.7 System performance
The coefficient of performance (COP) can be used to evaluate both system and adsorption cycle. The system and cycle outputs are the same where the solar radiation is the system input energy while the heat added in the heating process is the cycle input energy.
COPsolar $=\frac{Q_{e v a s}}{Q_g}$ (14)
COPcycle $=\frac{Q_{\text {evas }}}{Q_h}$ (15)
The mass of ice (Mice) can be estimated by dividing the evaporation heat by sensible and latent heat of ice formulation.
$M_{i c e}=\frac{\text { Qevas }}{C_w\left(T_{w i}\right)+C_{i c e}\left(T_e\right)+L_{i c e}}$ (16)
where, Cw specific heat of water, Cice specific heat of ice and Lice latent heat of ice fusion.
3.8 Solar beam radiation
The variations between the overall radiation and the diffuse element are utilized to measure the beam radiation on a horizontal surface.
The beam radiation on a horizontal surface is calculated by the difference between the total radiation and the diffuse component.
$I_b=I-I_d$ (17)
The ratio of beam radiation (Rb) possibly will be applied to predict the beam radiation on a inclined surface, The ratio of beam radiation (Rb) is referred to as a ratio of incidence angle's cosine on a tilted surface (θ) divided by the incidence angle's cosine on a level surface (θz).
$R_b=\frac{\cos \theta}{\cos \theta_z}$ (18)
$\cos \theta=\cos \theta_z \cos \beta+\sin \theta_z \cos \left(\gamma_s-\gamma\right) \sin \beta$ (19)
The solar azimuth angle ($\gamma_s$), surface azimuth ($\gamma$) and the surface slope ($\beta$) are time and location dependent. The calculation of the beam radiation on the tilted surface (IbT) is done using the following equation:
$I_{b T}=I_b \cdot R_b$ (20)
And the reflected radiation (Ir) can be found as Ir=I.Rr where Rr is the ratio of the reflected radiation to the total radiation on the horizontal surface as a function of ground reflectance ($\rho_g$).
$R_r=0.5(1-\cos \beta) \cdot \rho_g$ (21)
Similarly, the diffuse radiation (IdT) can be calculated as IdT=Id.Rd Where Rd is the ratio of diffuse radiation divided by the total radiation on a horizontal surface.
$R_d=0.5(1+\cos \beta) \cdot \rho_g$ (22)
In conclusion, the tilted surface total radiation could be calculated using equation:
$I_T=I_{b T}+I_{d T}+I_r$ (23)
The above governing equations are solved together by MatLab programming to obtain the different variables depending on the input parameters. The input parameters are the daily solar radiation and daily average ambient temperature. The measured hourly weather data were summarized for Makkah city, 21.5 °N for ten years. The average hourly data were obtained as one year data. The daily solar radiation was estimated by summation day data where the daily average ambient temperature was estimated as arithmetic mean of daily data.
4.1 Validation of the numerical simulation
The present results are matched with the findings obtained by the researchers Qasem and El-Shaarawi [30] and Wang et al. [31]. The adsorbent bed measures working conditions, as shown in the following Table 2, is to confirm the numerical simulation. The performance results of the present investigation (as coefficient of performance and produced ice) are relatively comparable to the findings reached by Wang et al. and Qasem and El-Shaarawi. Accordingly, the code has been confirmed.
The Activated Carbon AC/Methanol pair is similarly be utilized for various cases with the equivalent measures of methanol and carbon masses of about 5kg to 28 kg, respectively. The further factors include n=1.39, k=10.21, and X0=0.284, as well. Tetra working cases are measured with the equivalent temperature of evaporation around -10 ºC, where the supplementary temperatures are varied reliant on the ambient temperatures under consideration. The mass of produced ice and the cycle COP are predicted for the tetra cases. The current system has a maximum COP and ice mass compared to other systems under the identical working and environmental conditions, compared to the two preceding works.
In Table 2, the numerical simulation results' validation comprises four cases in comparison with published results. In the first condition, the max cop reached 0.441 and is nearly the same of Qasem, and El-Shaarawi [30] whereas, in the second condition, the COP is higher than the present study by about 0.02 only. In the third condition, the present COP is the same as Qasem and El-Shaarawi [30] result, where it is increased by 0.016 comparing to Wang et al. result. The fourth condition is also nearly the same as the third condition. In summary the difference between present study and previous publication is up to 5% in all cases. That difference can be accepted depending on the assumptions of the different studies. That difference is due to the assumptions considered for each case and the heat losses of each system.
Table 2. Validation comparisons of the numerical simulation
|
|
Mc=28 kg, Mmadb=5 kg, X0=0.284, n=1.39 |
|||||||||||
|
Tiw, ℃ |
15 |
25 |
10 |
10 |
||||||||
|
Tc, ℃ |
25 |
35 |
20 |
15 |
||||||||
|
Te, ℃ |
10 |
10 |
10 |
10 |
||||||||
|
Ta2, ℃ |
23.7 |
31 |
19.6 |
19.5 |
||||||||
|
Tg2, ℃ |
93.6 |
100 |
86.6 |
84.9 |
||||||||
|
Literature |
Wang et al. |
Qasem and El-Sarawi |
Present |
Wang et al. |
Qasem and El-Sarawi |
Present |
Wang et al. |
Qasem and El-Sarawi |
Present |
Wang et al. |
Qasem and El-Sarawi |
Present |
|
COPcyc |
0.44 |
0.45 |
0.441 |
0.32 |
0.34 |
0.305 |
0.48 |
0.495 |
0.496 |
0.51 |
0.52 |
0.525 |
|
Mice, kg/2m2 |
6.3 |
6.29 |
6.57 |
3.05 |
2.96 |
3.09 |
7.9 |
7.86 |
8.2 |
8.7 |
8.67 |
9.09 |
4.2 Optimization of adsorption cycle
The solar ice-maker system optimization includes optimization of both system components and parameters. It includes the type of adsorbent (Carbon), mass of adsorbent (Carbon, Mc) with corresponding adsorbate (methanol) mass, and the collector area. Moreover, the condenser and evaporator's operating temperatures (Tc & Te) are studied to find the system's appropriate operating conditions under Makkah city's weather.
4.2.1 Activated carbon type
There are many types of Activated Carbon (AC), as shown in Table 3, and to choose the most appropriate type, the system performance should be studied for each type. The AC/methanol pair was investigated with four carbon types with methanol to get the best cycle COP. The types of activated carbon were studied under Te=-5℃; Tc=55℃; Mc=15 kg; material mass of adsorption bed, Mmadb=39 kg and outlet temperature for the collector To=85℃ to choose the most appropriate pair. Both COP and mass of ice are estimated for each type under Makkah weather. In the following sections, both solar and cycle COP are presented with the produced ice mass.
Table 3. Types of activated carbon considered
|
|
Type of AC |
Xo |
K |
n |
|
Carbon 1 |
YKAC (14-20 mesh), [32] |
0.450 |
13.38 |
1.5 |
|
Carbon 2 |
18#AC, [9] |
0.238 |
13.3 |
1.33 |
|
Carbon 3 |
YKAC, [33] |
0.284 |
10.21 |
1.39 |
|
Carbon 4 |
jiangxi809, [33] |
0.333 |
12.436 |
1.3 |
Figure 3 indicates the cycle cop of four types of activated carbon. The maximum cycle COP was found for the Carbon 1, which reached 0.349 under the same conditions of MAC=15 kg, Tc=55℃, Tg2=80℃, To=85℃, and Te=-5℃.
Figure 3. Cycle COP of different carbon types during the year
Figure 4 represents the mass of ice production for the same Activated carbon types. The mass of ice increases when the cooling capacity increases. The max ice produced for the Carbon-1 is the maximum that reached 10.7 kg.
Figure 4. Mass of ice production of different carbon types
As shown in Table 4, the Carbon-1 has given the max solar and cycle COP, so it will be considered as the most suitable type of activated carbon. Therefore, it is considered in the study, as indicated in the following sections.
Table 4. Comparison between the types of activated carbon adsorbent
|
Parameter |
Tc=55℃; Te=-5℃; Mc=15 kg, Tg2=80℃, To=85℃, Mmadb=39 Kg |
|
|
Type of carbon |
Max Mice (Kg) |
Max COP cyc |
|
Carbon-1 |
10.7 |
0.349 |
|
Carbon-2 |
4.7 |
0.29 |
|
Carbon-3 |
6.8 |
0.32 |
|
Carbon-4 |
6.5 |
0.31 |
4.2.2 Effect of evaporation temperature
Under the operating conditions of Tc=55℃; Mc=15 kg; Mmadb=39 kg and To=85℃ with changing the evaporation temperature, Te to be -5 and -10℃ to compare its effect on cycle COP and mass of ice. Carbon-1 is considered in this comparison. In Figure 5, the cycle COP showed an increase at Te =-5℃ that reached 0.349 rather than in the case of Te=-10℃ along the year. Actually, the difference between the two cases is little and is relatively constant along the year and it is about 0.015 as 4%.
Figure 5. Annual cycle COP for different evaporation temperatures
Figure 6. Annual ice production for different evaporation temperatures
The mass of ice is explained in Figure 6 at Te=-10℃, while the maximum mass of ice reached 9.1 kg, the minimum daily ice production is 6 kg. On the other hand, the maximum mass of ice reached 10.7 kg at Te=-5℃ where the minimum mass is about 7.6 kg. The difference of ice production between two cases is 1.6 kg daily. Perhaps at lower evaporator temperature much of ice should be produced but the evaporator hear rate at those temperatures is lowered. Therefore, at Te=-5℃ the evaporator heat is higher than that at Te=-10℃ and that causes to produce much more of ice.
The comparison results of changing evaporation temperature under fixed conditions showed that ice mass increased from 9.1 to 10.7 kg. The cycle also increased. The cycle COP increased from 0.336 to 0.349 that made the Te=-5℃ the best.
4.2.3 Effect of condensation temperature
At fixed conditions of Te=-5ºC, Mc=15 kg and Mmadb=39 kg the condensation temperature is changed to be 45, 50 and 55ºC to demonstrate its significance on the system performance. Figure 7 shows that the cycle cop yearly variation. As expected, the COP is affected by condensation temperature, and it reaches the maximum value at the condensation temperature of Tc=45℃, which it is 0.355.
Figure 7. Annual cycle COP of different condenser temperatures
As shown in Figure 8, the maximum mass of ice has an opposite effect with the condensation temperature, the max mass of ice reached 11 kg at Tc=45℃.
Figure 8. Annual ice production for different condenser temperatures
It is explained the results of the cycle and solar cop and mass of ice. There is a slight decrease in the mass of ice with increasing the condensation temperature. At lower condenser temperature, the cooling capacity is increased and then COP is improved. The maximum mass of ice is 11 kg at 45℃. The cycle cop varied from 0.349, 0.352 and 0.355 for 45℃, 50℃ and 55℃ respectively.
4.2.4 Effect of carbon mass and corresponding methanol mass
In this section, Tc=55℃; Te=-5℃; Mmadb=39 kg and (To=85℃) are fixed with changing the mass of Carbon 1 Mc to be 15, 20, 25 and 30 kg to compare the effect of Mc on cycle COP and mass of ice produced.
As illustrated in Figure 9, the Cycle COP is increasing while the mass of carbon is increasing. It can be seen that the maximum Cycle COP is 0.36 at Mc=30 kg.
Figure 9. Annual cycle COP for different carbon masses
In the research, the mass of ice is essential. The higher carbon mass allows more adsorption of refrigerants, which increases the energy of the evaporator. As shown in Figure 10, the mass of ice has an absolute correlation with carbon mass. When the mass of carbon increases, the mass of ice also increases. The maximum mass of ice was about 21.5 at maximum Mc.
Figure 10. Annual ice production for different carbon masses
The mass of ice, solar COP, and cycle COP are summarized in Table 5 showing a brief comparison of increasing the carbon's mass on the system under the same condition. It is showing that the highest ice production is 21.5 kg, and the best COP is 0.36. Those best conditions are obtained for the mass of Carbon of 30 kg.
Table 5. Effect of carbon's mass on cycle COP and mass of ice for Carbon 1
|
Parameter |
Tc=55℃, Te=-5℃, Tg2=80℃, To=85℃, Mmadb=39 Kg |
|||
|
Mc |
15 kg |
20 kg |
25 kg |
30 kg |
|
Maximum Mice (kg) |
10.7 |
14.3 |
17.9 |
21.5 |
|
Maximum COPcycle |
0.349 |
0.355 |
0.359 |
0.36 |
4.2.5 Effect of desorption temperature
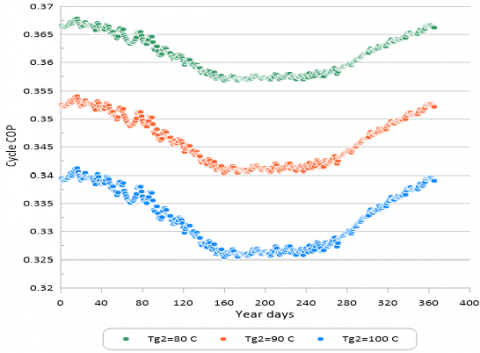
The maximum desorption temperature (Tg2) has been also studied for the optimum condition to see the effect on cycle COP. The cycle COP is estimated for three temperatures of 80, 90 and 100℃ as illustrated in Figure 11. The COP variation behavior is the same for the three temperatures and the COP difference between them is the same along the year. The minimum COP is obtained during the summer and the maximum one is found during the winter. As shown in Figure 11, the cycle COP at higher desorption temperature of 100℃ gives a lowest cycle COP which is 0.34 where at 90℃ it reaches 0.354. The best cycle COP is found at tg2=80℃ with 0.367 value.
Figure 11. Effect of Tg2 on the cycle COP at optimum condition
4.2.6 Annual performance of optimum adsorption cycle
Many conditions have been studied with changing Te, Tc, Tg2 and Mc. The optimum conditions obtained from the above subsections can be summarized as follows: Mc=30 kg, Te=-5℃, Tc=45℃, Tg2=80℃ and To=85℃. Under the optimum conditions the COP and ice mass are estimated annually to illustrate the annual performance of the adsorption cycle. In Figure 12 the daily COP is presented, and it is varied from 0.357 in summer as a minimum value to 0.368 in winter as a maximum value. That proves the significance of the ambient temperature on the COP. In summer while the ambient temperature is high and that causes much more heat gain in the evaporator and decreases the ice production. In addition, high ambient temperature reduces condensation in the condenser and that causes the evaporation inside the evaporator.
Figure 12. Cycle cop at optimum condition
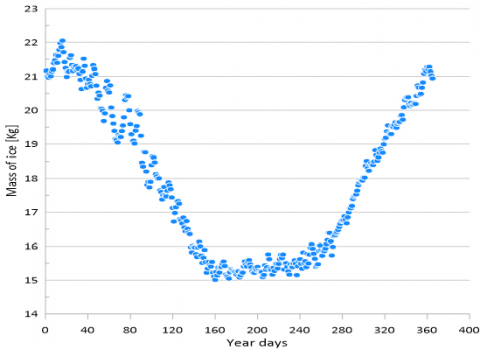
The daily produced ice is estimated annually under optimum working conditions and is presented in Figure 13. The minimum value of daily ice production is found as 15 kg in summer where the ambient temperature is high as indicated above. The daily mass of ice produced in Figure 13 indicates that the maximum mass of ice along the year is 22 kg in winter where low ambient temperature is found. Whereas the day length in winter is shorter than in summer but that does not cause much more ice production due to high ambient temperature.
Figure 13. Mass of ice at optimum conditions
4.3 Optimization of solar system
4.3.1 Solar radiation
The incident solar radiation on the collector surface is estimated. The flat-plate and ETC are fixed and titled into the south direction. The titled angle equals to the latitude angle which it is 21.5°. In the case of parabolic-trough collector the collector is one-dimensional North-South tracking. In that case the surface azimuth angle is only changed while the collector is a horizontal surface. Resulting beam and total radiation on 21.5° (latitude of Makkah city) are summarized daily, and they are illustrated in Figure 14 for each day along the year. The data is collected every 24 hours (each day) from hourly data.
Figure 14. Annual daily global and beam radiation incident on the collector surface
The total daily radiation ranges from 4 to 6 kWh/m2/d, and that value is encouraged to utilize solar thermal energy. The daily beam radiation for a one-dimensional tracking surface is not far different from these values, it is ranged around 4 kWh/m2/d. In general, the yearly variation of beam radiation is similar to the global radiation. While it is lowering in the winter season, it is maximized in both Spring and Autumn. Sometime, the solar radiation is lowering than other days in the same season and that is because there are cloudy days. The beam radiation is approximately 60% of total radiation as expected. The big difference between the global and beam radiation is found during the summer season and that is due to fog weather that is obtain during that season. That fact of high beam radiation provides a reality to use parabolic trough collectors.
4.3.2 Performance comparison of solar collectors
The daily efficiency of flat plate collector's, ETC, and parabolic trough have been calculated under Makkah weather. The fluid used in the collector is thermal oil (Therminol 66), which can endure until 650 k. As discussed before the optimum inlet temperature to the adsorption bed (collector outlet temperature) (To) was obtained to be 358 K. Under those conditions and technical properties of the collectors, the collector efficiency is estimated as presented in Figure 15. The collector efficiency is maximized during the summer, where both the solar radiation and ambient temperature are maximized.
This graph shows the variation in collector efficiency during the year, which is affected by the solar radiation while the outlet temperature is constant. The parabolic trough has the maximum efficiency among them. There is a slight change in parabolic efficiency during the year, which is nearly 80%, where the ETC efficiency is faced minor changes throughout the year. In contrast, the flat plate collector in the same period has a considerable difference in the efficiency between the summer and winter.
Figure 15. Efficiency variation of flat-plate, ETC, and parabolic trough collector under Makkah city weather during the year
As shown in Figure 14, the highest efficiency is 80% for flat-plate because of its ability to provide high efficiency at high temperatures. The ETC also provided the lowest efficiency throughout the year of 71%. The efficiency of the parabolic-trough collector is also high, it reached 79%.
4.3.3 Optimum solar collector area
The three types of collectors have been considered after calculating the collectors' efficiency to find the collector area that depends on the generated energy. Under the optimum conditions, Figure 16 indicates the collector's area during the year. The three types of collectors have been put understudy to calculate the collector's size at specific energy input. The optimum area of the collector has been calculated. It depends on the amount of solar energy (Qg) that can run the adsorption cycle by generating the generated energy (Qh). Solar energy depends on the solar radiation and collector area, while the generated energy depends on the sensible and desorption heat. The reactor's generated energy has been equalized with solar energy to calculate the optimum collector area that satisfies the required energy to gain sensible and desorption heat.
Figure 16. Area of the collector need with solar energy input during the year
The collector area results are shown in Table 6; the optimum collector's area for the flat-plate collector is 3.15 m2. The optimum area of the ETC reached 3.5 m2 and it is found 8.4 m2 for the parabolic trough collector.
Table 6. Optimum area of the collector needed
|
Collector type |
Optimum area |
|
Flat-plate |
3.15 |
|
ETC |
3.50 |
|
Parabolic trough |
8.4 |
4.3.4 Optimum system sizing and performance
The number of collectors needed are estimated depending on the optimum area with corresponding collector area and collector efficiency. As shown in Table 7, the required number of flat-plate collectors is found to be two while it is found as three collectors for ETC and the parabolic went to 11 collectors. The solar COP is estimated for the optimum collector area and optimum working conditions. The annual maximum COP of each collector is found as shown in Table 7. The maximum solar COP is found for the parabolic-trough collector as 0.26 where the minimum one is illustrated for the ETC as 0.19. The flat-plate collector has the maximum solar COP as 0.20 along the year.
Table 7. Number of collector and solar COP under the optimum condition
|
Type of collector |
Collector area |
No. of collectors needed |
Max. solar COP |
|
Flat plate |
2.11 |
2 |
0.20 |
|
ETC |
1.5 |
3 |
0.19 |
|
Parabolic trough |
0.806 |
11 |
0.26 |
In this study, the operating and performance parameters of a solar thermal powdered activated carbon/methanol adsorption ice-maker system are presented using the thermodynamic analysis and weather data of Makkah, 21 °N. The thermodynamic analysis gives a primary vision of predicting the performance while the modeling under Makkah climate conditions presents the solar ice-maker system actual performance that strongly depends on local climate conditions.
Thermodynamic numerical modeling indicates that the optimal results of COP can be obtained with YKAC (14-20 MESH) activated carbon (AC). The mass of AC has been studied with 15, 20, 25, and 30 kg. It was found that the best cycle reached 0.36 at 30 kg of carbon mass and the maximum daily mass of ice was 21.5 kg. The condensation and evaporation temperatures were also studied. It was found that both maximum daily mass of ice and maximum COP were found at 45℃ and -5℃ respectively. Moreover, it was found that the optimum generation temperature is about 80℃. A comparison between the flat plate, ETC, and the parabolic trough collectors was developed. It showed that the flat-plate collector has the maximum annual efficiency of 0.80 at 3.15 m2 of collector area where the parabolic trough efficiency reached 0.79 at collector area of 8.4 m2. The ETC has the minimum efficiency that reached 0.71 at 3.5 m2 collector area.
Finally, the results show that the system can produce 22 kg per quadratic meter collector daily and solar and cycle COP 0.26, 0.367 respectively. It is believed that this study forms a basic guideline for constructing a good solar adsorption icemaker that will be operating for remote areas.
This research is supported by Umm Al-Qura University (UQU), the Deanship of Scientific Research under a Grant Code of 22UQU4290448DSR02 and that should be acknowledged.
[1] Punem, S. (2008). EE IIT, Kharagpur, India 2008 4O Lessons on refrigeration and air conditioning from IIT Kharagpur. Useful training material for mechanical engineering students/college, or as reference for engineer. https://www.academia.edu/4892513/EE_IIT_Kharagpur_India_2008_4O_LESSONS_ON_REFRIGERATION_AND_AIR_CONDITIONING_FROM_IIT_KHARAGPUR_USEFUL_TRAINING_MATERIAL_FOR_MECHANICAL_ENGINEERING_STUDENTS_COLLEGE_OR_AS_REFERENCE_FOR_ENGINEER, accessed on 28 July 2022.
[2] Dieng, A.O., Wang, R.Z. (2001). Literature review on solar adsorption technologies for ice-making and air-conditioning purposes and recent developments in solar technology. Renewable and Sustainable Energy Reviews, 5(4): 313-342. https://doi.org/10.1016/S1364-0321(01)00004-1
[3] Odesola, I., Adebayo, J. (2010). Solar adsorption technologies for ice-making and recent Developments in solar technologies: A review. International Journal of Advanced Engineering and Technolology, 1(3): 284-303.
[4] Pons, M., Guilleminot, J.J. (1986). Design of an experimental solar-powered, solid-adsorption ice maker. Journal of Solar Energy Engineering, 108(4): 332-337. https://doi.org/10.1115/1.3268115
[5] Boubakri, A., Arsalane, M., Yous, B., Ali-Moussa, L., Pons, M., Meunier, F., Guilleminot, J.J. (1992). Experimental study of adsorptive solar-powered ice makers in Agadir (Morocco)—1. Performance in actual site. Renewable Energy, 2(1): 7-13. https://doi.org/10.1016/0960-1481(92)90054-7
[6] Headley, O.S., Kothdiwala, A.F., McDoom, I.A. (1994). Charcoal-methanol adsorption refrigerator powered by a compound parabolic concentrating solar collector. Solar Energy, 53(2): 191-197. https://doi.org/10.1016/0038-092X(94)90481-2
[7] Sutnathy, K. (2002). An efficient solar ice maker. https://www.eng.uc.edu/~beaucag/Classes/SolarPowerForAfrica/Homeworks/Homework%203/An%20Energy%20Efficient%20Solar%20Ice-Maker.pdf.
[8] Boubakri, A., Guilleminot, J.J., Meunier, F. (2000). Adsorptive solar powered ice maker: Experiments and model. Solar Energy, 69(3): 249-263. https://doi.org/10.1016/S0038-092X(00)00063-3
[9] Li, M., Wang, R.Z., Xu, Y.X., Wu, J.Y., Dieng, A.O. (2002). Experimental study on dynamic performance analysis of a flat-plate solar solid-adsorption refrigeration for ice maker. Renewable Energy, 27(2): 211-221. https://doi.org/10.1016/S0960-1481(01)00188-4
[10] Khattab, N.M. (2004). A novel solar-powered adsorption refrigeration module. Applied Thermal Engineering, 24(17-18): 2747-2760. https://doi.org/10.1016/j.applthermaleng.2004.04.001
[11] Luo, H.L., Dai, Y.J., Wang, R.Z., Tang, R., Li, M. (2005). Year round test of a solar adsorption ice maker in Kunming, China. Energy Conversion and Management, 46(13-14): 2032-2041. https://doi.org/10.1016/j.enconman.2004.10.019
[12] Li, M., Huang, H.B., Wang, R.Z., Wang, L.L., Cai, W.D., Yang, W.M. (2004). Experimental study on adsorbent of activated carbon with refrigerant of methanol and ethanol for solar ice maker. Renewable Energy, 29(15): 2235-2244. https://doi.org/10.1016/j.renene.2004.04.006
[13] Ahmed, M.H., Abd-Latef, M. (2012). Experimental study for the performance of modified solar ice maker. J App Sci Res, 8(8): 4645e55.
[14] Santori, G., Santamaria, S., Sapienza, A., Brandani, S., Freni, A. (2014). A stand-alone solar adsorption refrigerator for humanitarian aid. Solar Energy, 100: 172-178. https://doi.org/10.1016/j.solener.2013.12.012
[15] Allouhi, A., Kousksou, T., Jamil, A., El Rhafiki, T., Mourad, Y., Zeraouli, Y. (2015). Optimal working pairs for solar adsorption cooling applications. Energy, 79: 235-247. https://doi.org/10.1016/j.energy.2014.11.010
[16] Ambarita, H., Kawai, H. (2016). Experimental study on solar-powered adsorption refrigeration cycle with activated alumina and activated carbon as adsorbent. Case Studies in Thermal Engineering, 7: 36-46. https://doi.org/10.1016/j.csite.2016.01.006
[17] Chekirou, W., Boukheit, N., Karaali, A. (2016). Performance improvement of adsorption solar cooling system. International Journal of Hydrogen Energy, 41(17): 7169-7174. https://doi.org/10.1016/j.ijhydene.2016.02.140
[18] Du, S.W., Li, X.H., Yuan, Z.X., Du, C.X., Wang, W.C., Liu, Z.B. (2016). Performance of solar adsorption refrigeration in system of SAPO-34 and ZSM-5 zeolite. Solar Energy, 138: 98-104. https://doi.org/10.1016/j.solener.2016.09.015
[19] Islam, M.P., Morimoto, T. (2016). Thermodynamic performances of a solar driven adsorption system. Solar Energy, 139: 266-277. https://doi.org/10.1016/j.solener.2016.09.003
[20] Ammar, M.H., Benhaoua, B., Bouras, F. (2017). Thermodynamic analysis and performance of an adsorption refrigeration system driven by solar collector. Applied Thermal Engineering, 112: 1289-1296. https://doi.org/10.1016/j.applthermaleng.2016.09.119
[21] Hamrahi, S.E., Goudarzi, K., Yaghoubi, M. (2018). Experimental study of the performance of a continues solar adsorption chiller using Nano-activated carbon/methanol as working pair. Solar Energy, 173: 920-927. https://doi.org/10.1016/j.solener.2018.08.030
[22] Chen, Q.F., Du, S.W., Yuan, Z.X., Sun, T.B., Li, Y.X. (2018). Experimental study on performance change with time of solar adsorption refrigeration system. Applied Thermal Engineering, 138: 386-393. https://doi.org/10.1016/j.applthermaleng.2018.04.061
[23] https://www.therminol.com, accessed on 28 May 2022.
[24] https://www.centrometal.hr, accessed on 28 May 2022.
[25] https://www.apricus.com, accessed on 28 May 2022.
[26] Tzivanidis, C., Bellos, E., Korres, D., Antonopoulos, K.A., Mitsopoulos, G. (2015). Thermal and optical efficiency investigation of a parabolic trough collector. Case Studies in Thermal Engineering, 6: 226-237. https://doi.org/10.1016/j.csite.2015.10.005
[27] Wang, R., Wang, L., Wu, J. (2014). Adsorption Refrigeration Technology: Theory and Application. John Wiley & Sons.
[28] Li, X.R., Wu, J., Wang, R.Z., Xu, Y., Wang, S.G. (2003). Experimental study of a solidified activated carbon-methanol adsorption ice maker. Applied Thermal Engineering, 23(12): 1453-1462. https://doi.org/10.1016/S1359-4311(03)00103-0
[29] Duffie, J.A., Beckman, W.A., Blair, N. (2020). Solar Engineering of Thermal Processes, Photovoltaics and Wind. John Wiley & Sons.
[30] Qasem, N.A., El-Shaarawi, M.A. (2013). Improving ice productivity and performance for an activated carbon/methanol solar adsorption ice-maker. Solar Energy, 98: 523-542. https://doi.org/10.1016/j.solener.2013.10.018
[31] Wang, R.Z., Li, M., Xu, Y.X., Wu, J.Y. (2000). An energy efficient hybrid system of solar powered water heater and adsorption ice maker. Solar Energy, 68(2): 189-195. https://doi.org/10.1016/S0038-092X(99)00062-6
[32] Leite, A.P.F., Daguenet, M. (2000). Performance of a new solid adsorption ice maker with solar energy regeneration. Energy Conversion and Management, 41(15): 1625-1647. https://doi.org/10.1016/S0196-8904(00)00011-X
[33] Wang, R.Z., Wang, L.W., Wu, J.Y. (2014). Adsorption Refrigeration Technology: Theory and Application. Somerset, NJ, USA: Wiley, 2014.