Emad Toma Karash* | Jamal Nayief Sultan | Majid Khaleel Najem | Amenah Faris Hamid
© 2022 IIETA. This article is published by IIETA and is licensed under the CC BY 4.0 license (http://creativecommons.org/licenses/by/4.0/).
OPEN ACCESS
Aluminum is one of the most commonly used alloys in industrial applications due to its significant qualities such as resistance to wear, high hardness resistance, and high conductivity. This study will concentrate on the hardness resistance of two dissimilar aluminum alloys at different rotational and travel velocities, where the behavior of the alloys' hardness resistance will be studied after the welding process, from the welding center to the alloys' edges, and this will be done in three areas. Due to temperature changes at the weld in these three separate regions, the first area was at the start of the welding process, the second in the midst of the model, and the third area was at the conclusion of the welding process, to examine the influence of temperature on the hardness resistance. The results showed that increasing the travel velocity of the feed cart and keeping the rotational velocity constant increased the hardness resistance, whereas increasing the rotary tool velocity and keeping the travel velocity of the feeding cart constant decreased the hardness resistance of the two welded alloys. The maximum hardness resistance recorded in the model's welding center (3-3) and its value were more than (49.47 percent) the lowest hardness resistance recorded for all models, which was for the model (7-1).
rotational velocity, travel velocity, aluminum alloys, friction stir welding, hardness
Friction fusion welding is mainly used as a commercial process in industrialized countries, widely used in aviation, aerospace, ships, automobiles, pipe welding and other industrial fields, and its significance is embodied in the ability to weld many materials, particularly dissimilar materials that differ in their chemical, thermal, and mechanical properties and are difficult to weld using conventional methods, in addition to the velocity with which the connections are completed. Significantly low cost and high quality in connecting parts together [1, 2].
The procedure of friction stirs welding AA-6061 with a thickness of (3 mm) was investigated. The effectiveness of each instrument's shape was assessed using a welding tool with various teeth, one grooved and one smooth. When employing a rotational velocity of 1800 rpm and a travel velocity of 50 mm/min, the findings exposed that the tensile strength of a grooved tooth was greater than that of a smooth tooth. When compared to utilizing a smooth tooth, employing a grooved tooth enhanced the rate of heat transmission and reduced weld flaws [3].
The hardness of aluminum alloy AA-6061-T6 its thickness (6 mm), welded by friction stir welding with a cylindrical tooth and tapering tool of (5 mm) in diameter and a tool shoulder of (20 mm) in diameter was investigated. The rotating velocity of the welding tool was varied (1030, 1500) rpm. The HRB hardness test findings revealed that the hardness values at 1030 rpm are greater than those at 1500 rpm [4].
The impact of the cooling medium (water with lubricating oil) and vibration on aluminum alloy 5083 during the friction stir welding process was investigated at a welding tool rotational velocity of (1250 rpm) and a travel velocity of (90 mm/min). The welded samples performed well in the FSVW vibration system with water cooling. It was determined that the particle size dropped to (13%) of the base metal, with an improvement in mechanical characteristics and enhanced efficiency from 66 to 87 percent, and an increase in hardness HV from 50 to 78 percent [5]. The hardness and microstructure of aluminum alloy AA7020-O welded by stir welding at (1000, 1225, 1400) rotations per minute and a travel velocity of (20,40,60) mm/sec were investigated. The findings revealed that when the rotating velocity was reduced, the hardness increased [6].
Aluminum alloys AA5052 and AA7075-T6 were welded with a thickness of (3 mm) utilizing FSP friction processing and reverse stirred welding RFSP treatment at rotating velocities of (1500,1000,710 rpm) and a single travel velocity of (60 mm/min).
The results show that the friction noise treatment and the reverse fuss treatment from friction stir welding yielded greater hardness values for the welded sample's NZ area [7].
Friction stirs welding two aluminum alloys (AW-6082-T651 and AW-5083-H111) with three welding tool rotational velocities (1400, 1000, 710 rpm) and three welding tools of various diameters (16, 20, 24) mm and three travel velocities (160, 112, 56 mm/min). The samples with the highest tensile strength had a trip velocity of (160 mm/min), whereas the samples with the lowest tensile strength had a travel velocity of (56 mm/min). It was also discovered that increasing the diameter of the tool with travel velocity increased the hardness in the welding zones [8]. The welding treatments impact of welded aluminum alloy (AA6061-T651) and semi-rigid metal (SSM) 356-T6 was tested at welding velocities of (1750, 2000 rpm), and trolley travel velocities of (20,50,80,120,160,200 mm/min). The tensile test results revealed that increasing rotational velocity has less of an effect on the tensile strength of semi-hard metal (SSM) than decreasing rotational velocity. It was also discovered that the welding center hardness was higher from (TMAZ) and the hardness of all areas was lower than the base material [9]. The structural and mechanical properties of welding areas were investigated using friction stir welding of AA-7075-T6 with a thickness of (6.5 mm) and aluminum alloy AA-2024-O with a thickness of (5 mm), with a welding tool rotation velocity of (1000 rpm) and a trolley travel velocity of (80 mm / min). The results revealed that the welding resistance was smaller than the base material due to the difference in alloy thickness, and a partial ductile fracture formed in the welding block [10]. The effect of welding parameters of aluminum alloys (AA2024-O, AA7075-T73) on the stir welding process was studied using SN ratio and ANOVA analysis with a rotational velocity of the welding tool (898, 1200, 1710 rpm), a travel velocity of the trolley (20, 45, 69 mm/min) with tilt angle welding tool, welding tool tooth shape (cylindrical, conical, threaded cylindrical). The best results were obtained when the rotating velocity was 898 revolutions per minute, the travel velocity was (45 mm /min), and the tooth form was threaded cylindrical. Hardness values were observed to be lower in TMAZ and HAZ regions than in SZ regions [11].
This study hardness measurements revealed that the (HAZ) region is soft and the (SZ) region is harder than the (BM) region [12].
The procedure of friction stirs welding aluminum alloy AA6061, with a thickness (3 mm) was investigated. The effectiveness of each instrument's shape was determined by utilizing welding tools with differing teeth, one grooved and one smooth. When the rotational velocity was (1800 rpm) and the travel velocity was (50 mm/min), the tensile strength of a grooved tooth was greater than that of a smooth tooth. When compared to utilizing a smooth tooth, employing a grooved tooth enhanced the velocity of heat transmission and reduced weld flaws [13]. The hardness of aluminum alloy AA-6061-T6 welded by friction stir welding with a cylindrical tooth and tapering tool, with a diameter (5 mm) and the tool shoulder with a diameter of (20 mm). Different welding tool rotational rates (1030, 1500) rpm were employed. The HRB hardness test findings revealed that a hardness velocity of (1030 rpm) was faster than a velocity of (1500 rpm) [14]. The influence of the cooling medium (water with lubricating oil) and vibration during the friction stir welding process on aluminum alloy 5083 was reported at a welding tool rotational velocity of (1250 rpm) and a travel velocity of (90 mm / min). The welded sample results showed good results using the FSVW vibration system with water cooling, and the particle size decreased to 13% of the base metal, with an improvement in mechanical properties and detailed efficiency increased from 66 to 87 percent, and the hardness HV increased from 50 to 78 [15].
The hardness and microstructure of aluminum alloy AA7020-O welded by stir welding at (1000, 1225, 1400) rotations per minute and a travel velocity of (20, 40, 60) mm/sec were investigated. The results revealed that when the rotational velocity reduced, the hardness rose while the travel velocity decreased [16]. For the NZ area of the welded sample, higher hardness values were found for the friction noise treatment and the reverse fuss treatment from friction stir welding [17]. The hardness in the middle of the welding zones rises as the diameter of the tool grows with travel velocity [18].
It was discovered that the hardness of the welding center was higher than that of TMAZ, but the hardness of other regions was lower than that of the base material [19].
Through the use of SN ratio and ANOVA analysis, the effect of welding parameters of aluminum alloys AA2024-O, AA7075-T73 on the process of stir welding were studied with a rotational velocity of the welding tool (898, 1200, 1710 rpm), a travel velocity of the trolley (20, 45, 69 mm/min), and a tilt angle of the welding tool tooth shape (cylindrical, conical, threaded cylindrical). The best results were obtained when the rotating velocity was (898 rpm), the travel velocity was 45 mm per minute, and the tooth form was threaded cylindrical. The hardness in TMAZ and HAZ regions was found to be lower than in SZ regions [20].
The hardness findings revealed that the HAZ region has a lower hardness than the BM region and that the SZ region has a greater hardness than the BM region [21].
In addition to a large number of studies on friction stir welding for aluminum, and taking many variables such as the type of welding tool, the rotational velocity of the welding and the travel velocity of the welding, and heating the welding tool before starting the welding process, and other variables, in order to determine the effect on mechanical qualities for welding cutting, many of which focus on resistance hardness [22-30]. The hardness resistance of aluminum alloys welded by friction stir welding method will be studied in different areas of the surface of the two welded dissimilar alloys, the first at the beginning of the welding process, the second in the middle of the model, and the third at the end of the welding area, where the temperatures differ in the welding center in these three areas when performing the welding process.
This study is unique in that it will illustrates the influence of temperatures on the welded alloy, as well as the effect of temperature change on the hardness resistance of welded components, at varied rotation velocities of the welding tool, different feed travel velocities, and in different sections of the alloy surface. The rest of this article is structured as follows: Section 2 contains the experimental work, Section 3 has the results and discussion, and Section 4 contains the conclusions, acknowledgements, and references.
The Vickers technique was used to conduct micro hardness tests on all models in three lines and three separate areas to determine the influence of temperature change on hardness. For hardness testing on friction welding reigns, a load of (400 gm) was used. The microscopic hardness Vickers digital equipment from a German business, (Zwick type. / Roell Z HV Vickers's), was employed, with a pyramidal diamond indenter with an angle (130°) and a load remaining on the sample for a time of (15 sec). The time period was calculated using a digital clock, and then utilized the device's digital screen to compute the size of the effect originating from the axial and two perpendicular directions.
2.1 Materials used
Heat treated aluminum alloys (AA-2024 – O & AA-7075-T6) sheets were used as a metal base. Table 1 appears the chemical composition of dissimilar aluminum alloys with the international standard ratios values adoted by the European Aluminum Association (EAA). Table 2 appears a mechanical properties of dissimilar aluminum alloys with the international standard values according to the American specifications (ASTM E 3-01).
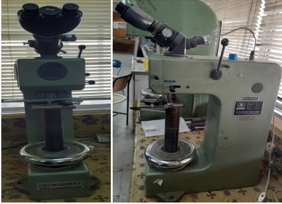
Figure 1. The hardness tester used in the test
2.2 Hardness test
Penetration or scratching on the sample to be tested for its hardness was adopted. The penetration tool was a quadrilateral pyramid of diamonds at an angle of (136°), and the loads used to measure the hardness range from (1 to 120 kg). Processes required to prepare samples for hardness testing including grinding, polishing, finishing and surface cleaning of impurities were carried out to ensure an accurate reading. (Al2O3) solution with water was used for polished samples surfaces. The solution was paste on a piece of cloth and conduct the polishing process in a universal polisher device,then wash the sample with water, to be ready for microscopic examination. The hardness was then tested using a Vickers hardness tester, Figure 1.
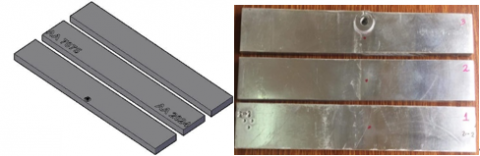
Then the samples was cut by the vertical milling machine with equal distances to be able to put it on the hardness tester device as shown in the Figure 2.
Figure 2. Specimens appear after they have been cut and used for hardness testing
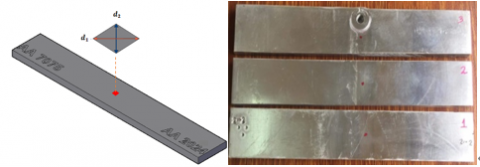
The sample was examined from its middle by applying a load of (1 kg). After scratching the sample with an indenter tool, the hardness tool leaves a hierarchical trace on the sample as shown in the Figure 3.
Figure 3. The hardness tester used in the test
The value of (d) was calculated from the following Eq. (1) [34].
$d=\frac{d_1+d_2}{2}$ (1)
Then the hardness ( $H . V$ ) was calculated from the equation (2):
$H . V=1.854 \frac{P}{d^2}$ (2)
$d=$ mean dimeter $(\mu m) \div 1000=m m$
$P=\operatorname{load}(K g)$
$H . V=$ Vichers hardness (without unit)
Table 1. The chemical composition of dissimilar aluminum alloys
|
Elements |
Zn% |
Si% |
Fe% |
Cu% |
Mn% |
Mg% |
Cr% |
Ti% |
Al% |
|
Materials |
|||||||||
|
Nominal value AA-2024 – O [32] |
0.21-0.25 |
0.33-0.5 |
0.41-0.5 |
3.8-4.9 |
0.3-0.9 |
1.2-1.8 |
0.08-0.1 |
0.13-0.25 |
Rem. |
|
Actual value |
0.24 |
0.41 |
0.48 |
4.2 |
0.51 |
1.59 |
0.08 |
0.17 |
92.32 |
|
Nominal value AA-7075 – T6 [33] |
5.1-6.1 |
0.4-1.5 |
0.5 |
1.2-2 |
0.3 |
2.1-2.9 |
0.18-0.28 |
0.2 |
Rem. |
|
Actual value |
5.15 |
1.25 |
0.14 |
1.7 |
0.26 |
2.55 |
0.21 |
0.17 |
88.57 |
Table 2. The mechanical properties of dissimilar aluminum alloys
|
Aluminum Alloy |
Density, Kg/m3 |
Tensile Yield Strength, MPa |
Ultimate Tensile Strength MPa |
% EL |
Modulus of Elasticity, GPa |
Shear modulus, Gpa |
Hardness, Vickers |
Hardness, Brinell |
Passion’s ratio, μ |
|
Nominal value, AA- 2024-O [32] |
2780 |
345 |
483 |
10 |
73.1 |
28 |
56 |
46 |
0.33 |
|
Actual value |
2780 |
95 |
220 |
12 |
73.1 |
28 |
57 |
47 |
0.33 |
|
Nominal value, AA-7075 – T6 [33] |
2810 |
503 |
572 |
5 |
71.7 |
26.9 |
175 |
150 |
0.33 |
|
Actual value |
2840 |
501 |
570 |
5 |
71.72 |
26.9 |
177 |
153 |
0.33 |
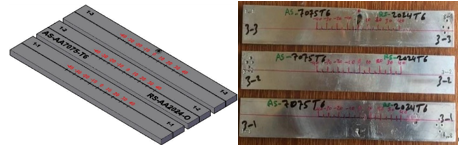
For each model the examination process was completed for the three parts of the sample in three different regions, Figure 4.
Figure 4. Appears the locations where the hardness resistance was measured for each model
Figures 6 to 11 show the results of the hardness test of welds in different welding areas and at different rotational and travel velocities, and the results showed that the greatest values of hardness were found in the center of the welding zone (NZ) compared with the other welding points, but it is less than the hardness of the base metal. The reason for this is that the size of the grains in this area is smaller than the size of the grains of the base metal, because the grains in this area have become re-smoothing, which increases the hardness of the metal. The reason for the low hardness in the (TMAZ) area is that the generated heat amount during the process of friction stir welding in this area is sufficient to cause partial or complete melting of the precipitated particles. The lowest value of the hardness is in the (HAZ), which is the weakest, and then failure occurs when a tensile test is performed, and the hardness values are not uniform across the thickness of the welded plates, as the diagrams show, and the reason is that the heat distribution is uneven, as most of the heat generated is near the upper surface, which is in direct contact with the support of the welding tool, and accordingly the friction is greatest, while the lower surface it is in contact with the supporting piece that leaks most of the heat by the conduction method, and the high temperature forms coarse grains in the (HAZ) region, and accordingly the hardness decreases in this region [31]. The results of the data analysis were the following:
3.1 The effect of changing travel velocity on the resistance of hardness
In this section, the effect of changing the travel velocity of the welding cart on the strength of hardness will be studied. This is done by taking different travel velocities at each constant rotational velocity of the welding tool.
3.1.1 At a rotational velocity (1000 rpm) and a travel velocity (30, 40, 60 mm/min)
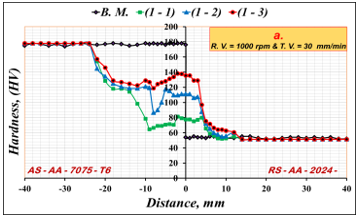
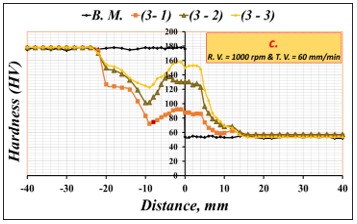
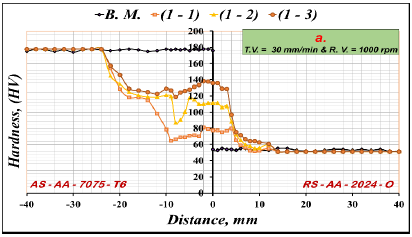
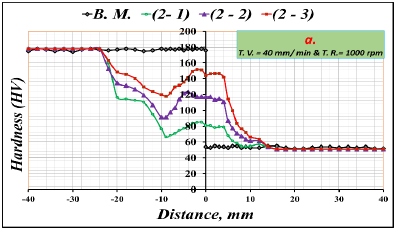
Figure 5 Appears the results of comparing the distance from the welding center with the resistance of the hardness, when changing the travel velocities of the welding carriage and fixing the rotational velocities of the conical pin tool, three regions were selected for each model, the first region at the beginning of the model, the second region in the middle of the model, and the third region at the end of the model Figure 4. Figure (5-a) Appears the results of a comparison between the distance from the welding center and the hardness resistance of the two alloys at rotational velocity of conical pen tool welding (1000 rpm) and travel velocity (30 mm/min),in different regions from the beginning of the welding process to its end, where the first region was identified at the beginning of the model (1-1) and the second region in the middle of the model (1-2), and the third region is at the end of the model (1-3), and the results indicate that, the highest hardness resistance was in the third region (1-3) and its value (138 HV), and the reason for this is that the temperatures in this region were higher than the other regions. Figure (5-b) Appears the results of the comparison at rotational velocity (1000 rpm) and travel velocity (40 mm/min), and the results showed that the highest value of the hardness resistance in the middle of the welding zone was also recorded in the third region of the model (2-3) and its value was (144 HV). Figure (5-c) Appears the results at the rotational velocity (1000 rpm) and travel velocity (60 mm/min), and the results also indicate that the value of the hardness resistance in the welding center recorded in the third region of the model (3-3) was (150 HV).
Figure (5-d), which was welded at different travel velocities of the welding cart (30, 40, 60 mm/min), and a constant rotational velocity of the conical pen welding (1000 rpm), where the highest value of the hardness resistance was recorded in the welding center at the travel velocity (60 mm/min) and rotational velocity (1000 rpm) in the third region of this model (3-3) and its value was approximately (150 HV). The hardness values fluctuate with rise and fall, as they decrease to their lowest in the bonding region between the weld and the base metal, then the hardness resistance begins to increase gradually until it reaches a value approximately equal to the resistance of the original metal's hardness, in the side there is an alloy aluminum alloy (AA-7075-T6), but in the side aluminum alloy (AA-2024-O) the hardness resistance value begins Gradually decrease almost until it reaches the hardness values of the base metal.
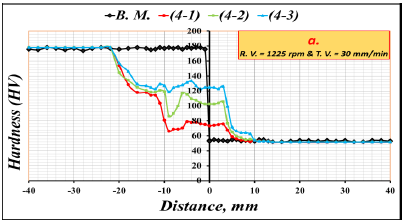
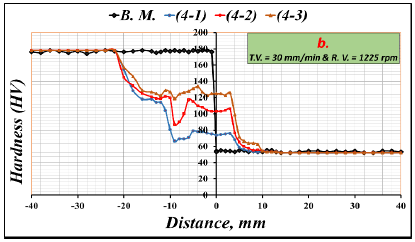
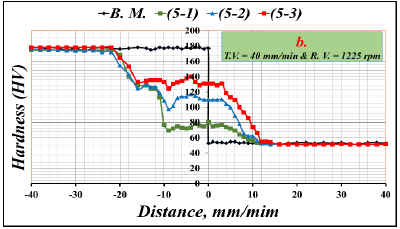
3.1.2 At a rotational velocity (1225 rpm) and a travel velocity (30, 40, 60 mm/min)
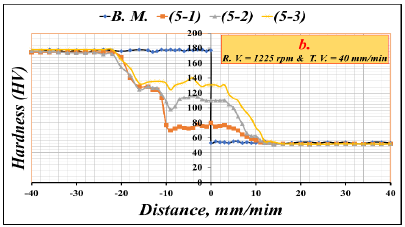
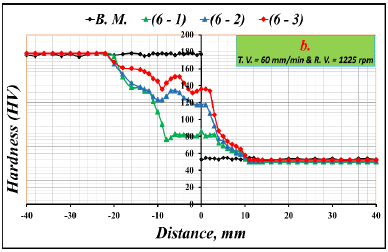
Figure 6 appears the results of comparing the distance from the welding center with the resistance of the hardness, when changing the travel velocities of the welding cart and fixing the rotational velocities of the conical pin tool, three regions were selected for each model, the first region at the beginning of the model, the second region in the middle of the model, and the third region at the end of the model Figure 4. Figure (5-a) Appears the results of a comparison between the distance from the welding center and the hardness resistance of the two alloys at rotational velocity of conical pen tool welding (1225 rpm) and travel velocity (30 mm/min),in different regions from the beginning of the welding process to its end, where the first region was identified at the beginning of the model (4-1) and the second region in the middle of the model (4-2), and the third region is at the end of the model (4-3), and the results indicate that, the highest hardness resistance was in the third region (4-3) and its value (124 HV), and the reason for this is that the temperatures in this region were higher than the other regions. Figure (5-b) Appears the results of the comparison at rotational velocity (1225 rpm) and travel velocity of the cart (40 mm/min), and the results showed that the highest value of the hardness resistance in the middle of the welding zone was also recorded in the third region of the model (5-3) and its value was (131 HV). Figure (5-c) Appears the results at rotational velocity (1225 rpm) and travel velocity (60 mm/min), and the results also indicate that the maximum value of the hardness resistance in the center welding recorded in the third region of this model (6-3) was (136 HV).
Figure 5. Appears the relationship between different distances from the welding center with the hardness resistance, at different travel velocities of the welding cart (30, 40, 60 mm/min), and rotational velocity (1000 rpm)
Figure (5-d), which was welded at different travel velocities of the welding cart (30, 40, 60 mm/min), and a constant rotational velocity of the conical pen welding (1225 rpm), where the highest value of the hardness resistance was recorded in the welding center at the travel velocity (60 mm/min) and rotational velocity (1225 rpm) in the third region of this model (6-3) and its value was approximately (136 HV). The hardness values fluctuate with rise and fall, as they decrease to their lowest in the bonding region between the weld and the base metal, then the hardness resistance begins to increase gradually until it reaches a value approximately equal to the resistance of the original metal's hardness, in the side there is an alloy aluminum alloy (AA-7075-T6), but in the side aluminum alloy (AA-2024-O) the hardness resistance value begins Gradually decrease almost until it reaches the hardness values of the base metal.
Figure 6. Appears the relationship between different distances from the welding center with the hardness resistance, at different travel velocities of the welding cart (30, 40, 60 mm/min), and rotational velocity (1225 rpm)
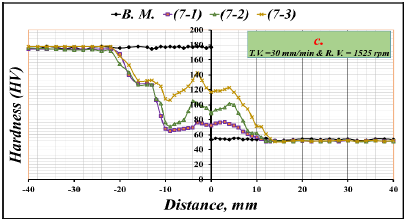
Figure 7. Appears the relationship between different distances from the welding center with the hardness resistance, at different travel velocities of the welding cart (30, 40, 60 mm/min), and rotational velocity (1525 rpm)
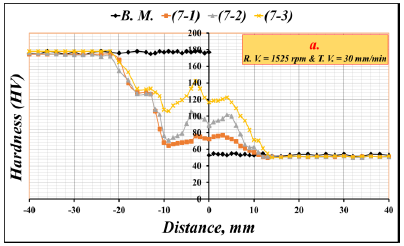
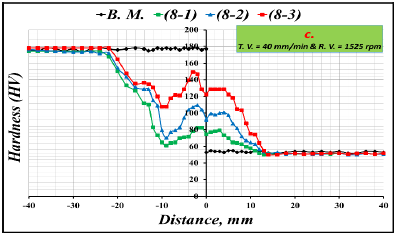
3.1.3 At a rotational velocity (1525 rpm) and a travel velocity (30, 40, 60 mm/min)
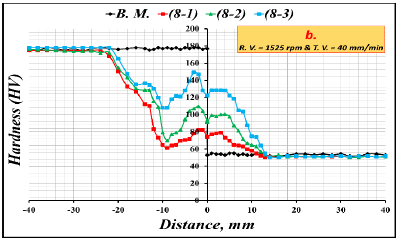
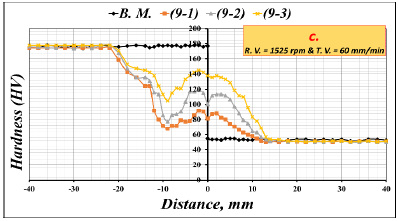
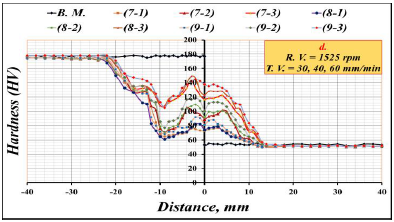
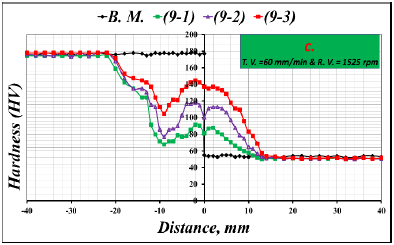
Figure 7 appears the results of the hardness resistance in different areas on the surface of the two welded alloys with the distance from the weld center, at constant rotational velocity (1525 rpm) and different travel velocities (30, 40, 60 mm/min): Figure (7-a) Appears the highest value of the hardness resistance in the weld center was (116 HV) for the model (7-3), while it was the lowest value of the hardness resistance in the weld center for the model (7-1) and its value was (72 HV). Figure (7-b) Appears that the highest value of hardness resistance recorded in the welding center was (123) for the model (8-3), while the lowest value of hardness resistance was recorded for the model (8-1) and its value (75), and Figure (7-c) it Appears that the highest value of hardness was (138) for the model (9-3), and the experimental results showed that the lowest hardness recorded was the model hardness (9-1) and its value (82 HV). Figure (7-d) Appears a comparison of the analysis of the results of all models for a constant rotational velocity (1525 rpm) and a variable travel velocity (30, 40, 60 mm/min), and the results referred that the highest value of the hardness resistance in the welding center recorded was its value (138 HV) for the model (9-3), while the lowest values recorded were for the model (7-1) and its value (72 HV). These results confirm that increasing the travel velocities and the constant rotational velocity leads to an increase in the hardness resistance, the results also show that the best resistance to hardness is in areas where temperatures rise to (380℃).
3.2 The effect of changing a rotational velocity on the resistance of hardness
In this section, the effect of changing the rotational velocity of the conical welding toolon the strength of hardness will be studied. This is done by taking different the rotational velocity of the conical welding tooland the travel velocities at each constant.
3.2.1 At a travel velocity (30 mm/min) and a rotational velocity (1000, 1225, 1525 rpm)
Figure 8 Appears a comparison between the hardness and the distance from the weld center to the end of the edges of the two alloys welded by friction stir welding, at different rotational velocities (1000, 1225, 1525 rpm), and a constant travel velocity (30 mm/min). The results indicate that the hardness resistance values fluctuate between rise and fall from the welding center to all areas affected by the temperatures generated during the welding process until the hardness resistance values are stabilized, to become approximately equal to the hardness values of the base metal, and the results indicate the following: In Figure (8-a) the behavior of the hardness resistance from the welding center to the end of the edges is shown compared to the values of the basic hardness of the alloys, where the highest value of the hardness was recorded in the welding center of the model (1-3) and its value (136 HV), and the lowest value recorded for the hardness resistance was for the model (1-1) and its value (78 HV),while Figure (8-b) Appears that the large value recorded for the hardness resistance was for the model (4-3) and its value (124 HV), and the small value recorded for the model (4-1) and its value (74 HV), and in Figure (8-c) it appears that the highest value of the hardness resistance was (7-3) for the model (118 HV), and the lowest value was (7-1) for the model (70 HV). Figure (8-d) Appears a comparison between all models at the constant velocity (30 mm/min) and different rotational velocities (1000, 1225, 1525 rpm), and the results indicate the fluctuation of the hardness resistance values between increase and decrease to an area that is approximately equal to these values, for the hardness values of the original alloy. The highest hardness value was recorded in the welding center (136 HV) of the model (1-3), and the lowest values recorded for the hardness in the welding center were for the model (7-1) and its value (70 HV).
Figure 8. Appears the relationship between different distances from the welding center with the hardness resistance, at different rotational velocity (1000, 1225, 1525 rpm) with a constant travel velocities of the welding cart (30 mm/min)
3.2.2 At a travel velocity (40 mm/min) and a rotational velocity (1000, 1225, 1525 rpm)
Figure 9 appears a comparison of the hardness and the distance from the center of the weld to the end of two stir-welded alloy flanges, with different rotational velocities (1000, 1225, 1525 rpm) and a constant travel velocity at (40 mm/min). The results indicate that the hardness strength values fluctuate between going up and down from the center of welding towards all the zones affected by the temperatures generated during the welding process until the hardness strength values stabilize becoming approximately equal to the values base metal hardness, and the results indicate the following: In Figure (9-a) the behavior of the hardness resistance from the welding center to the end of the edges is shown compared to the values of the basic hardness of the alloys, where the highest value of the hardness was recorded in the welding center of the model (2-3) and its value (144 HV), and the lowest value recorded for the hardness resistance was for the model (2-1) and its value (82 HV),while Figure (9b) Appears that the highest value recorded for the hardness resistance was for the model (5-3) and its value (130 HV), and the lowest value recorded for the model (5-1) and its value (80 HV), and in Figure (9-c) it appears that the highest value of the hardness resistance was (8-3) for the model (120 HV), and the lowest value was (8-1) for the model (74 HV). Figure (9-d) Appears a comparison between all models at the constant velocity (40 mm/min) and different rotational velocities (1000, 1225, 1525 rpm), and the results indicate the fluctuation of the hardness resistance values between increase and decrease to an area that is approximately equal to these values, for the hardness values of the original alloy. The highest hardness value was recorded in the welding center (144 HV) of the model (2-3), and the lowest values recorded for the hardness in the welding center were for the model (8-1) and its value (74 HV).
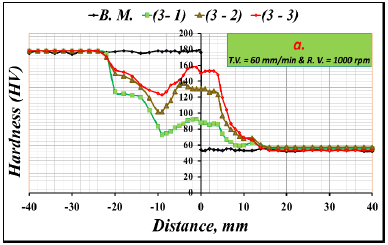
3.2.3 At a travel velocity (60 mm/min) and a rotational velocity (1000, 1225, 1525 rpm)
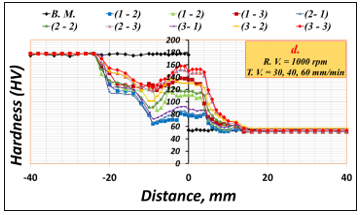
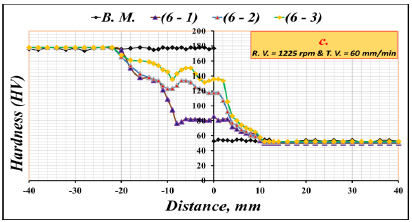
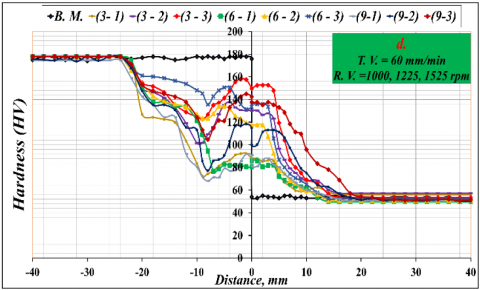
Figure 10 appears a comparison of the hardness and the distance from the center of the weld to the end of two stir-welded alloy flanges, with different rotational velocities (1000, 1225, 1525 rpm) and a travel velocity fixed (60 mm/min). The results indicate that the hardness strength values fluctuate between going up and down from the center of welding towards all the zones affected by the temperatures generated during the welding process until the hardness strength values stabilize becoming approximately equal to the values base metal hardness, and the results indicate the following: In Figure (10-a) the behavior of the hardness resistance from the welding center to the end of the edges is shown compared to the values of the basic hardness of the alloys, where the highest value of the hardness was recorded in the welding center of the model (3-3) and its value (150 HV), and the lowest value recorded for the hardness resistance was for the model (3-1) and its value (88 HV),while Figure (10-b) Appears that the highest value recorded for the hardness resistance was for the model (6-3) and its value (136 HV), and the lowest value recorded for the model (6-1) and its value (86 HV), and in Figure (10-c) it appears that the highest value of the hardness resistance was (9-3) for the model (138 HV), and the lowest value was (9-1) for the model (81 HV). Figure (10-d) Appears a comparison between all models at the constant velocity (60 mm/min) and different rotational velocities (1000, 1225, 1525 rpm), and the results indicate the fluctuation of the hardness resistance values between increase and decrease to an area that is approximately equal to these values, for the hardness values of the original alloy. The highest hardness value was recorded in the welding center (150 HV) of the model (3-3), and the lowest values recorded for the hardness in the welding center were for the model (9-1) and its value (81 HV). These results indicate that at a constant travel velocity and different rotational velocities, the hardness resistance decreases when the travel velocities increase and the rotational velocity is constant, for alloys welded by friction stir welding.
Figure 9. Appears the relationship between different distances from the welding center with the hardness resistance, at different rotational velocity (1000, 1225, 1525 rpm) with a constant travel velocities of the welding cart (40 mm/min)
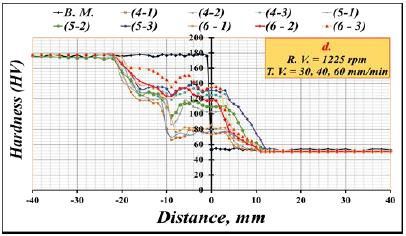
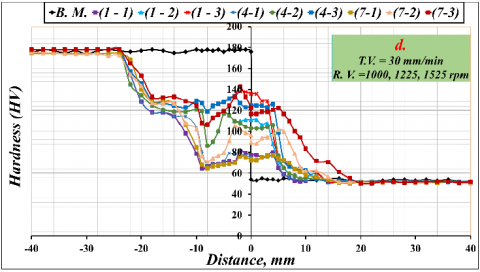
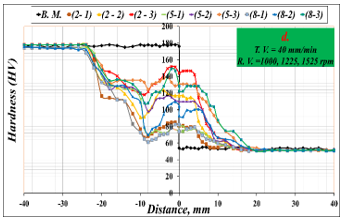
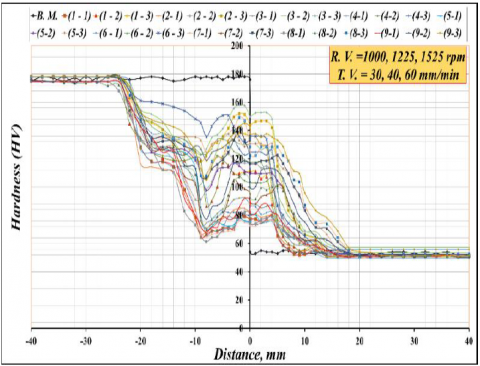
3.3 At a rotational velocity (1000, 1225, 1252 rpm) and a travel velocity (30, 40, 60 mm/min)
Figure 11 appears a comparison between the different areas on the surface of the two alloys welded by friction stir welding and a hardness resistance for all models. The results show that the increase in the travel velocity of the welding cart leads to an increase in the hardness resistance of the welded parts, while the hardness resistance decreases with the increase in the rotational velocity. The highest value recorded for the hardness resistance was in the middle of the welding center, its value was (150 HV) in the model (3-3) at travel velocity (1000 rpm) and travel velocity (60 mm/min), while the lowest value was recorded for the hardness resistance in the model (7-1) at travel velocity (1525 rpm) and travel velocity (30 mm/min), and its value was (72 HV).
Figure 10. Appears the relationship between different distances from the welding center with the hardness resistance, at different rotational velocity (1000, 1225, 1525 rpm) with a constant travel velocities of the welding cart (60 mm/min)
Figure 11. Appears the relationship between different distances from the welding center with the hardness resistance, at different travel velocities of the welding cart (30, 40, 60 mm/min), with a different rotational velocity (1000, 1225, 1525 rpm)
The hardness resistance increased when the temperature of the pen tool welding reached its highest value, as it was observed that the hardness resistance increased by (50%) at the end of the model than the hardness resistance at the beginning of the model, and this leads us to the importance of heating the friction welding tool at the beginning before starting the welding stir friction process in order to be the hardness resistance of the two alloys from beginning to end of the welding process is approximately equal.
The hardness resistance increases with the increase in the travel velocity of the welding cart, and the reason for this is because the increase in the travel velocity of the welding cart causes a decrease in the size of the grains in the welding area and this leads to an increase in the hardness of the alloy in the welding area at increase in travel velocity of the welding cart.
The resistance of the hardness of alloys welded by friction stir welding method decreases when the rotational velocity increases and the travel velocity of the cart is constant.
The behavior of the hardness resistance of the two alloys welded together by friction stir welding from the center of the weld to the end of the two edges is much greater than the hardness values of the aluminum alloy (AA-2024-O), but it is less than the hardness values of the aluminum alloy (AA-7075-T6), after the center point of the weld on the constituent side of the alloy (AA-7075-T6) the values of the hardness resistance fluctuate with an increase or decrease to the bonding distance between the welding mixture and the original alloy where the hardness values of the alloy decrease to a minimum (that is, it is the weakest region to resist the hardness in this alloy), then the hardness values start to increase until they reach values equal to the values of the original alloy , while on the other side, which consists of aluminum alloy (AA-2024-O), the hardness values decrease from the hardness resistance value in the welding center until it reaches values of equal to the values of the hardness of the original alloy.
Based on the results of the hardness comparison discussed above, the ideal welding schedule would have a peak temperature that was higher than the solution treatment temperature but lower than any incipient melting temperature, as well as the fastest welding pace. The welding settings will be further constrained by the need to produce a faultless weld. The findings drawn from the data provided are mostly focused on the impacts of temperature, fluctuating welding cart linear velocities, and welding tool rotating speed; they do not take into account the complex extra effects of the varied stress histories between nuggets and HAZ. It seems that reasonable explanations can be offered for the observed trends based on considerations of welding speed and peak temperature when just taking into account HAZ or bulk data. To resolve any discrepancies between HAZ and cluster behavior that can be traced to the stress log, further thorough work will be needed.
This work was supported through Northern Technical University, Iraq. by the Research Program of the Engineering Science, (No. 001233- 2021).
[1] Elmer, J.W., Kautz, D.D. (1993). Fundamentals of Friction Welding. ASM Handbook. https://doi.org/10.31399/asm.hb.v06.a0001349
[2] Ambroziak, A., Korzeniowski, M., Kustron, P., Winnicki, M., Sokołowski, P., Harapińska, E. (2014). Friction welding of aluminium and aluminium alloys with steel, mild steel. Advances in Materials Science and Engineering, 2014: 981653. https://doi.org/10.1155/2014/981653
[3] Mall, P.P., Panchal, J. (2017). Friction stir welding process & parameters: A review. Materials Science and Engineering, 6(6): 15-18. https://doi.org/10.17577/IJERTV6IS060029
[4] Nandan, R., Debroy, T., Bhadeshia, H.K.D.H. (2008). Recent advances in friction-stir welding - Process, weldment structure and properties. Progress in Materials Science, 53(6): 980-1023. https://doi.org/10.1016/j.pmatsci.2008.05.001
[5] Fuller, C.B., Mahoney, M.W., Calabrese, M., Micona, L. (2009). Evaluation of microstructure and mechanical properties in naturally aged 7050 and 7075 Al friction stir welds. Journal of Materials Science and Engineering, 527(9): 2233-2240. https://doi.org/10.1016/j.msea.2009.11.057
[6] Bitondo, C., Prisco, U., Squilace, A., Buonadonna, P., Dionoro, G. (2011). Friction-stir welding of AA 2198 butt joints: Mechanical characterization of the process and of the welds through DOE analysis. Int J Adv Manuf Technol., 53: 505-516. https://doi.org/10.1007/s00170-010-2879-9
[7] Karash, E.T.B., Yassen, S.R., Kassim, M.T.E. (2018). Effect of friction stir welding parameters on the impact energy toughness of the 6061-6 aluminum alloys. Annals of “Dunarea de Jos” University, Fascicle XII ISSN 1221-4639 Welding Equipment and Technology, 29: 27-32. https://doi.org/10.35219/awet.2018.04
[8] Amin, S.A., Hanna, M.Y., Mohamed, A.F. (2018). Experimental study the effect of tool design on the mechanical properties of bobbin friction stir welded 6061-T6 aluminum alloy. Al-Khwarizmi Engineering Journal, 14(3): 11-14. https://doi.org/10.22153/kej.2018.01.003
[9] Hannachi, N., Khalfallah, A., Leitão, C., Rodrigues, D. (2022). Thermo-mechanical modelling of the friction stir spot welding process: Effect of the friction models on the heat generation mechanisms. Annals of “Journal of Materials Design and Applications, 236(8): 1465-1475. https://doi.org/10.1177/14644207211070965
[10] Ogunsemiab, B.T., Abioyecd, T.E., Ogedengbeb, T.I., Zuhailawati, H. (2021). A review of various improvement strategies for joint quality of AA 6061-T6 friction stir weldments. Journal of Materials Research and Technology, 11: 1061-1089. https://doi.org/10.1016/j.jmrt.2021.01.070
[11] Rusu, C.C., Mistodie, L.R. (2010). Thermography used in friction stir welding processes. Annals of “dunarea de Jos” University of Galati Fascicle Xii, Welding Equipment and Technology, 21.
[12] Buffa, G., Hua, J., Shivpuri, R., Fartini, L. (2016). A continuum-based fem model for friction stir welding - model development. Materials Science and Engineering A, 419(1-2): 389-396. https://doi.org/10.1016/j.msea.2005.09.040
[13] Patil, C., Patil, H., Patil, H. (2016). Investigation of weld defects in similar and dissimilar friction stir welded joints of aluminum alloys of AA7075 and AA6061 by X-ray radiography. American Journal of Materials Engineering and Technology, 4(1): 11-15. https://doi.org/10.12691/materials-4-1-3
[14] Rajakumar, S., Muralidharan, C., Balasubramanian, V. (2011). Statistical analysis to predict grain size and hardness of the weld nugget of friction stir-welded AA6061-T6 aluminum alloy joints. Int J Adv Manuf Technol., 57: 151-165. https://doi.org/10.1007/s00170-011-3279-5.
[15] Arora, K.S., Pandey, S., Schaper, M., Kumar, R. (2010). Effect of process parameters on friction stir welding of aluminum alloy 2219-T87. Int J Adv Manuf Technol., 50: 941-952. https://doi.org/10.1007/s00170-010-2560-3
[16] Palanivel, R., Koshy, M.P., Murugan, N. (2011). Development of mathematical model to predict the mechanical properties of friction stir welded AA6351 aluminum alloy. Journal of Engineering Science and Technology Review, 4(1): 25-31. https://doi.org/10.25103/jestr.041.03
[17] Mohammad, R., Hamidreza, N. (2011). Analysis of transient temperature and residual thermal stresses in friction stir welding of aluminum alloy 6061-T6 via numerical simulation. Int J Adv Manuf Technol., 55: 143-152. https://doi.org/10.1007/s00170-010-3038-z
[18] Padmanaban, R., Ratna Kishore, V., Balusamy, V. (2014). Numerical simulation of temperature distribution and material flow during friction stir welding of dissimilar aluminum alloys. Procedia Engineering, 97: 854-863. https://doi.org/10.1016/j.proeng.2014.12.360
[19] Tang, W., Guo, X., Mcclure, J.C., Murr, L.E. (1998). Heat input and temperature distribution in friction stir welding. Journal of Materials Processing and Manufacture Science, 7(2): 163-172. https://doi.org/10.1106/55TF-PF2G-JBH2-1Q2B
[20] Chao, Y.J., Qi, X., Tang, W. (2003). Heat transfer in friction stir welding—experimental and numerical studies. Transactions of the ASME, 125(1): 138-145. https://doi.org/10.1115/1.1537741
[21] Shabbir, M., Jacek, T., Hesamoddin, A.D. (2021). Thermo-mechanical simulation of underwater friction stir welding of low carbon steel. Materials, 14(17): 4953. https://doi.org/10.3390/ma14174953
[22] Peel, M.J., Steuw, A., Withers, P.J., Dickerson, T., Shi, Q., Shercliff, H. (2006). Dissimilar friction stir welds in AA5083-AA6082.part I: Process parameter effects on thermal history and weld properties. Metallurgical and Materials Transactions A, 37: 2183-2193. https://doi.org/10.1007/BF02586138
[23] Ramulu, P.J., Kailas, S.V., Ganesh Narayanan, R. (2012). Influence of tool rotation velocity and feed rate on the forming limit of friction stir welded AA6061-T6 sheets. Mechanical Engineers Part C Journal of Mechanical Engineering Science, 227(3): 520-541. https://doi.org/10.1177/0954406212463996
[24] Manuel, N., Beltrão, D., Galvão, I., Leal, R.M., Costa, J.D., Loureiro, A. (2021). Influence of tool geometry and process parameters on torque, temperature, and quality of friction stir welds in dissimilar al alloys. Materials (Basel), 14(20): 6020. https://doi.org/10.3390/ma14206020
[25] Karash, E.T., Saeed, R.Y., Mohammed, T.E.Q. (2015). The effect of the cutting depth of the tool friction stir process on the mechanical properties and microstructures of aluminum Alloy 6061-T6. American Journal of Mechanics and Applications, 3(5): 33-41. https://doi.org/10.11648/j.ajma.20150305.11
[26] Chaudhary, B., Patel, V., Ramkumar, P.L., Vora, J. (2019). Temperature distribution during friction stir welding of AA2014 aluminum alloy: experimental and statistical analysis. The Indian Institute of Metals – IIM, 72(4). https://doi.org/10.1007/s12666-018-01558-z
[27] Abdullah, O.F., Hussein, O.A., Karash, E.T. (2020). The laser surface treatment effective on structural properties for invar alloy (Fe-Ni) type prepared by powder technology. Key Engineering Materials, 844: 97-103. https://doi.org/10.4028/www.scientific.net/KEM.844.97
[28] Pogrebnyak, A.D., Mahmud, A.M., Karasha, E.T. (2012). Structural properties ofnanocrystal line tin film. International Journal of Structronics & Mechatronics. 102 Actual Challenges in Materials Science and Processing Technologies, 443(1-2): 43-47. https://doi.org/10.1016/j.jallcom.2006.10.012
[29] Naumov, A., Morozova, J., Isupov, F., Golubev, I., Michailov, V. (2019). Temperature influence on microstructure and properties evolution of friction stir welded Al-Mg-Si alloy. Key Engineering Materials, 822: 122-128. https://doi.org/10.4028/www.scientific.net/KEM.822.122
[30] Reynolds, A.P., Tang, W., Khandkar, Z., Khan, J.A., Lindner, K. (2005). Relationships between weld parameters, hardness distribution and temperature history in alloy 7050 friction stir welds. Science and Technology of Welding and Joining, 10(2): 190-199. https://doi.org/10.1179/174329305X37024
[31] Saad, A.K., Toshiya, S., Masaaki, N. (2006). Control of hardness distribution in friction stir welded AA2024-T3 aluminum alloy. Materials Transactions, 47(6): 1560-1567. https://doi.org/10.2320/matertrans.47.1560
[32] Matweb, Material prperyies data, Advertise with MatWeb.https://www.matweb.com/search/datasheet.aspx?matguid=642e240585794f0ab91428aa78c27b4e&ckck=1.
[33] Matweb, Material prperyies data, Advertise with MatWeb.https://www.matweb.com/search/DataSheet.aspx?MatGUID=4f19a42be94546b686bbf43f79c51b7d.
[34] Ghorbal, G.B., Tricoteaux, A., Thuault, A., Louis, G., Chicot, D. (2017). Comparison of conventional Knoop and Vickers hardness of ceramic materials. Journal of the European Ceramic Society, 37(6): 115-154. https://doi.org/10.1016/j.jeurceramsoc.2017.02.014