Abhay Gudi* | Vijaykumar Hindasageri
© 2022 IIETA. This article is published by IIETA and is licensed under the CC BY 4.0 license (http://creativecommons.org/licenses/by/4.0/).
OPEN ACCESS
Experimental and numerical study has been performed to study effect of swirl on heat transfer. A twisted swirl tape with twist ratio (T. R)=2 is used to generate swirl and effect of parameters like z/d=2 to 8 and Re varying between 3000 to 9000 are studied experimentally. Experiments show heat transfer dependency on Reynolds number. This study is further extended numerically using commercial CFD code ANSYS Fluent for much higher Reynolds number flow up to 20000. It is seen that CFD centerline peak Nu profile matches pretty well with experiments conducted. A relation between peak Nu and Re is established numerically for the conditions mentioned above. Further, effect of multiple swirl jet impingement (two jets separated by distance 1.5D, 2D and 3D) on Peak Nu is explained through CFD studies. CFD results show that jet distance of 1.5D is more effective in achieving higher heat transfer compared to 2D and 3D distances.
Nusselt number, jet impingement, Reynolds number, thermal imaging, CFD
Swirling jets are widely known methods to improve heat transfer since decade. Many researchers have contributed to understand swirl and its application in heat transfer problems. When we talk about conventional jet impingement studies, literature [1-5] help us understand the applications of jet impingement in various industrial field. Parameters such as Reynolds number (Re), jet to plate distance (z/d), impingement surface and its area, Prandtl number (Pr), angle of impingement, type of jet etc. play very important role in estimation of heat transfer rate. This is explained in literature [5-11]. Literatures [12, 13] show that swirling flow improve heat transfer rate compared to conventional method of jet impingement. Work done by Gupta et al. [14] and Huang and El-Genk [15] show that swirling method of heat transfer enhancement show unform area coverage on target surface when compared to conventional jet impingement. They have also shown that better heat transfer is achieved with less spacing between jet and the impingement surface. Bakirci and Bilen [16] have used three techniques of visualization of temperature distribution and heat transfer in their study. Their study showed that with higher swirl angle (θ=50°) causes uniform heat transfer and heat transfer increases with increase in Reynolds number. Wen and Jang [17] have used smoke flow visualization technique to compare both conventional and swirling air jet impingement for jet to plate distance of 3 to 16, Re between 500 to 17000 for different nozzle geometries. Brown et al. [18] have studied swirl jet impingement on plate with different thermal heating conditions of plate. They conclude that different thermal boundary conditions do not impact much on heat transfer as heat transfer enhancement depends on type of swirl and other parameters like jet to plate distance and Reynolds number. Eiamsa-ard [19] have experimentally studied heat transfer from swirling jet and compared with conventional jet impingement. thermochromic liquid crystal (TLC) sheet and image processing technique is used by them to understand thermal heat transfer enhancement. Their experiments clearly show that swirling jets are having higher heat transfer compared to conventional jets. Experimental investigation was conducted by Kumar et al. [20] who showed that heat transfer initially increased with the increase in twist ratio (2 to 4.5) and there after reduced with the increase in the twist ratio (4.5 to 7.5). Heat transfer rate was maximum at z/d=1 for all twist ratios and Reynolds number. Experimental studies were done by Gudi and Hindasageri [21] who have shown that it is possible to increase heat transfer through use of delta swirl tape for jet to plate distance of 2 to 8 and Re varying between 1500 to 9000. Results got are compared with conventional swirl jet with swirl tape and it is seen that delta tape helps in improved heat transfer.
All the above studies showed experimental work done on swirl jets. Below we have shown some numerical studies that were caried in this area of research.
Shuja et al. [22] have studies effect of confined swirling jet impingement onto an adiabatic wall. Various jet velocity profiles are studied in their work and they have shown that jet axis tilts towards the radial direction as swirl velocity increases and reducing the velocity profile number enhances the entropy generation due to heat transfer. Shuja and Yilbas [23] have studied numerically laminar swirl jet impingement on an adiabatic wall. They have considered six jet exit profiles and four swirl profiles for their study. Their study shows that the total entropy generation increases with increasing swirl velocity for low velocity profile numbers. Uddin et al. [24] have used LES to study effect of swirling and non-swirling flow on heat transfer. Reynolds number of 23000 and z/d=2 is considered in their study. Swirl number of jets used are 0,0.2 and 0.47 and their study show that swirl does not give much improvement in heat transfer on target wall. Amini et al. [25] have shown numerically that instead of single jet, pair of jet help improve heat transfer.
With the help of thin foil technique and thermal imaging, in the present work experiments on swirl jets are caried out for Reynolds number varying between 3000<=Re<=9000 with different jet to plate distance. A twisted tape of twist ratio (T.R) =2 is used in present study. Present study is further extended numerically by using commercially available CFD code ANSYS Fluent to investigate heat transfer for high Reynolds number up to Re=20000. Also, CFD is used to arrive at optimal distance between two jets to achieve high heat transfer.
Below we show overall objective of present work:
(1) Understand heat transfer enhancement for a swirl jet impingement by use of experimental thin foil technique and thermal imaging.
(2) Use of CFD to arrive at a numerical relation between Nu and Re for swirling jet flow varying between 3000<=Re<=2000.
(3) Further numerical investigation to understand and arrive at optimal jet to jet distance to achieve high heat transfer.
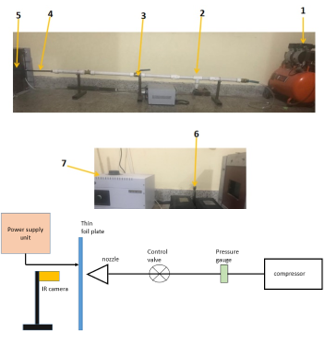
Experimental setup details and schematic diagram of setup are shown in Figure 1. Most of components of this setup remain same as already explained in literature [26] apart from the pulse generation unit.
Figure 1. Actual setup and schematic diagram of experimental setup
1) Compressor; 2) Pressure Gauge; 3) control valve; 4) Nozzle; 5) thin foil plate; 6) IR camera; 7) Power supply unit
A compressor of 1.1-liter capacity is used to generate air flow through pipe of diameter 1 inch. Flow control valve is attached to this pipe to control air flow thus achieve required flow rate for the study. At the end of pipe, a flexible arrangement is made such that a nozzle of 10 mm diameter gets attached to this pipe. Thus, flow coming out of the nozzle forms a jet which is made to impinge on heated flat plate that is placed at certain distance from the plate. Jet air flow rate is measured using a digital Testo smart hotwire anemometer [26-28]. Hot wire anemometer used in the experiment is shown in Figure 2.
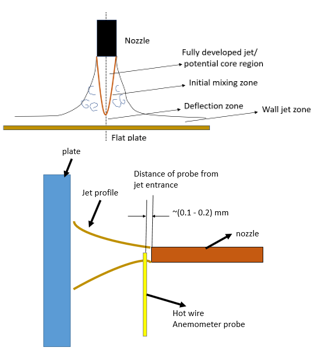
Methodology used to arrive at impinging jet Reynolds number is explained in Figure 3. Literatures [26] have shown that impinging air jet is divided into four regions; a) initial mixing jet b) established jet c) deflection zone d) wall jet. These regions are represented in Figure 3. Initial mixing jet region will have centerline velocity equal to jet exit velocity. Hence probe of hotwire anemometer is placed in such a manner that distance between nozzle jet exit and anemometer probe is maintained as minimum as possible, thus measured velocity (average velocity) of air impinging out of jet is nozzle air velocity.
Figure 2. Testo hot wire anemometer probe
Figure 3. Probe position and alignment in jet flow
It is worth noting that accuracy of Testo smart anemometer is in the range of +/- 0.5%. Once the flow is set for a particular Reynold number anemometer is removed and heat transfer readings are taken on surface area of interest.
Thin foil technique [20] is used to measure heat transfer. A stainless-steel plate of 0.06 mm having dimension of 215mm x 145mm is used in present work. The plate is held between two buss bars which are firmly gripped on to support material. Electric power is supplied at ends of target plate through buss bar from a variable transformer. Thus, uniform heating of plate is achieved.
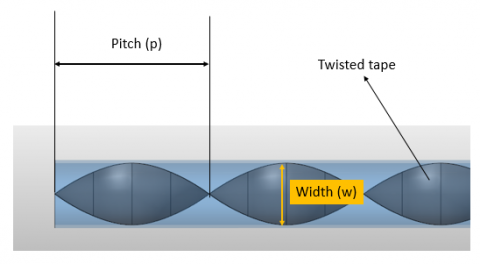
For swirl generation, twisted tapes made from brass material is inserted into the nozzle. Length of this tape is 650mm, diameter 10mm and thickness of 0.9mm respectively. Parameters like pitch (p), width (w) and thickness (t) are defined for selection of twisted tapes.
The thickness of twisted tape used during experiment is 0.9 mm while the width (w) is 10 mm. A non-dimensional number called as twist ratio (T.R) is defined as
$\text{Twist Ratio (T}\text{.R) = }\frac{\text{Twisted tape pitch}}{\text{Twisted tape width}}$ (1)
Axial distance between two points on twisted tape, when tape is rotated 180deg defines the pitch (p) of the twisted tape. Representation of pitch (p) and width (w) is shown in Figure 4.
Figure 4. Twisted tape in the nozzle
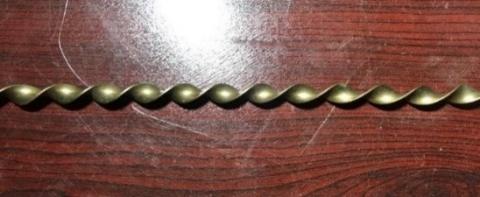
In present work, heat transfer measurements are done using twisted tape with twist ratio (T.R) of 2 as shown in Figure 5.
Figure 5. Twisted tape with T.R=2
Above figure shows twisted tape with T.R=2 selected for present experimental studies. Literature [20] brings out effect of varying pitch and width experimentally. They have shown that lower the pitch better the heat transfer.
The heat transfer distribution on the target plate is measured by capturing the thermal images obtained from an Infra-Red (IR) camera positioned on the back side of the target surface. Temperature difference when measured across the plate shows very negligible difference. Thus, it is assumed that temperature got on back surface to be same on that of front surface exposed to jet impingement. Black Matte Finish Asian paint with 0.99 emissivity is used to paint the plate surface. IR technology is used to measure the temperature on plate.
‘FLIR C3 Thermal Imaging’ infrared thermal camera is used to collect local temperature distribution with a resolution of about 360x240 screen resolution. Table 1 shows details about the camera used in experiment.
Power is supplied from DC power source. The voltage across the target plate is measured by ‘Meco’ digital meter whose ranges and accuracies are of ±0.5% V. The jet air is allowed to impinge on the target plate with the heat input. The target plate allowed to acquire steady state temperature with the air jet and its temperature is measured by using thermal camera from the other side of the plate. Power loss from the exposed surface of the target plate due to natural convention and radiation is estimated experimentally. The procedure of heat loss estimation is explained in section below.
Table 1. FLIR C3 camera details
|
Overview |
Camera – FLIR C3 |
|
Spectral Range |
7.5-14.0 μm |
|
Digital Camera |
640×480 pixel |
|
Object Temperature Range |
-10℃ to 150℃ (14°F to 302°F) |
|
Accuracy |
±2℃ (±3.6°F) or ±2%, whichever is greater, at 25℃ (77°F) nominal |
2.1 Estimation of heat loss
The temperature distribution on flat plate is obtained by images from IR thermal camera. Nusselt number is calculated as:
$N u=\frac{h d}{k}$ (2)
$h=q($ conv $) /\left(T_{\text {wall }}-T_{\text {ref }}\right)$ (3)
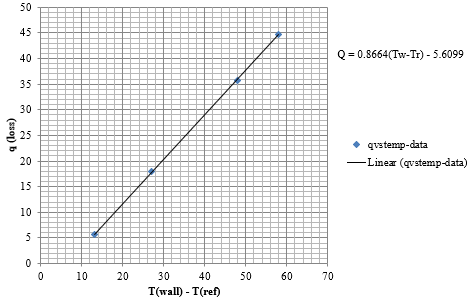
$q(\operatorname{con} v)=q(w)-q(\operatorname{loss})$ (4)
$q(w)=\mathrm{VI} / \mathrm{A}$ (5)
$q($ loss $)=q(r a d)+q(n a t)$ (6)
Heat loss from the plate is obtained by heating the plate at different time interval and measuring the wall temperature. A linear fit curve is obtained between heat loss and temperature difference between plate surface and ambient reference temperature. This is shown in Figure 6.
Figure 6. Heat loss linear fit curve
In present work, the temperature difference between the plate surface and jet was kept above 40℃ that estimates a maximum uncertainty of not more than 3%. The heat flux uncertainty of plate is same as that of uncertainty of the power supplied. The uncertainties measurement as suggested by Moffat method [29] is applied for parameters such as Nusselt number and Reynolds number. It is found that uncertainty lie between 3-4 % for present work.
3.1 Experimental validation
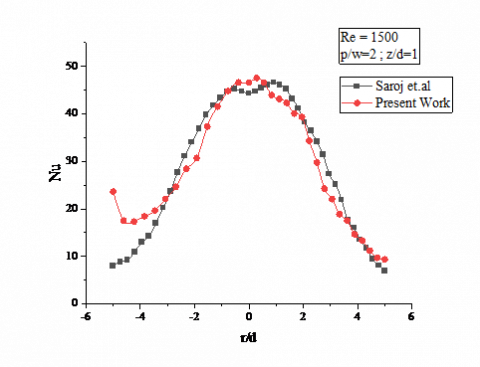
Centerline Nu distribution for Re=1500, p/w=2 & z/d=1 is obtained for a swirling jet flow on target plate is compared with results obtained by Kumar et al. [20] as shown in Figure 7. Present results show good agreement with literature. Stagnation Nu vary by 4% compared to results of Kumar et al. [20].
Figure 7. Experimental validation study
3.2 Swirl generation using twisted tape
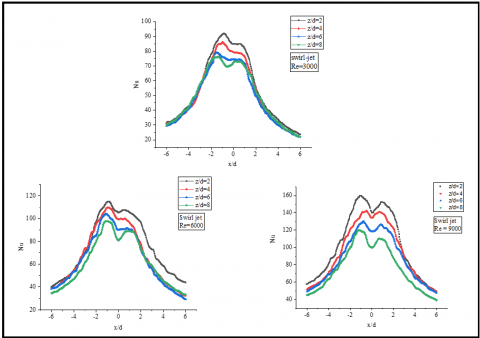
This section discusses results got using traditional approach of swirl generation for twisted tape of T.R=2. Reynolds number for this study is varied between 3000 to 9000. Jet to plate distance is varied between 2 to 8 for all the cases. Figure 8 shows centerline Nu distribution across the plate for above mentioned condition.
Figure 8. Centerline Nu distribution
Following observation can be made from above study:
(1) Heat transfer is more effective at low jet to plate distance irrespective of Reynolds number. In present case it is seen that for z/d=2, heat transfer effectiveness is higher.
(2) As z/d increases heat transfer effectiveness decreases.
(3) Shift of peak Nu is seen in all the case with sudden decrease in Nu in the stagnation region.
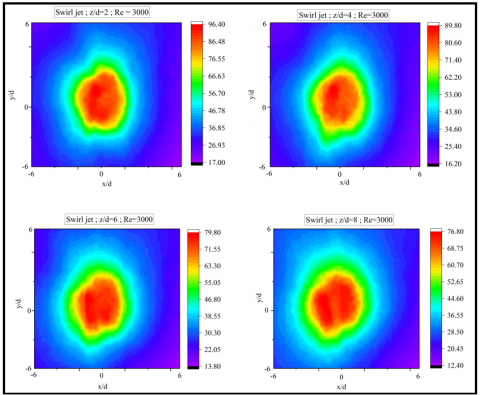
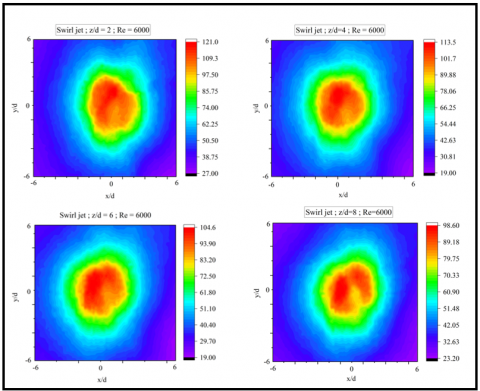
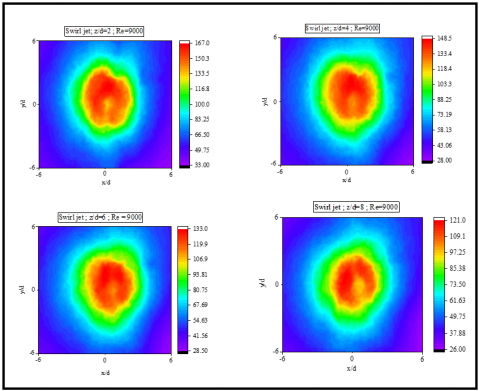
Figure 9-12 shows contour plot of Nu generated on target plate. For z/d=2, 4, 6, 8 and Re varying between 3000 to 9000.
Figure 9. Contours of Nu distribution on target plate for z/d=2 to 8 and Re=3000
Figure 10. Contours of Nu distribution on target plate for z/d=2 to 8 and Re=6000
Figure 11. Contours of Nu distribution on target plate for z/d=2 to 8 and Re=9000
It is clear from contour plots that due to presence of swirl tape; peak Nu is seen to be shifted axially. We observe a drop in Nu at center of plate, that is due to stagnation region development. The flow gets distributed into two lumps of fluid with formation of stagnation region at the center. Thus, we see sudden dip in centerline Nu at stagnation region.
3.3 Numerical results discussion
3.3.1 CFD correlation study
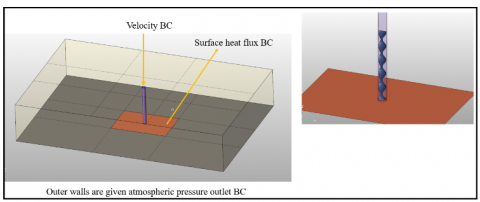
Correlation study is carried out for one of the above explained experimental case of Re=3000, z/d=2. Figure 12 shows CFD model used for the study with boundary conditions. Swirl tape with T.R=2 is also modeled as shown in Figure 12. Well-known commercial code ANSYS Fluent [30] is used to build and solve the CFD model.
Figure 12. CFD model for correlation study
A mesh refinement study was conducted with tetrahedral volume mesh size varying between 0.08 to 0.3 million cells. Centerline Nusselt number was calculated for each of the mesh and based on the study conducted, 0.12 mesh was found to be optimum mesh for the study.
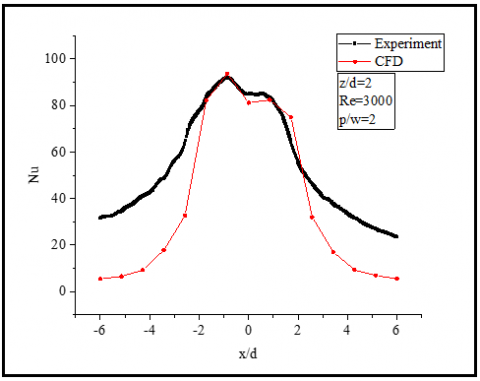
Figure 13 shows centerline Nu plot where in CFD results correlate pretty well w.r.t peak Nu match with the experimental results. Turbulence model of RNG k-e was used for the study which is proven modeling technique for swirling flows according to literature [24].
Figure 13. Centerline Nu distribution
3.3.2 Further CFD studies
Based on the experiments conducted in previous section and centerline Nu validation achieved between CFD and experiment, it was decided to extend this work for high Reynolds number flow and develop a numerical correlation between peak Nu and Re. In this work, Reynolds number was varied from 3000 to 20000 with z/d=2. Many literatures have already discussed that heat transfer effectiveness is more at z/d=2. Hence CFD results were taken for z/d=2 considering these literature work.
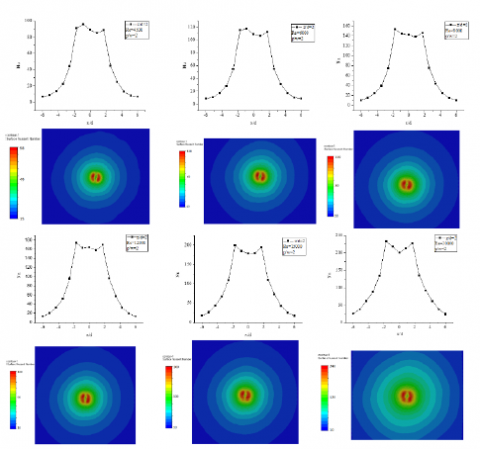
Figure 14 shows calculated centerline Nu and surface Nu contour plot for Re=3000 to 20000 at z/d=2.
Figure 14. Centerline Nu and surface Nu contour plot
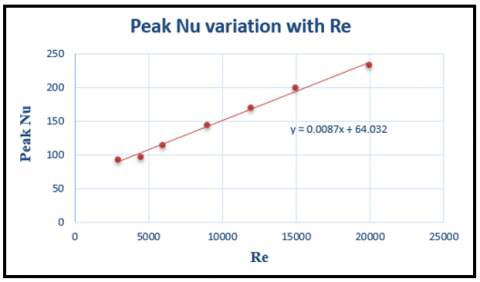
A peak Nu variation w.r.t Re for above studies is shown in Figure 15. It can be seen that Nu increases linearly with increase in Re. A numerical correlation is built as given in Eq. (7):
Nu(peak)=0.0087(Re)+64.032 (7)
Figure 15. Peak Nu w.r.t Re
The above equation can be assumed to be good approximation in evaluating Peak Nu for near wall jet impingement heat transfer application.
It is seen that due to presence of twisted tape, there is a shift in peak Nu as twisted tape increases the swirl thereby help improve heat transfer. This peak Nu shift is almost seen for all Reynolds number studies conducted above. Experiments done in our case for Re up to 9000 also depict same phenomenon of peak Nu shift. Hence, it would be matter of interest to study what would happen to peak Nu shift if multiple jet with swirl tape is considered.
(1) Effect of two colinear jets on peak Nu
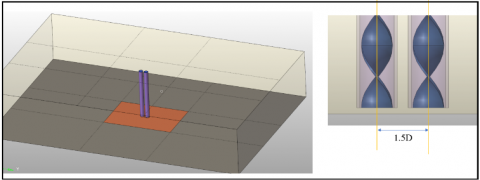
A CFD study is conducted to understand effect of two jets in a row on peak Nu. In this study center distance between the jet diameter is varied from 1.5D to 3D for Re=3000, 9000 and 20000 and z/d=2 and 6, with jet impingement pipe having swirl tape of T.R=2. Results of this study is explained below: Effect Reynolds number on heat transfer for two jets separated by 1.5D and z/d=6.
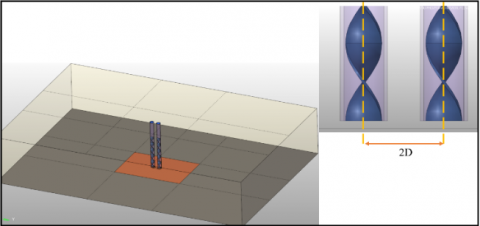
Figure 16 shows CFD domain for the above-mentioned condition. Jet to plate distance of z/d=2 and z/d=6 is studied in this case.
Figure 16. CFD domain representation of two jets separated by distance 1.5D
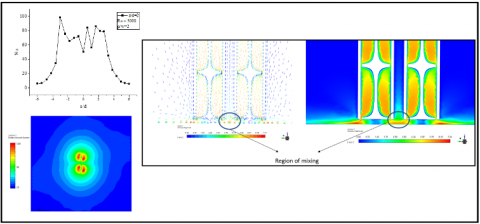
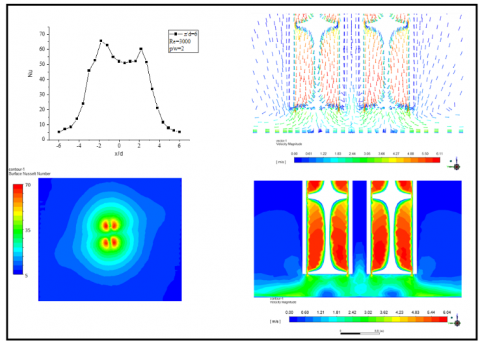
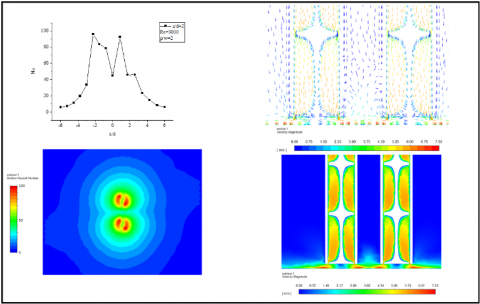
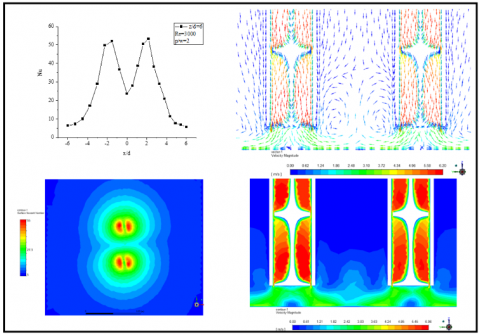
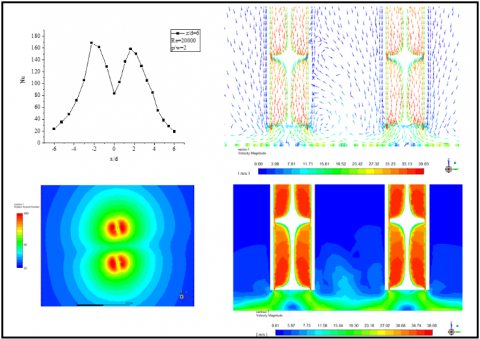
Figure 17 shows centerline Nu, surface Nu contour plot for Re=3000 and z/d=2. Velocity contour and section plots are shown in Figure 17.
Following observations can be made from this study: (1) There is continuous mixing of two stream of fluid jet that happens at the center which we call as region of mixing in figure. This mixing causes effective heat transfer improvement. (2) It is also observed that, two stagnation regions exist just below the surface of swirl tape thus this region is having lower heat transfer. (3) Peak Nu shift observed in single swirl jet impingement is also present in this case.
Figure 17. Centerline Nu, Nu surface contour plot, 2D velocity vector and contour plot pics for 1.5D jet impingement condition at Re=3000
Figure 18 shows centerline Nu, surface Nu contour, section velocity vector and contour plots at z/d=6 for 1.5D jet impingement condition.
Observations from this study are given below: (1) With increase in jet to plate distance, heat transfer effectiveness decreases. (2) Though center distance between two jets is smaller (1.5D) we do not observe significant mixing of fluid at the mixing zone as seen in case of z/d=2. Hence heat transfer enhancement is minimal in this case. (3) Area of stagnation region has increased thus resulting in lower heat transfer.
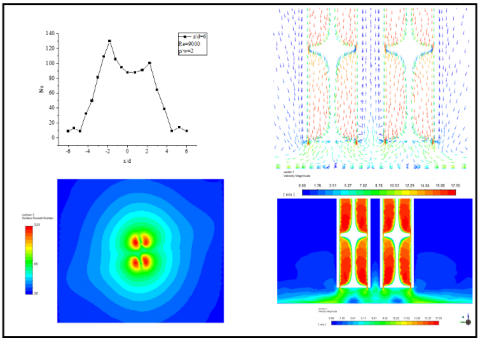
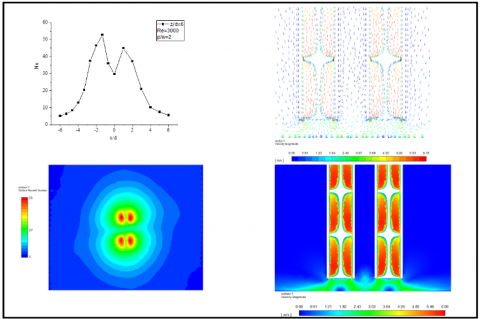
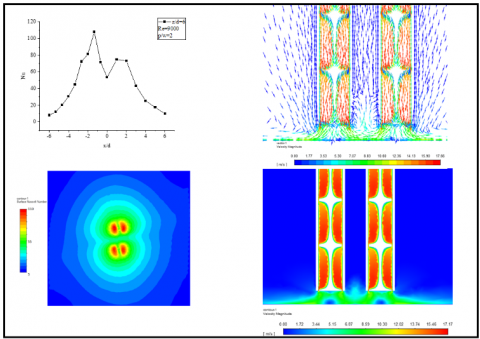
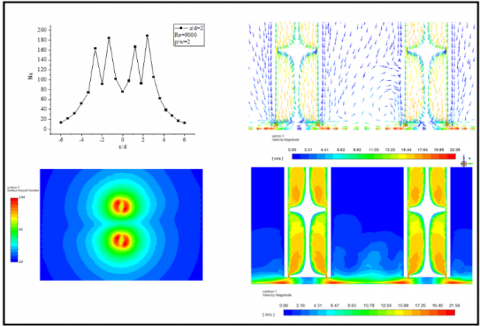
Figure 19 shows centerline Nu, surface Nu contour, section velocity vector and contour plots at z/d=2 for 1.5D jet impingement condition at Re=9000.
Following observations are made from this study: (1) With increase in Re, centerline Nu increases. (2) Combination of swirl and smaller jet to plate distance (z/d=2) helps improve heat transfer in the mixing zone. This helps in increases in centerline Nu at the center of two jets as seen in graph.
Figure 20 shows centerline Nu, surface Nu contour, section velocity vector and contour plots at z/d=6 for 1.5D jet impingement condition at Re=9000.
Figure 18. Centerline Nu, surface Nu contour plot, 2D velocity vector and contour plot pics for 1.5D jet impingement condition at Re=3000
Figure 19. Centerline Nu, surface Nu contour plot, 2D velocity vector and contour plot pics for 1.5D jet impingement condition at Re=9000
Figure 20. Centerline Nu, surface Nu contour plot, 2D velocity vector and contour plot pics for 1.5D jet impingement condition at Re=9000
Following observations are made from this study: (1) With increases in jet to plate distance, heat transfer effectiveness decreases. (2) There is significant increase in stagnation region which leads to weak region of mixing and hence lower heat transfer. Dip in Nu at the center shown in the graph indicates this phenomenon.
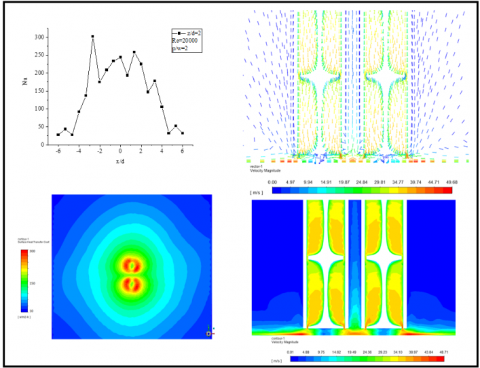
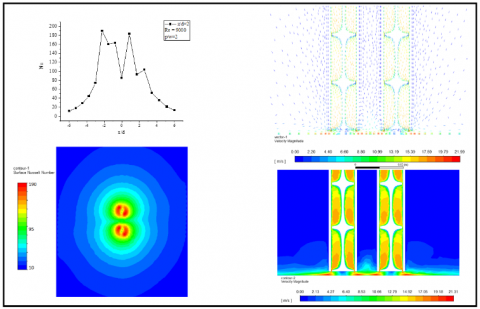
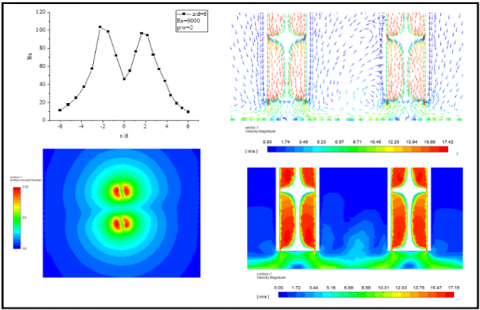
Figure 21 shows centerline Nu, surface Nu contour, section velocity vector and contour plots at z/d=2 for 1.5D jet impingement condition at Re=20000.
Figure 21. Centerline Nu, surface Nu contour plot, 2D velocity vector and contour plot pics for 1.5D jet impingement condition at Re=20000
Following observations are made from this study: (1) Interestingly, even at higher Reynolds number, same trend of centerline Nu distribution continues to be seen. This clearly indicates that heat transfer effectiveness is more at small jet to plate distance and it increases with increase in Re. (2) Smaller distance between jet to plate ensures growth of stagnation region to be restricted. This helps in better mixing, eventually improves heat transfer.
Figure 22 shows centerline Nu, surface Nu contour, section velocity vector and contour plots at z/d=6 for 1.5D jet impingement condition at Re=20000.
Figure 22. Centerline Nu, surface Nu contour plot, 2D velocity vector and contour plot pics for 1.5D jet impingement condition at Re=20000
Following observations are made from this study: (1) With increases in jet to plate distance (z/d=6), strength of jet mixing zone decreases eventually lead to formation of small stagnation region at the center distance between two jets. This causes reduction in heat transfer which is why we see dip in centerline Nu value as seen in Figure. (2) This region of small stagnation is observed in all the above-mentioned cases of z/d=6. (3) Effect Reynolds number on heat transfer for two jets separated by 2D and z/d=2,6.
Figure 23 shows CFD domain with two jet pipes separated by distance of 2D. Jet to plate distance of 2&6 are studied for Re=3000, 9000 and 20000.
Figure 23. CFD domain representation of two jets separated by distance 2D
Figure 24 shows centerline Nu, surface Nu contour, section velocity vector and contour plots at z/d=2 for 2D jet impingement condition at Re=3000.
Figure 24. Centerline Nu, surface Nu contour plot, 2D velocity vector and contour plot pics for 2D jet impingement condition at Re=3000
Following observation can be made from this study: (1) With increases in distance between two jets by 2D, we can observe a stagnation region formation between two jets. We also observe that mixing zone diminishes a bit as the strength of flow that were mixing together due to smaller distance has decreased in this case. This overall does not help achieve good heat transfer on the surface. (2) However, we also observe that peak Nu does not change much w.r.t 1.5D case.
Figure 25 shows centerline Nu, surface Nu contour, section velocity vector and contour plots at z/d=6 for 2D jet impingement condition at Re=3000.
Following observation can be made from above study: (1) With increase in distance between jets to 2D and jet to plate distance to z/d=6, spread of jet impinging out has increased. However, strength of mixing decreases resulting in lower heat transfer. (2) Increase in area of stagnation region also is responsible for lower heat transfer.
Figure 26 shows centerline Nu, surface Nu contour, section velocity vector and contour plots at z/d=2 for 2D jet impingement condition at Re=9000.
Figure 25. Centerline Nu, surface Nu contour plot, 2D velocity vector and contour plot pics for 2D jet impingement condition at Re=3000
Figure 26. Centerline Nu, surface Nu contour plot, 2D velocity vector and contour plot pics for 2D jet impingement condition at Re=9000
Following observation can be made from above study: (1) Same trend of centerline distribution is seen when compared to Re=3000 case. As we know that heat transfer increases with Re, we observe higher heat transfer rates in the centerline Nu plot as well as contour plot. (2) Zone of mixing between the two jets is again seen to diminish resulting in lower heat transfer.
Figure 27 shows centerline Nu, surface Nu contour, section velocity vector and contour plots at z/d=6 for 2D jet impingement condition at Re=9000.
Following observation can be made from above study: (1) With increase in jet to plate distance (z/d=6), momentum of two jets mixing strength weakens similar to earlier case of Re=3000. This is clearly visible in velocity vector plot. (2) Phenomena of peak Nu shift due to swirl tape is still seen. But the axisymmetric nature of centerline Nu distribution is not present as seen in earlier case of single jet impingement studies. This is more to do with the influence of mixing zone.
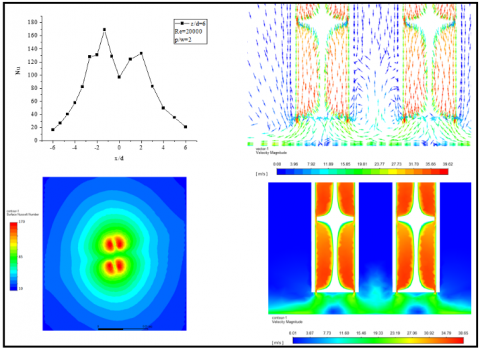
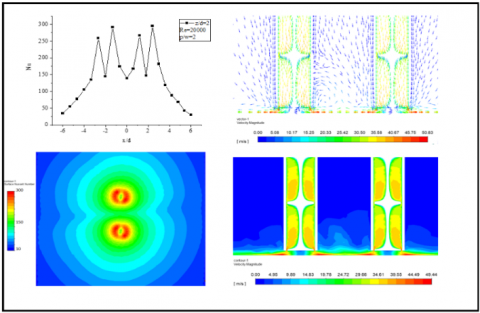
Figure 28 shows centerline Nu, surface Nu contour, section velocity vector and contour plots at z/d=2 for 2D jet impingement condition at Re=20000. Following observation can be made from above study: (1) we observe similar pattern of flow behavior as well as centerline Nu distribution in higher Re case when compared to Re=9000 & 3000. (2) Heat transfer is more with increase in Re which depicts the peak Nu distribution nature in the graph of centerline Nu in figure above.
Figure 29 shows centerline Nu, surface Nu contour, section velocity vector and contour plots at z/d=6 for 2D jet impingement condition at Re=20000.
Figure 27. Centerline Nu, surface Nu contour plot, 2D velocity vector and contour plot pics for 2D jet impingement condition at Re=9000
Figure 28. Centerline Nu, surface Nu contour plot, 2D velocity vector and contour plot pics for 2D jet impingement condition at Re=20000
Figure 29. Centerline Nu, surface Nu contour plot, 2D velocity vector and contour plot pics for 2D jet impingement condition at Re=20000
Following observation can be made from above study: (1) Jet spread increases with increase in jet to plate distance (z/d=6). (2) Heat transfer decreases because of increase in jet to plate distance. (3) Lot of recirculating zones is observed in zone of mixing of two jets. However, when compared to z/d=2 case, strength of mixing has diminished. (4) Effect Reynolds number on heat transfer for two jets separated by 3D and z/d=2,6.
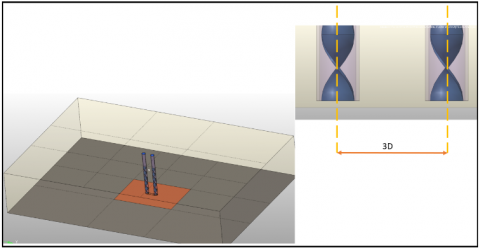
Figure 30. CFD domain representation of two jets separated by distance 3D
Figure 31. Centerline Nu, surface Nu contour plot, 3D velocity vector and contour plot pics for 3D jet impingement condition at Re=3000
Figure 30 shows CFD domain for the above-mentioned condition. Jet to plate distance of z/d=2 and z/d=6 is studied in this case with two jets separated by distance 3D.
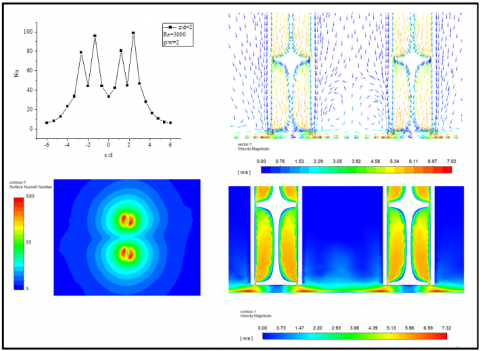
Figure 31 shows centerline Nu, surface Nu contour, section velocity vector and contour plots at z/d=2 for 3D jet impingement condition at Re=3000.
Following observation can be made from above study: (1) With increase in distance between two jets by 3D, we observe that strength of mixing zone decreases. This has resulted in decrease in heat transfer at the center. (2) We observe localized heat transfer enhancement but due to increase in jet distance, centralized heat transfer enhancement is not seen. This is also clear in the plot of centerline Nu.
Figure 32 shows centerline Nu, surface Nu contour, section velocity vector and contour plots at z/d=6 for 3D jet impingement condition at Re=3000.
Following observation can be made from above study: (1) With increase in jet to plate distance and jet to jet distance, heat transfer effectiveness is localized to area of spread of jet as seen in Nu contour plot. Heat transfer is more effective in localized region and hence we see two spikes in centerline Nu plot. (2) We can see the region of detachment of jet at the center distance of two jets. Hence there is sudden dip in Nu at center.
Figure 33 and 34 shows centerline Nu, surface Nu contour, section velocity vector and contour plots at z/d=2 and z/d=6 for 3D jet impingement condition at Re=9000.
Figure 32. Centerline Nu, surface Nu contour plot, 3D velocity vector and contour plot pics for 3D jet impingement condition at Re=3000
Figure 33. Centerline Nu, surface Nu contour plot, 3D velocity vector and contour plot pics for 3D jet impingement condition at Re=9000
Figure 34. Centerline Nu, surface Nu contour plot, 3D velocity vector and contour plot pics for 3D jet impingement condition at Re=9000
Following observation can be made from above study: (1) With increase in Reynolds number, heat transfer increases in both z/d=2 &6 when compared to Re=3000. However, it is seen that for z/d=6 heat transfer is not that effective as in case of z/d=2. (2) Also as already pointed out previously, with increase in z/d distance, we observe that the current jet to jet distance is not efficient in increasing the heat transfer.
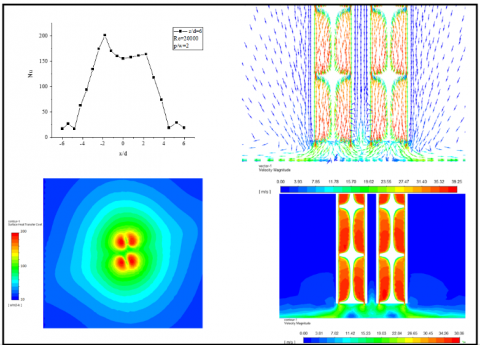
Figure 35 and 36 shows centerline Nu, surface Nu contour, section velocity vector and contour plots at z/d=2 and z/d=6 for 3D jet impingement condition at Re=20000.
Figure 35. Centerline Nu, surface Nu contour plot, 3D velocity vector and contour plot pics for 3D jet impingement condition at Re=20000
Figure 36. Centerline Nu, surface Nu contour plot, 3D velocity vector and contour plot pics for 3D jet impingement condition at Re=20000
Following observation can be made from above work: (1) For z/d=2, heat transfer effectiveness is high. However, there is a drop is effectiveness at the region of mixing of jets. This is because of the distance between two jets as in this case it is 3D. (2) For z/d=6, heat transfer further drops when compared to z/d=2.
Local heat transfer distribution on flat plate surface for swirling jet impingement generated through swirl tape of T.R=2 is studied experimentally for jet to plate distance of z/d=2 to 8 and Reynolds number between 3000 to 9000. Following conclusion is made from the above-mentioned study: (1) For jet to plate distance of z/d=2, higher heat transfer rate is observed when compared to other z/d cases for all the Reynolds number studies in the present work. (2) Swirl generator helps in improving heat transfer by creating a swirling flow that impinges on target plate with higher impact for z/d=2. As we move away from the target plate, heat transfer effectiveness decreases. This is due to decrease in momentum of flow and increase in spread of flow. (3) We observe that there is shift of peak Nu for all z/d cases and also for all Re. This phenomenon of Nu shift is due to swirl strength which is caused due to twisted tape.
The present work was further evaluated using CFD approach. Widely used CFD code ANSYS-Fluent was used to get a correlation of experiment done in the work. Peak Nu profile match with experiment was obtained from CFD for jet to plate distance of z/d=2 and Re=3000. Further this study was extended for flow with high Re (Re=20000). Following conclusions and observations are made from this study: Heat transfer increases with increases in Re. A linear numerical correlation is established between Peak Nu and Re which clearly explains the dependency of heat transfer on Re.
Further the present work was extended numerically to study the effect of jet to jet spacing on heat transfer. This study was conducted for two jets spaced at 1.5D, 2D and 3D with z/d varying between 2 to 6 and Re=3000,9000 and 20000. Same configuration of swirl tape with T.R=2 was used in this study. Following conclusion and observations are made from this study: (1) Regardless of any Re, z/d=2 and 1.5D is more effective in improving heat transfer. It is seen that a strong mixing zone is created between the two jets. This helps in more heat transfer as centerline peak Nu calculated is higher even in mixing zone. (2) With increases in jet to plate distance in case of 1.5D distance, strength of mixing zone decreases resulting in drop of peak Nu. This hypothesis is true in case of all the Re studied. (3) As we increase jet to jet distance to 2D and 3D, it is seen that zone of separation between two jets become more prominent. Even at jet to plate distance of z/d=2, heat transfer enhancement gets more confined to localized area of jet expansion. This is true for all Re cases studied as well as for higher z/d case. It can be concluded that more the distance (2D, 3D etc.), mixing zone or wall jet zone of two jets diminishes. This results in decrease in heat transfer. (4) It is observed that with increase in jet to plate distance (z/d=6), swirl spread increases which leads to increase in stagnation zone area just below the area covering the twisted tape. This leads to decrease in heat transfer locally at stagnation region. Thus, we observe a drop in centerline Nu at the stagnation region. This is true for all Reynolds number cases studied.
Limitations and future research directions of present work are listed below: (1) Present experimental study ware performed for Re up to 9000. However, this study can be further extended for higher Re up to 20000 and an experimental correlation for Peak Nu and Re can be established for different jet to plate distances. (2) Different swirl tapes with T.R can be used and investigated either experimentally or numerically to see their effect on heat transfer enhancement.
[1] Katti, V., Prabhu, S.V. (2008). Experimental study and theoretical analysis of local heat transfer distribution between smooth flat surface and impinging air jet from a circular straight pipe nozzle. International Journal of Heat and Mass Transfer, 51(17-18): 4480-4495. https://doi.org/10.1016/j.ijheatmasstransfer.2007.12.024
[2] Katti, V.V., Yasaswy, S.N., Prabhu, S.V. (2011). Local heat transfer distribution between smooth flat surface and impinging air jet from a circular nozzle at low Reynolds numbers. Heat and Mass Transfer, 47(3): 237-244. https://doi.org/10.1007/s00231-010-0716-1
[3] Gulati, P., Katti, V., Prabhu, S. V. (2009). Influence of the shape of the nozzle on local heat transfer distribution between smooth flat surface and impinging air jet. International Journal of Thermal Sciences, 48(3): 602-617. https://doi.org/10.1016/j.ijthermalsci.2008.05.002
[4] Martin, H. (1977). Heat and mass transfer between impinging gas jets and solid surfaces. Advances in Heat Transfer, 13: 1-60. https://doi.org/10.1016/S0065-2717(08)70221-1
[5] Lytle, D., Webb, B.W. (1994). Air jet impingement heat transfer at low nozzle-plate spacings. International Journal of Heat and Mass Transfer, 37(12): 1687-1697. https://doi.org/10.1016/0017-9310(94)90059-0
[6] Gardon, R., Cobonpue, J. (1962). Heat transfer between a flat plate and jets of air impinging on it. Int. Dev. Heat Transf. ASME, 454-460.
[7] Gardon, R., Akfirat, J.C. (1965). The role of turbulence in determining the heat-transfer characteristics of impinging jets. International Journal of Heat and Mass Transfer, 8(10): 1261-1272. https://doi.org/10.1016/0017-9310(65)90054-2
[8] Gardon, R., Akfirat, J.C. (1966). Heat transfer characteristics of impinging two-dimensional air jets. Journal of Heat Transfer, 88(1): 101-107. https://doi.org/10.1115/1.3691449
[9] Jambunathan, K., Lai, E., Moss, M., Button, B.L. (1992). A review of heat transfer data for single circular jet impingement. International Journal of Heat and Fluid Flow, 13(2): 106-115. https://doi.org/10.1016/0142-727X(92)90017-4
[10] Zuckerman, N., Lior, N. (2005). Impingement heat transfer: correlations and numerical modeling. Journal of Heat Transfer, 127(5): 544-552. https://doi.org/10.1115/1.1861921
[11] Viskanta, R. (1993). Heat transfer to impinging isothermal gas and flame jets. Experimental Thermal and Fluid Science, 6(2): 111-134. https://doi.org/10.1016/0894-1777(93)90022-B
[12] Hoogendoorn, C.J. (1977). The effect of turbulence on heat transfer at a stagnation point. International Journal of Heat and Mass Transfer, 20(12): 1333-1338. https://doi.org/10.1016/0017-9310(77)90029-1
[13] Alekseenko, S.V., Bilsky, A.V., Dulin, V.M., Markovich, D.M. (2007). Experimental study of an impinging jet with different swirl rates. International Journal of Heat and Fluid Flow, 28(6): 1340-1359. https://doi.org/10.1016/j.ijheatfluidflow.2007.05.011
[14] Gupta, A.K., Lilley, D.G., Syred, N. (1984). Swirl Flow. Great Britain: Abacus Press.
[15] Huang, L., El-Genk, M.S. (1998). Heat transfer and flow visualization experiments of swirling, multi-channel, and conventional impinging jets. International Journal of Heat and Mass Transfer, 41(3): 583-600. https://doi.org/10.1016/S0017-9310(97)00123-3
[16] Bakirci, K., Bilen, K. (2007). Visualization of heat transfer for impinging swirl flow. Experimental Thermal and Fluid Science, 32(1): 182-191. https://doi.org/10.1016/j.expthermflusci.2007.03.004
[17] Wen, M.Y., Jang, K.J. (2003). An impingement cooling on a flat surface by using circular jet with longitudinal swirling strips. International Journal of Heat and Mass Transfer, 46(24): 4657-4667. https://doi.org/10.1016/S0017-9310(03)00302-8
[18] Brown, K.J., Byrne, G., O'Donovan, T.S., Murray, D.B. (2012). Effect of thermal boundary condition on heat dissipation due to swirling jet impingement on a heated plate. Journal of Physics: Conference Series, 395(1): 012039. https://doi.org/10.1088/1742-6596/395/1/012039
[19] Eiamsa-ard, S., Nuntadusit, C., Wongcharee, K., Chuwattanakul, V. (2018). An impingement cooling using swirling jets induced by helical rod swirl generators. International Journal of Turbo & Jet-Engines, 35(3): 241-250. https://doi.org/10.1515/tjj-2016-0043
[20] Kumar, S.S., Hindasageri, V., Prabhu, S.V. (2017). Local heat transfer distribution on a flat plate impinged by a swirling jet generated by a twisted tape. International Journal of Thermal Sciences, 111: 351-368. https://doi.org/10.1016/j.ijthermalsci.2016.09.009
[21] Gudi, A., Hindasageri, V. (2022). Novel method to improve heat transfer rate through delta swirl tape for a swirl jet impingement study. International Journal of Heat and Technology, 40(3): 715-721. https://doi.org/10.18280/ijht.400308
[22] Shuja, S.Z., Yilbas, B.S., Rashid, M. (2003). Confined swirling jet impingement onto an adiabatic wall. International Journal of Heat and Mass Transfer, 46(16): 2947-2955. https://doi.org/10.1016/S0017-9310(03)00073-5
[23] Shuja, S.Z., Yilbas, B.S. (2001). A laminar swirling jet impingement on to an adiabatic wall-Effect of inlet velocity profiles. International Journal of Numerical Methods for Heat & Fluid Flow, 11(3): 237-254. https://doi.org/10.1108/09615530110392104
[24] Uddin, N., Neumann, S.O., Weigand, B. (2008). Large eddy simulation of the heat transfer due to swirling and non-swirling jet impingement. In Heat Transfer Summer Conference, 48487: 645-652. https://doi.org/10.1115/HT2008-56422
[25] Amini, Y., Mokhtari, M., Haghshenasfard, M., Gerdroodbary, M.B. (2015). Heat transfer of swirling impinging jets ejected from Nozzles with twisted tapes utilizing CFD technique. Case Studies in Thermal Engineering, 6: 104-115. http://dx.doi.org/10.1016/j.csite.2015.08.001
[26] Gudi, A., Hindasageri, V. (2022). Heat transfer from a hybrid pulsating and swirling air jet impingement. International Journal of Heat and Technology, 40(2): 489-496. https://doi.org/10.18280/ijht.400217
[27] Yang, D., Xie, J., Wang, J., Shu, Z. (2019). Effects of jet arrangement and jet height on flow characteristics of air impingement. Journal of Chemical Engineering of Japan, 52(2): 179-184. http://dx.doi.org/10.1252/jcej.18we007
[28] Cano, J.S., Cordova, G.D., Narvaez, C., Segura, L., Carrion, L. (2019). Experimental study of the incidence of changing a synthetic jet orifice in heat transfer using a Taguchi method approach. Journal of Thermal Science and Engineering Applications, 11(3): 031011. http://dx.doi.org/10.1115/1.4042351
[29] Moffat, R.J. (1988). Describing the uncertainties in experimental results. Experimental Thermal and Fluid Science, 1(1): 3-17. https://doi.org/10.1016/0894-1777(88)90043-X
[30] FLUENT 18 help manual, ANSYS, Inc.