Yinghua Tan | Yang Li | Hao Wu* | Min Tang | Yachao Hu
© 2022 IIETA. This article is published by IIETA and is licensed under the CC BY 4.0 license (http://creativecommons.org/licenses/by/4.0/).
OPEN ACCESS
Numerical simulation and analysis on the responses of steel beam under fire thermal load and blast load are performed using ABAQUS general finite element program. In this study, two cases with different order of applying the fire thermal load and blast load in a different order are considered: 1) when the steel beam is heated by fire first and then is impacted by blast load, the influence of the temperature on the pulse amplitude–impulse (P-I) diagrams is discussed and the saturated impulse and the minimum impulse related to temperature are analyzed. 2) when steel beam is impacted by blast loading first and then is attacked by fire, the influences of the initial static load and the pulse amplitude on the critical temperature-impulse (Tcr-I) diagrams are analyzed. The analysis results show that the higher the temperature is, the lower the impact resistance capability of steel beam is. The saturated impulse and the minimum impulse can be used to measure the impact resistance capability of steel beam. The impulse I(ηD) can be used to measure the fire resistance performance of steel beam. The blast load can obviously reduce the fire resistance capability of steel beam.
steel beam, fire thermal load, blast load, pulse amplitude–impulse diagrams, critical temperature
Steel structures are widely used in modern buildings due to its advantages of high strength, light weight, well shock resistant, etc. However, there will be a serious threat to human life and property security if the steel structures are subjected to fire thermal load and blast load. Therefore, it is necessary to clarify the fire and blast resistance capability of steel structures.
As is known to all, a great number of researches have been carried out to analyze the responses of steel structures under separate blast or fire loads.
Yuan et al. [1] analyzed the influence of the standoff distance on large inelastic deformation of square steel plates under blast load through experiment and numerical simulation. Ramezannejad Azarboni and Darvizeh [2] investigated the effect of strain rate on the cavitation time and elastoplastic deformation of steel rectangular plate subjected to blast load. Considering the strain rate influence, the effects of charge mass and standoff on occur of cavitation and time dependent deflection and velocity of a rectangular plate are studied. Fu et al. [3] studied the scaling of the dynamic response of strain-rate sensitive armor steel subjected to air blast load. Zhang et al. [4] created pipe–soil interaction models in soil and rock layers under two-point explosive loads to investigate the mechanical response of a buried steel pipe under multiple explosions.
Pancheti et al. [5] carried out the full-scale standard fire tests of external light-gauge steel-framed (LSF) walls with corrugated steel cladding exposed to fire on the external side. The research results showed that fire resistance levels (FRLs) of external LSF wall systems had improved more than 40% due to the addition of thin steel cladding. Tao et al. [6] conducted four full-scale load-bearing standard fire tests to investigate the performance of cold-formed steel square and rectangular hollow section (CFS SHS/RHS) stud walls exposed to fire. The test results showed that CFS SHS/RHS stud walls achieved a higher fire resistance level due to their superior elevated temperature mechanical properties, while the temperature development exhibited good similarity with uninsulated lipped channel section stud walls of the same wall configuration. Pires et al. [7] performed a series of 10 fire resistance tests on steel columns built up from cold-formed steel (CFS) profiles, and created a numeric, three dimensional non-linear finite element model for simulating the behavior of these columns. It is observed that plasterboard hollow encasement can be used to increase the fire resistance performance of built-up cold-formed steel columns. Xing et al. [8] presented eight full-scale anisothermal fire tests on grade 1.4301laser-welded austenitic stainless steel I-section columns. It is obtained that the design method of Kucukler et al. [9] provided more reliable ultimate strength predictions for austenitic stainless steel I-section columns in fire.
However, the research on the properties of steel structures under combined blast and fire loads is relatively less. The analysis of the response of steel structures under combined blast and fire loads becomes more important after the “911” event in the United States.
As to the nonlinear response of steel frame under explosion and fire loads, Song et al. [10] and Izzuddin et al. [11] proposed an adaptive numerical analysis method to evaluate the influence of blast loading on the fire resistance capability of steel structures.
Chen and Liew [12-14] adopted the mixed element method to analysis the steel frame that locally impacted by the blast loading and caused the fire. The response behaviors of steel structures under both the blast and fire loading were studied, and the influence of blast loading on the fire resistance capability of multistory steel frames was elaborated. Yu and Liew [15-16] analyzed the situation that frame structure was impacted by explosive load and cause a fire.
Sun et al. [17] performed experiments on Q345B steel tubes, and employed scanning electron microscopy to explore the rupturing mechanism under a microscope. In order to predict the behavior and failure of steel columns subjected to blast pressure followed by fire, Al-Thairy [18] developed a new numerical model to perform both dynamic and transient thermal analyses simultaneously using the dynamic fully coupled thermal-displacement analysis procedure within ABAQUS/explicit. And a new simplified approach was proposed for analyzing the combined effects of blast and fire on the response and critical temperature of steel columns. Jiang et al. [19] carried out field tests to study the blast-resisting performance of Q390B mild steel circular tubes after exposure to natural fire. The engineering calculation formulas for the influences of the temperature and the blast scaled distance on the global deflection of the circular tubes were established. Clough and Clubley [20] studied the response of steel columns to combined pre-cursor thermal and long duration blast loads. The numerical and computational methods appropriate to predict the response of steel columns subject to focused thermal and long duration blast loads were investigated. Xi [21, 22] also made some discussion about the dynamic response and critical temperature of steel beam subjected to both fire and explosion loads.
Research about the interactions of fire and blast loads is relatively less among the present study. The influence of blast load on the fire resistance of steel beam, and the influence of high temperature on the blast resistance capability of steel beam are studied in this paper. It’s known that the lower left area of P-I diagram is safety area for structural blast resistance design. The blast resistant ability of steel structure improved with the safety area expansion. The P-I diagram can be used as the basis for design and performance evaluation of steel structure. Critical temperature is an important indicator of the steel structure fire resistance. The effect of the fire temperature on the P-I diagram and the effect of the blast load on the Tcr-I diagram are respectively analyzed in this paper.
Note that mild steel was sensitive to strain rate and temperature, so the constitutive parameters related to temperature and strain rate should be used in the simulation analysis.
2.1 The constitutive model of steel under different temperature
Temperature has a significant influence on the constitutive relationship of steel, the yield strength and elastic modulus of steel material under high temperature will decrease with decreasing temperature. In this paper, the elastic modulus and yield strength of steel were determined according to the reduction factors of steel material performance under different temperature in regulations of EC3 [23]. The reduction factors of steel material performance in EC3 are listed in Table 1.
In Table 1, the elastic modulus and yield stress of the steel were presented as ET, σsT, respectively, when the temperature T was larger than 20°. Under the room temperature T of 20℃, the elastic modulus of the steel E was adopted as 205 GPa, the yield stress of the steel σs was taken as 399 MPa, and the mass density of the steel was adopted as 7850 kg/m3. Furthermore, the temperature has small influence on poisson's ratio of steel. The poisson's ratio υ of steel under high temperature was adopted as 0.3, the same to that under room temperature.
By referring to the stipulation of the code BS5970: Part 8, the expansion coefficient of steel is assumed to be a constant α=1.4×10⁻⁵.
2.2 Constitutive model of steel under the blast load
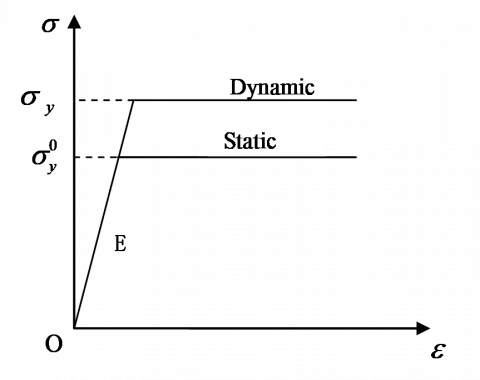
In the analysis of the dynamic behavior of steel structure subjected to blast load, the strain rate effect could not be ignored. Based on the ideal elastoplastic model, the Cowper-Symonds (C-S) constitutive model according to strain rate was adopted in this paper. The constitutive equation of Cowper-Symonds was as follows:
$\sigma_y=\left[1+\left(\frac{\dot{\varepsilon}}{D}\right)^{\frac{1}{q}}\right] \sigma_y^0$ (1)
where, σy is the dynamic yield stress considering the effect of strain rate; σy0 is the static yield stress; $\dot{\varepsilon}$ is the equivalent plastic strain rate; and D and q is the strain rate effect parameters of Cowper-Symonds.
The relationship between stress and strain of C-S model is shown in Figure 1.
Figure 1. Stress-strain relationship of C-S model
Table 1. Reduction coefficient of modulus of elasticity and yield strength for various temperatures
|
T (℃) |
20 |
100 |
200 |
300 |
400 |
500 |
600 |
700 |
800 |
900 |
1000 |
1100 |
|
ET/E |
1.0 |
1.0 |
0.9 |
0.8 |
0.7 |
0.6 |
0.31 |
0.13 |
0.09 |
0.0675 |
0.045 |
0.0225 |
|
$\sigma_s^T / \sigma_s$ |
1.0 |
1.0 |
1.0 |
1.0 |
1.0 |
0.78 |
0.47 |
0.23 |
0.11 |
0.06 |
0.04 |
0.02 |
Strain rate parameters of steel under normal temperature, D and q, were adopted as 40, and 5, respectively, as suggested by Izzuddin [11], Chen presented that the strain rate effect of steel could be ignored when the temperature reached a certain temperature, and the strain rate parameters, D and q, were adopted as 400 and 1, respectively. Assuming that the temperature of strain rate failure was 1000℃, the two strain rate parameters D(T), q(T) related to temperature were obtained through the interpolation of strain rate parameters under normal temperature and high temperature.
3.1 Calculation model
ABAQUS general finite element program [24] is used to simulate the responses of steel beam under both fire thermal load and explosion load, and study the interplay of fire load and explosion load. The computation model of ABAQUS is as follows:
The adopted structure model is H shape steel beam clamped on both ends, as shown in Figure 2. Its dimensions are as follows: span length L=1.5m, height of cross-section H=0.046m, width of flange B=0.046m, thickness of flange tf=0.0052m, thickness of web tw=0.0038m.
The material constants of steel at normal temperature: Mass density r=7850kg/m, elastic modulus E=205GPa, yield strength ss=399MPa.
Figure 2. Schematic diagram of calculation model of steel beam
Beam21 is used in simulation. This element is based on the theory of Timoshenko Beam. It can be used to simulate thick beam, as well as slender beam. The unit number of steel beam is set to 20.
And according to the above description of the constitutive model of steel under explosion load and different temperatures, the constitutive model of steel beam under fire and explosion loads is obtained.
3.2 Loading scheme and failure criteria
Steel beam firstly beard the transverse uniformly distributed static load p transferring from the upper structure of beam, then was subjected to the fire load and blast load P, considering two cases that applying fire and blast load in different order. In the process of numerical simulation, the whole process was divided into three load steps to calculate. The first load step applied transverse uniformly distributed load p. According to the order of fire and blast load applied on the steel beam, the second, third load step applied blast and fire load or fire and blast load respectively. The schematic diagram of computing model of steel beam is as shown in Figure 2. The static load ratio is defined as η=p/pc. pc is the static plastic limit load, pc=16Mp/L2=63.82kN, and Mp is the plastic limit bending moment of beam.
The P-I diagram of steel beam is obtained from the displacement failure criterion in this study. When the largest permanent deflection of steel beam is equal to L/10, the peak amplitude P of explosion load and the impulse I are taken as ordinate and abscissa, respectively, and then the iso-damage curve, i.e. P-I curve, is obtained. Critical temperature is an important indicator for the fire resistance performance of steel structure. According to the displacement failure criterion regulated in EC3 (1993), when the maximum deflection of steel beam is L/10, the temperature is identified as the critical temperature.
3.3 Fire load
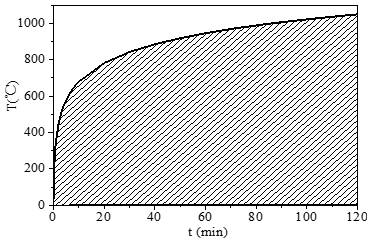
The heating process curve of ambient temperature in the fire used the standard heating up curve ISO834 (see Figure 3) recommended by International Standards Organization (ISO), and its expression was as follows:
Tt =345 log (8t+1)+20 (2)
Figure 3. ISO834 standard temperature time
3.4 Blast load
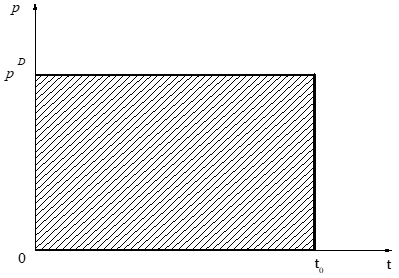
The ideal rectangular pulse load was shown in Figure 4. In Figure 4, P is the load amplitude of pulse, t0 is the pulse duration, the impulse is defined as I=Pt0, and the dynamic load ratio is defined as ηD=P/PC, (PC=pc).
Figure 4. The rectangular pulse load
For the steel beam under the combined action of fire and explosion loads, there was a lack of testing data available in the open literature. Therefore, it is difficult to conduct a complete verification for the finite element model. Instead, the finite element model will be verified against the test data in the literature, only under separate explosion or fire loads.
4.1 The validation of numerical simulation model under fire load
4.1.1 Fire experiment
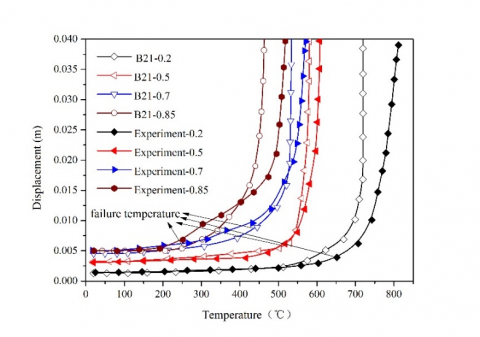
Rubert and Schaumann [25] carried out a series of tests on simply supported beams with a single load being applied in the mid-span. The beams, under constant load, were heated uniformly along their entire length. The temperature-displacement curves of the midpoint of the steel beam under four load ratios (h=0.2, 0.5, 0.7, 0.85) were obtained in experiments. And the curves are used to verify the effectiveness of the numerical simulation model without considering explosion load. When the temperature reach a certain value, the displacement will sharply increase, resulting in the failure of the structure. The corresponding temperature can be defined as failure temperature.
Tests were conducted on IPE 80 H shape steel beam, as shown in Figure 5. Its dimensions are as follows: span length L=1.14m, height of cross-section H=0.08m, width of flange B=0.046m, thickness of flange tf=0.0052m, and thickness of web tw=0.0038m. The material constants of steel beam at normal temperature: Density r=7850kg/m, elastic modulus E=210GPa, yield strength $s_{s}$=399MPa. The reduction factors of steel material performance adopted here are the same to that in Table 1.
Figure 5. Simplified model of simply supported beam in fire experiment
4.1.2 Comparison of simulation and fire experiment results
The temperature-displacement curves obtained from fire experiments and numerical simulation without considering explosion load are shown in Figure 6. It can be seen that the simulation results agree well with the test results. Figure 6 shows that the failure temperatures of simulation are nearly the same to that in tests. Therefore, the numerical simulation model is effective to simulate the action of fire load.
Figure 6. Comparison of the temperature-displacement curves in the mid-span of beam
4.2 The validation of numerical simulation model under explosion load
4.2.1 Explosion experiment
Symonds and Jones [26] presented the test data for several groups of fully clamped beams under impulsive velocity. These test data are now used to verify the numerical simulation model at normal temperature.
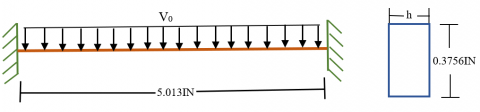
Du Pont Detasheet explosive was used in all the tests as the means of applying the initial momentum to each specimen. This sheet explosive covered the entire surface area on the top of the beam. A number of beams with the same thickness (h) were tested under different intensities of loading which were obtained by varying the number of explosive sheets. All the beam specimens were made from the same material (mild steel) and with a constant span (2l=5.013 IN, l is the half-span of beam), and a constant width (b=0.3756 IN), as shown in Figure 7.
Figure 7. Simplified model of fully clamped beams in explosion experiment
Material properties of the beams in tests: mass density r=0.732´10-3 lb.sec2/in4, yield strength $\sigma_{0}$=30.5´103 lb /in2, elastic modulus E=30´106 lb/in2, constant in strain-rate sensitivity law D=40sec-1, exponent in strain-rate sensitivity law q=5 sec-1.
$\lambda$ is the impulse parameter, and its expression is as follows:
$\lambda=m l^2 V_0^2 / h M_0$ (3)
where, m is mass per unit length of beam, l is the half-span of beam, the span of beam is 5.013IN, V0 is the initial uniform velocities, h is the thickness of steel beam, M0 is the static fully plastic (limit) moment of beam, M0=$\sigma_{0}$bh2/4, b is the breadth of beam, b=0.3756 IN.
The maximum final deflection of all the beam specimens δ were obtained in the experiments.
4.2.2 Comparison of simulation and explosion experiment results
The numerical simulation model at normal temperature is used to simulate these experiments. In simulation, the explosion load is applied on the beam in the form of initial uniform velocities V0. And V0 is derived from Eq. (3). The strain-rate effect is considered in the process of simulation. The comparison of experiment results and numerical results is shown in Table 2. From Table 2, it can be see that the maximum final deflection of steel beam obtained from numerical simulation agrees well with the experiment data. Therefore, the numerical simulation model with strain-rate effect is effective to simulate the behavior of steel beam under explosion load.
Table 2. Comparison of experimental data and numerical results
|
No. |
H(in) |
V0(m/s) |
λ |
δ (m) |
δ/h |
||
|
Test |
Numerical |
Test |
Numerical |
||||
|
1 |
0.1097 |
38.324 |
114.1 |
0.007 |
0.010 |
2.616 |
3.714 |
|
2 |
0.1097 |
55.466 |
239 |
0.011 |
0.011 |
3.965 |
3.912 |
|
3 |
0.1098 |
32.14 |
80.1 |
0.006 |
0.005 |
2.295 |
1.900 |
|
4 |
0.1097 |
49.972 |
194 |
0.011 |
0.010 |
3.774 |
3.445 |
|
5 |
0.0922 |
72.372 |
576 |
0.016 |
0.015 |
6.855 |
6.320 |
|
6 |
0.0924 |
67.440 |
498 |
0.015 |
0.014 |
6.461 |
5.880 |
|
7 |
0.0922 |
64.605 |
459 |
0.013 |
0.013 |
5.401 |
5.594 |
|
8 |
0.0922 |
47.822 |
251.5 |
0.009 |
0.009 |
3.796 |
3.886 |
|
9 |
0.0922 |
35.360 |
137.5 |
0.007 |
0.006 |
3.200 |
2.605 |
|
10 |
0.1582 |
41.619 |
64.7 |
0.010 |
0.008 |
2.446 |
1.891 |
|
11 |
0.1582 |
34.632 |
44.8 |
0.007 |
0.006 |
1.802 |
1.456 |
|
12 |
0.1581 |
30.372 |
34.5 |
0.006 |
0.005 |
1.512 |
1.195 |
|
13 |
0.1582 |
24.352 |
22.15 |
0.004 |
0.003 |
1.106 |
0.846 |
|
14 |
0.1581 |
25.067 |
23.5 |
0.004 |
0.004 |
1.063 |
0.872 |
|
15 |
0.1902 |
35.951 |
33.4 |
0.007 |
0.006 |
1.367 |
1.283 |
|
16 |
0.1902 |
30.284 |
23.7 |
0.006 |
0.005 |
1.320 |
0.994 |
|
17 |
0.1905 |
28.072 |
20.3 |
0.005 |
0.004 |
1.024 |
0.868 |
|
18 |
0.1901 |
21.699 |
12.18 |
0.003 |
0.003 |
0.626 |
0.580 |
|
19 |
0.158 |
21.525 |
17.35 |
0.003 |
0.003 |
0.848 |
0.698 |
|
20 |
0.2368 |
13.919 |
3.23 |
0.001 |
0.001 |
0.236 |
0.233 |
5.1 The temperature effect analysis on P-I diagram under the action of fire and blast load successively
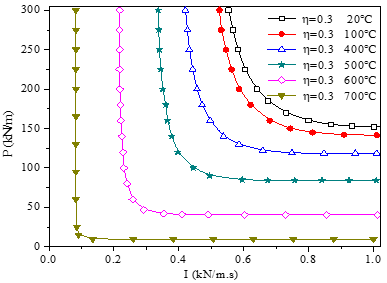
Assuming that the temperature distribution of steel beam in fire is uniform, the P-I diagram of steel beam is obtained according to displacement failure criterion. When the largest permanent deflection of steel beam equals L / 10, the blast load amplitude P is taken as ordinate, and the corresponding impulse I is taken as abscissa, then the P-I curves under different temperature are obtained, as shown in Figure 8. The lower left area of P-I curve decreases significantly with the increase of temperature. This shows that the fire temperature can significantly affect the blast resistance capability of steel beam.
As shown in Figure 9, the blast resistance capability of steel beam decreases with the increase of static load ratio. By comparison of Figure 8 and Figure 9, it can be seen that the influence of temperature on the blast resistance capability of steel beam is larger than that of the initial static load.
Figure 8. The P-I diagram of steel beam for various temperatures
Figure 9. The P-I diagram of steel beam for various static load ratios
Figure 10. P-I diagram at 100℃
Krauthammer et al. [27] pointed out that there exists two asymptotes for the P-I curve:an impulse asymptote I=Ii, and a quasi-static asymptote P=PS. Each curve obtained by numerical calculation exists two asymptotes, as shown in Figure 10 and Figure 11. P-I curve is an isodamage curve that maximum deflection equals L/10. Li and Meng [28] pointed out that each isodamage P-I curve can be divided into three sections, namely the impulse loading section, dynamic loading section and quasi static loading section(corresponding to RegimeⅠsection, RegimeⅡsection, Regime Ⅲ section in Figure 11, respectively). In this study, the close degree of P-I curve to the asymptote is taken as the basis of dividing section. When the impulse increment is 0.1 kN/m.s, if the pulse load amplitude difference is less than 0.15 kN/m, the corresponding impulse is defined as the saturated impulse Isat. When the pulse load amplitude increment is 20 kN/m, if the impulse difference is less than 0.001 kN/m.s, the impulse is defined as the minimum impulse Imin. When impulse I is smaller than Imin, P-I curve infinite approaches the impulse asymptote gradually, and this section is specified as the impulse loading section. When impulse I is greater than Isat, P-I curve infinite approaches the quasi static asymptote gradually, and this section is specified as the quasi static loading section. Therefore, the saturated impulse Isat and minimum impulse Imin can be used as the cut-off points of dynamic area.
The safety area of blast resistance design is composed of the region of I≤Ii or P≤Ps (areaⅠ, Ⅱ, Ⅲ) and the region bounded by the two asymptotes and P-I curve. As shown in Figure 10, the safety area is mainly made up of the former region. The safety area expands with the increase of Ii and Ps. Simultaneously, Imin increases with the increase of Ii, and Isat increases with the increase Ps. Comparing the P-I diagrams under 100℃ and 600℃, it can be seen that the safety area under 100℃ is significantly greater. In addition, the corresponding saturated impulse Isat and minimum impulse Imin under 100℃ are also greater than that of 600℃. So saturated impulse Isat and minimum impulse Imin can also be used to describe the influence of temperature and static load ratio on the blast resistance capability of steel beam.
As in conjunction with Figure 8 and Figure 9, Isat and Imin decrease with the increase of temperature and static load ratio. Meanwhile the lower left area of P-I curve decreases accordingly. That means the reduction of the blast resistance capability of steel beam. That is, the blast resistance capability of steel beam decrease with the reduction of Isat and Imin.
Figure 11. P-I diagram at 600 ℃
5.2 The Tcr-I diagram of steel beam which attacking by the fire after impacting by blast load
According to the displacement criterion in European standard EC3 , the temperature at which the maximum deflection of steel beam equals L/10 is identified as the critical temperature. Taking critical temperature and impulse as abscissa and ordinate respectively, Tcr-I curve is obtained. Through analysis, the lower left area of Tcr-I curve is the safety area of the fire resistance design of structures. The fire resistance performance improves with the increasement of the safety area.
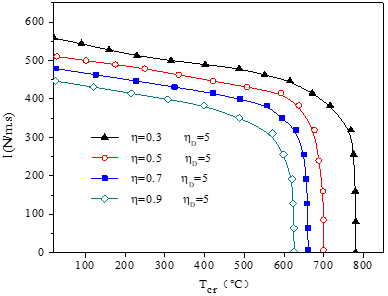
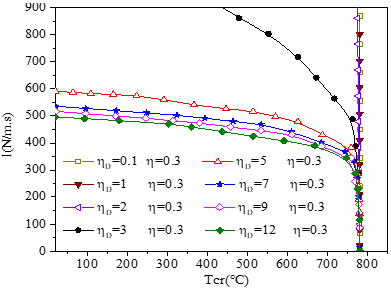
Figure 12 and Figure 13 show the Tcr-I diagram under different dynamic load ratio. The safety area decrease with the increase of ηD while ηD is greater than 1. In Figure 14, the dotted line paralleling to I axis is Tcr=Tcr0, in which Tcr0 is the critical temperature without consideration of the influence of the blast load. I(ηD) is the impulse related to dynamic load ratio, and I(ηD) exists only when ηD is greater than 1. When I is no more than I(ηD), the critical temperature is equal to Tcr0 . When I is greater than I(ηD), the critical temperature decreases with the increase of I . As shown in Figure 12 and Figure 13, the critical temperature is identically equal to Tcr0 while ηD is no more than 1, and it doesn't change with I. Therefore, when ηD is no more than 1, or ηD is greater than 1 and I is no more than I(ηD), blast load has no effect on the critical temperature of the steel beam.
Figure 12. The Tcr-I diagram of steel beam for various dynamic load ratios (η=0.3)
Figure 13. The Tcr-I diagram of steel beam for various dynamic load ratios (η=0.5)
Figure 14. Tcr-I diagram of steel beam
Figure 15. Tcr-I diagram of steel beam
As shown in Figure 12, Figure 13 and Figure 15, the safety area of fire resistance design of steel beam reduces with the increase of static load ratio and ηD, so does I(ηD). Therefore, I(ηD) can be used to measure the fire resistance performance of steel beam.
5.3 The dynamic response of steel beam under combined action of fire and triangular pulse blast load
The ideal triangular pulse load, as shown in Figure 16. pD is the peak for pulse load. Tr is the duration of rising section for triangle impulse. Td is the pulse total duration.
Figure 16. The triangular pulse load
The expression of impulse:
$\mathrm{I}=\frac{1}{2} p^D T_d$ (4)
The dynamic load ratio is defined as: $\eta_D=p^D / p_C^D$, among which $p_C^D=p_C$.
As shown in Figure 17, each P-I curve of steel beam under the action of fire and triangular blast load successively also exists an impulse asymptote and a quasi static asymptote. Each P-I curve is divided into three sections by saturated impulse and minimum impulse: impulse loading section, dynamic loading section and quasi static loading section. And the method of determining saturated impulse and minimum impulse is the same to that of rectangular blast load.
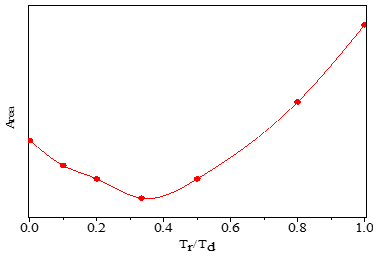
The ratio Tr/Td has different effect on different loading sections of P-I curve, as shown in Figure 17. In the impulse loading section, P-I curves almost overlap under different ratio of Tr/Td, indicating that the ratio Tr/Td has no effect on impulse loading section. Thus the impulse asymptotes of P-I curves under different ratio of Tr /Td are the same. The ratio Tr/Td has significant effect on quasi static loading section. The quasi static asymptote translate uplifts with the increase of the ratio Tr/Td, i.e. the pulse load amplitude which corresponding to the quasi static asymptote increases. When the ratio Tr/Td equals 1/3, the lower left area of P-I diagram is minimum in dynamic loading section. The influence law of Tr/Td to the safety area of blast resistance design is shown in Figure 18.
Figure 17. The P-I diagram under different ratio Tr/Td (T=400 ℃)
Figure 18. The effect of Tr/Td on safety area of dynamic loading section
Figure 19. The Tcr-I diagram under different Tr/Td (ηD=5, η=0.3)
Figure 20. The Tcr-I diagram under different dynamic load ratio (Tr/Td=1/3, η=0.3)
When the steel beam is impacted by blast load first, and then is attacked by fire, the variation of the safety area of fire resistance design under different Tr/Td is shown in Figure 19. The safety area of Tcr-I diagram is minimum when Tr/Td equals 1/3.
In Figure19, the Tcr-I diagram under triangular blast load and Tcr-I diagram under rectangular blast load are compared. The result shows that: when the peak value and the impulse are the same, the safety area of fire resistance design is smaller under the action of rectangular blast load; when the pulse total duration and the impulse are the same, the safety area of fire resistance design is smaller under the action of triangular blast load.
When the steel beam is impacted by triangular blast load first, and then is attacked by fire, the Tcr-I diagram of steel beam under different dynamic load ratio is shown in Figure 20. Above analysis shows that fire resistance performance of steel beam is the worst while Tr /Td equals 1/3. Thus triangular blast pulse load which Tr /Td equals 1/3 is adopted to analyze the fire resistance performance of steel beam. It can be seen from the Figure 20 that the impulse I(ηD) also exists for each Tcr-I curve while ηD is greater than 1. I(ηD) is the impulse related to the dynamic load ratio of triangular blast load. When ηD is no more than 1, or ηD is greater than 1 and I is no more than I(ηD), the blast load has no effect on the critical temperature of steel beam. In addition, the critical temperature identically equals Tcr0 in this situation. When ηD is greater than 1 and I is greater than I(ηD), the critical temperature decreases with the increase of I. When ηD is greater than 1, both the safety area and I(ηD) reduce with the increase of ηD. Therefore, I(ηD) also can be used as the index to measure the fire resistance performance of steel beam in this situation.
Dynamic response of steel beam is studied by numerical analysis in this study. The effect of the fire temperature on the blast resistance ability of steel beam, and the effect of the blast load on the fire resistance performance of steel beam are analyzed. The main conclusions are drawn as follows:
(1) When fire thermal load and blast load acting on the steel beam successively, the blast resistance ability of steel beam decreases with the increase of the fire temperature and the initial static load, and the effect of the fire temperature is more obvious.
(2) The saturated impulse Isat and minimum impulse Imin can be used as two critical points of dynamic loading section. Saturated impulse Isat and minimum impulse Imin can also be used to measure the blast resistance capability of steel beam.
(3) When the steel beam is impacted by blast load first, and then is attacked by fire, I(ηD) exists only when ηD is greater than 1. When ηD is no more than 1, or ηD is greater than 1 and I is no more than I(ηD), blast load has no effect on the critical temperature of steel beam. When I is greater than I(ηD), the critical temperature decreases with the increase of I. I(ηD) can be used to measure the fire resistance performance of steel beam. The blast resistance capability of steel beam decrease with the reduction of Isat and Imin
(4) The ratio Tr/Td has different effect on the different loading sections of P-I curve: it has no effect on the impulse loading section, but has significant effect on the quasi static loading section. The quasi static asymptote uplifts with the increase of the ratio Tr/Td. In dynamic loading section, the lower left area of P-I diagram reaches the minimum while the ratio Tr /Td is equal to 1/3.
[1] Yuan, Y., Zhang, C., Xu, Y. (2021). Influence of standoff distance on the deformation of square steel plates subjected to internal blast loadings. Thin-Walled Structures, 164: 107914. https://doi.org/10.1016/j.tws.2021.107914
[2] Ramezannejad Azarboni, H., Darvizeh, A. (2022). The influence of strain rate on the cavitation time and deformation of an underwater impulsively rectangular plate. The Journal of Strain Analysis for Engineering Design, 57(2): 155-164. https://doi.org/10.1177%2F03093247211020840
[3] Fu, T., Zhang, M., Zheng, Q., Zhou, D., Sun, X., Wang, X. (2021). Scaling the response of armor steel subjected to blast loading. International Journal of Impact Engineering, 153: 103863. https://doi.org/10.1016/j.ijimpeng.2021.103863
[4] Zhang, J., Zhang, H., Zhang, L., Liang, Z. (2020). Buckling response analysis of buried steel pipe under multiple explosive loadings. Journal of Pipeline Systems Engineering and Practice, 11(2): 04020010. https://doi.org/10.1061/(ASCE)PS.1949-1204.0000431
[5] Pancheti, J., Mahendran, M., Steau, E. (2022). Fire resistance of external LSF walls with corrugated steel cladding. Journal of Constructional Steel Research, 188: 107008. https://doi.org/10.1016/j.jcsr.2021.107008
[6] Tao, Y., Mahendran, M., Ariyanayagam, A. (2021). Fire tests of cold-formed steel walls made of hollow section studs. Journal of Constructional Steel Research, 178: 106495. https://doi.org/10.1016/j.jcsr.2020.106495
[7] Pires, T.A., do Rêgo Silva, J.J., dos Santos, M.M., Costa, L.M. (2021). Fire resistance of built-up cold-formed steel columns. Journal of Constructional Steel Research, 177: 106456. https://doi.org/10.1016/j.jcsr.2020.106456
[8] Xing, Z., Zhao, O., Kucukler, M., Gardner, L. (2021). Testing of stainless steel I-section columns in fire. Engineering Structures, 227: 111320. https://doi.org/10.1016/j.engstruct.2020.111320
[9] Kucukler, M., Xing, Z., Gardner, L. (2020). Behaviour and design of stainless steel I-section columns in fire. Journal of Constructional Steel Research, 165: 105890. https://doi.org/10.1016/j.jcsr.2019.105890
[10] Song, L., Izzuddin, B.A., Elnashai, A.S., Dowling, P.J. (2000). An integrated adaptive environment for fire and explosion analysis of steel frames-Part I: Analytical models. Journal of Constructional Steel Research, 53(1): 63-85. https://doi.org/10.1016/S0143-974X(99)00040-1
[11] Izzuddin, B.A., Song, L., Elnashai, A.S. (2000). Integrated adaptive environment for fire and explosion analysis of steel frames. Journal of Constructional Steel Research, 53(2): 87-111.
[12] Chen, H., Liew, J.Y.R. (2005). Explosion and fire analysis of steel frames using mixed element approach. Journal of Engineering Mechanics, 131(6): 606-616. https://doi.org/10.1061/(ASCE)0733-9399(2005)131:6(606)
[13] Liew, J.R., Chen, H. (2004). Explosion and fire analysis of steel frames using fiber element approach. Journal of Structural Engineering, 130(7): 991-1000. https://doi.org/10.1061/(ASCE)0733-9445(2004)130:7(991)
[14] Liew, J.R. (2008). Survivability of steel frame structures subject to blast and fire. Journal of Constructional Steel Research, 64(7-8): 854-866. https://doi.org/10.1016/j.jcsr.2007.12.013
[15] Yu, H.X., Liew, J.R. (2005). Steel framed structures subjected to the combined effects of blast and fire-Part 1: State-of-the-art review. Advanced Steel Construction, 1(1): 67-84.
[16] Yu, H.X., Liew, J.Y.R. (2005). Steel framed structures subjected to the combined effects of blast and fire part2: case study. International Journal of Advanced steel Construction, 92-103.
[17] Sun, Y., Wang, X., Ji, C., Gao, F., Yu, Y., Cheng, L., Wu, J. (2021). Damage effect of steel circular tube subjected to fire and blast. Journal of Constructional Steel Research, 176: 106389. https://doi.org/10.1016/j.jcsr.2020.106389
[18] Al-Thairy, H. (2021). Prediction of behaviour and failure of steel columns subjected to blast followed by fire induced by explosion. International Journal of Steel Structures, 21(4): 1431-1453. https://doi.org/10.1007/s13296-021-00514-w
[19] Jiang, T., Wang, X., Ji, C., Zhao, C., Yang, G., Ju, J., Xie, X. (2021). Field tests on the blast-resisting performance of mild steel circular tubes after exposure to fire. Engineering Structures, 247: 113192. https://doi.org/10.1016/j.engstruct.2021.113192
[20] Clough, L.G., Clubley, S.K. (2021). Synergistic response of steel columns to explosive thermal and long duration blast loading. Engineering Structures, 245: 112944. https://doi.org/10.1016/j.engstruct.2021.112944
[21] Xi, F., Li, Q.M., Tan, Y.H. (2014). Dynamic response and critical temperature of a steel beam subjected to fire and subsequent impulsive loading. Computers & Structures, 135: 100-108. https://doi.org/10.1016/j.compstruc.2014.01.014
[22] Xi, F. (2016). Large deflection response of restrained steel beams under fire and explosion loads. Springer Plus, 5: 752. https://doi.org/10.1186/s40064-016-2509-6
[23] European Committee for Standardization ENV 1993-1-2 Eurocode3: Design of steel structures, Part 1-2: Structural fire design. 1993, 1-65.
[24] ABAQUS Explicit Version 6.12. User’s manual. ABAQUS Inc., Richmond, USA; 2012.
[25] Rubert, A., Schaumann, P. (1986). Structural steel and plane frame assemblies under fire action. Fire Safety Journal, 10(3): 173-184. https://doi.org/10.1016/0379-7112(86)90014-7
[26] Symonds, P.S., Jones, N. (1972). Impulsive loading of fully clamped beams with finite plastic deflections and strain-rate sensitivity. International Journal of Mechanical Sciences, 14(1): 49-69. https://doi.org/10.1016/0020-7403(72)90006-9
[27] Krauthammer, T., Astarlioglu, S., Blasko, J., Soh, T.B., Ng, P.H. (2008). Pressure–impulse diagrams for the behavior assessment of structural components. International Journal of Impact Engineering, 35(8): 771-783. https://doi.org/10.1016/j.ijimpeng.2007.12.004
[28] Li, Q.M., Meng, H. (2002). Pressure-impulse diagram for blast loads based on dimensional analysis and single-degree-of-freedom model. Journal of Engineering Mechanics, 128(1): 87-92. https://doi.org/10.1061/(ASCE)0733-9399(2002)128:1(87)