Giuseppe Emmi* | Marco Cavazzuti | Michele Bottarelli
(This article is part of the Special Issue 7th int. Conf. AIGE-IIETA and 16th Conf. AIGE)
© 2022 IIETA. This article is published by IIETA and is licensed under the CC BY 4.0 license (http://creativecommons.org/licenses/by/4.0/).
OPEN ACCESS
The recent H2020 IDEAS project is oriented to the study of multi-source heat pump systems by investigating their behavior through dynamic simulations and on-field experiments in real small and large-scale prototypes respectively. One of the main aims of the project is the exploitation of available free energy sources, solar, air and ground using the heat pump technology. The key point in the investigated multi-source heat pump system is the optimal management of the renewable sources and the keeping of the ground storage available also in case of undersize of it and in case of buildings with unbalanced thermal load profile. In the last year of the project the algorithm for the control of sources and devices in the IDEAS system has been developed to maximize the use of renewable energies and at the same time to minimize the consumption of auxiliary energy. The present paper shows the details of this part of the project highlighting limits, potential and properties of the management system with a discussion of the results obtained from the on-field experiments. In the last part of the project, the implementation of weather forecast and artificial intelligence in the algorithm is planned.
heat pump, multi source, renewable energy, ground heat exchanger, PVT, PCM
As widely known, the building sector is responsible for about 40% of global energy consumption, with a consequent great impact on greenhouse gas (GHG) emissions. This sector requires effective actions to ensure its sustainable development lowering the energy use and decarbonizing the energy supply. In the heating ventilation and air conditioning (HVAC) field, the important role of heat pump (HP) systems has been analyzed and demonstrated in the literature. At European level, the key role of HP technology is already consolidated as reminded in a recent press release communication within the second pillar of the European Commission's REPowerEU plan [1]. Objectives of this wide project are the development of an integrated EU energy system based on renewable energy sources and the increase of energy efficiency as the most cost-effective solutions to reduce our dependence on fossil fuels at the level of homes, buildings, and industry [2]. This message encourages an accelerated roll-out of solar energy, wind and heat pump applications. This strategy could bring important energy saving results and a meaningful reduction of fossil gas use in buildings for heating, cooling and domestic hot water production. Therefore, in this historical period heat pump technology is one of the best possibilities to lower costs, energy consumption and carbon footprints in HVAC systems. The electrification process and the high share of renewable energy sources, coupled with emerging new and efficient technologies, can surely help in reducing the primary energy use even more. In recent years, multi-source heat pump systems (MSHPS) have been widely investigated in the literature. Their use can contribute to improve energy efficiency and increase the exploitation of low-grade renewable energy sources (air, water, ground, and solar) as well as of waste heat sources – when available – to achieve EU objectives of fossil fuels and GHG emissions reduction. In this context, a key role could be played by the energy communities. They support and promote collective and citizen-driven energy actions for a clean energy transition [3]. This new figure was deeply discussed in the recent years due to its potential in increasing the public acceptance of renewable energy projects. In this field, Mutani and Usta [4] analyzed different renewable energy community scenarios considering energetic, economic, and environmental perspectives. From the results of their work, they found a decrease of about 23% in GHG emissions and an increase of about 26% in the share of locally self-consumed energy on the total energy consumption.
Many experiences on heat pump systems are reported in the literature supporting what is proposed and pursued at European level. This is also reflected in real applications with a constant growth of this market. European heat pump sector represents an important share of the global air conditioning market and grew by +7.4% in 2020 with a total of 1.62 million units sold across Europe. This significant growth in heat pump installations is mainly due to three factors: the current heat pump technology allows to operate at outdoor ambient temperature down to -25℃ and reaching temperatures at the user side up to 65℃ with reasonably good efficiencies, the community needs to increase and improve the actions for the energy transition, the growing sales are resulting in lower costs due to the economy of scale [5].
Air Source Heat Pump (ASHP) systems are the most diffused in building sector because of their easy installation and reduced costs compared to the other ones. Nevertheless, their energy performance is affected by the outdoor ambient conditions, especially in cold climates. In particular, their performance drastically falls when the defrosting cycle occurs at the evaporator side; this leads to an increase in the energy consumption and at the same time a reduction of the mean load heating capacity available from the heat pump [6]. Several technical solutions have been studied to reduce this inefficiency, which is yet necessary for the correct operation of heat pump systems. Wang et al. [7] described different possibilities using solar sources to improve the energy performance of ASHP systems. Their literature review involved the energy analysis of the HP performance considering three solar sources: solar thermal (ST), photovoltaic (PV), and hybrid photovoltaic/thermal (PVT). The result shows the ASHP integrated with PV system as the best techno-economic solution, with a coefficient of performance (COP) around 3.75, and at the same time moderate costs and payback time. Li and Huang [8] investigated a hybrid HP system by means of simulations. Their system uses air and PVT field as heat sources for the thermodynamic cycle of the HP. As for the way the system was conceived, it doesn’t need a secondary heat carrier fluid. In fact, the solar source is exploited with a direct expansion evaporator integrated in the PVT modules. The two evaporators can work individually or in parallel using a criterion for the system operation mode based on ambient temperature and solar radiation. The average COP of their HP system is 29.7% and 19.9% higher than that of common SAHP and ASHP, respectively. Kudela et al. [9] studied a plant consisting of a heat pump, a low-temperature heat storage and a dedicated control unit. They focused on two low-temperature heat storages, an insulated-water one and a water heat storage sunken in soil, studying the energy performance of the system using a computational model developed in Python language. The study was completed with a test of selected algorithms for heat pump control. They found a COP increase of about 5% by using a control algorithm connected to weather forecast. Liu et al. [10] investigated a set of multi-source complementary heat pump system for heating and domestic hot water production. Their system used sun and air as main sources and the electric energy as auxiliary heat source. The experimental setup used for the study has a high degree of automation, accuracy and reliability. The high-level scientific research platform could be useful for the innovative, comprehensive, and research-based tests for the aim of energy saving.
The common objective of the works described above in the text was the energy performance improvement of the HP system using different layout solutions. This was pursued by means of experimental activities or simulations. The research and the use of free energy sources is the basis of every project that aims at energy saving and sustainable development. The previous works highlight which are the actions to overcome the limit of the HP systems but at the same time bring out how the MSHPS should be a good solution for the wide exploitation of the HP technology. These systems require a dedicated management of the different heat sources. Therefore, what would be needed is a flexible algorithm that can be adapted to any type of multi energy system regardless of the number and type of free heat sources available.
The present work is focused on the study of a MSHPS including the use of dedicated rules for the management of the free energy sources. The proposed management strategy aims to overcome the limits of the other algorithms in literature which are especially dedicated to the investigated system. The present algorithm is more flexible, and it is based and similar to ɛ-NTU method for heat exchangers. The study shows the results of a monitoring campaign in a small building at laboratory scale. The properties of the system, excluding the details of the algorithm control, are widely described in other papers not focused on the management strategy.
The present work summarizes the main results of a project in the field of the renewable energy sources. In detail, the aim of the project is the study of a MSHPS for the air-conditioning (heating and cooling) of buildings. For this aim, a test facility at laboratory scale has been realized and monitored in heating and cooling period. The test facility includes a set of devices and components for the exploitation of the renewable energy sources, ground, sun and air. This small prototype system is installed at TekneHub building complex in Ferrara, Italy. Based on the monitoring data, a dynamic simulation model of the system has been developed and calibrated in TRNSYS environment [11]. This work describes the approach used for the management of the energy sources available in the MSHPS. At the beginning of the research, a series of management rules have been defined using the simulation model. These first rules have been modified and optimized for a simple implementation in a PLC controller. The output of this research activity was the starting point for the next ongoing real application which replicates the first small prototype in a large-scale case study of about 100m2. The main outputs show limits and potentials of the investigated system. This represents only a small part of the wider IDEAS project, which covers many additional topics beyond the MSHPS [12].
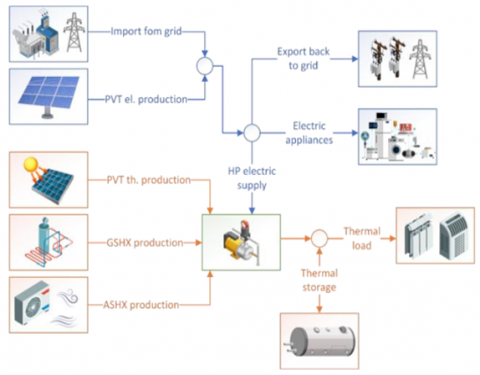
The case study at laboratory scale includes a 3kW water-to-water HP. The HP system has primary and secondary loops for the source side and user side respectively, connected to each other by two 100L storage tanks (named BF1 and BF2 for source side and user side respectively).
In the secondary loops, a pump (P1) feeds the different free sources and additional one (P2) is used for the secondary user loop connected to a radiant floor system and to three fan coil units. A number of three-way valves allow switching between the exploitation of the different renewable heat sources [13], either in parallel or in series, to thermally recharge and feed the tank BF1 on the sources side of the HP. A scheme of the system and its devices is shown in Figure 1.
3.1 The building
The test building consists of a 12m2 room and 32m3 net volume. The room thermal energy demand (for heating and cooling) is met by a hydrate-salt PCMs integrated hydronic radiant floor (nominal melting points of the PCMs are 21℃ and 27℃ for cooling and heating respectively with total thermal capacity 50MJ) and an auxiliary fan coil unit connected in parallel to the BF1 user tank through a pipe network and a three-way valve. Two guard rooms (3m2 floor, 8m3 volume) on the east and the west sides of the test room are kept at a controlled temperature by dedicated fan coil terminal units. The purpose of the PCMs is to enhance the thermal inertia of the floor so that, once the material is thermally charged, it can still heat or cool the room for long time even when the pump is off [13].
Figure 1. Scheme of the system [13]
3.2 Heat sources and sinks
As previously mentioned, the system has several sources/sinks to exploit for the HP operation. An air-to-water finned coil heat exchanger (named AHX) is used for the exploitation of air source. Three PVT panels are installed vertically on the south façade of the test facility: two commercial 360Wp each (named PVT) and an experimental 80Wp panel (named OMEGA) developed by an IDEAS project partner. In addition, two experimental PV panels, one (named ALFA) with the same geometry and technology of the experimental PVT panel and another small one, used as reference (named REF), are connected to the plant. The piping on the back of the panels feeds an additional water tank (named BF3) filled with hydrate-salt PCMs used to store the thermal energy collected from the PVT panels. PCMs having two different melting points are used (namely, 10℃ and 32℃) to enhance the thermal inertia of the thermal storage both in typical winter and summer operating conditions, for a total thermal capacity of 30MJ. The above devices are shown in the Figure 2.
Figure 2. Installation of BF3, PVT, ALFA, OMEGA, REF and AHX
The ground heat exchangers field consists of three parallel lines of three shallow flat panels each. The panels are 1m high, 2m long, and 1.6cm wide and are vertically installed in 2.5m deep, 0.4m wide trenches dug in the ground. One trench is filled with sand (GHX1), another with sand mixed with paraffin-based PCMs granules (nominal melting points of 8℃ and 27℃, GHX2), the last with sand and hydrate-salt PCMs placed inside tube containers located side by side to the panels (GHX3). In this way, the different thermal behavior of the three ground lines can be appreciated. The total thermal capacity of the PCM installed is 50MJ. An example of the GHX installation is shown in Figure 3. More details about this installation are reported in the study of [13].
Figure 3. GHX installation
4.1 The dynamic model of the system
The laboratory test facility has been modelled in TRNSYS environment and, first of all, calibrated in order to match some set of experimental data at best. The simulation model was tested as to be able to replicate measured temperatures and heat fluxes both in typical summer and winter conditions for given water inlet temperature and mass flow rate at the radiant floor. Further, the calibration addressed the fan coils, the heat pump, and all the components on the sources side of the system. Technical datasheets of the installed devices and additional experimental data were used for fine tuning the components’ behavior.
Based on the results and analysis of this preliminary and explorative activity, hypotheses were carried out on possible set of control rules for the optimal management of the system aiming at improving the exploitation of the available renewable energy sources.
4.2 The rules for the management of the system
The HP operates to keep the storage tank on the user side (BF2) at the set-point temperature. Setpoint temperatures and hysteresis for the user tank are usually 37℃ and 2℃ and 13.5℃ and 1.5℃ in winter and summer respectively. These setpoints are controlled by IDEAS management system, while compressor and primary loop pumps are controlled directly by the HP itself.
For what concerns the building, reference room setpoint temperatures are 21±1℃ in winter and 26±1℃ in summer. Standard thermostats have been used to control the terminal units present in the main room and in the guard rooms. In case the main room setpoint temperature cannot be reached and maintained through the thermal load of the radiant floor system, a fan coil unit is activated in parallel to the radiant floor.
The management and the rules for the control of the MSHPS mostly concern the use of the thermal sources available for the HP operation. The main objective forwarded in this activity is to keep the 100L buffer tank on the sources side (BF1) thermally charged (i.e. as warm as possible in winter, and as cold as possible in summer) and ready for the heat pump to work with a better condition. To do so, the best source to be exploited, or the best mix of sources, must be chosen at any time, the term “best” meaning the source able to transfer thermal energy to the tank at higher power rates. The temperature of air and solar sources depends on the meteorological conditions. As such, these are “free” sources always available and that can be exploited whenever convenient. The same is not true for shallow ground source. Ground temperature varies naturally along the seasons but not in phase with them. Normally, the ground temperature at low depth has a delay with respect to the temperature trend of the external air. At depths greater than 5-10 m the temperature is almost constant close to the average annual temperature of the outside air with an increase of about 0.03℃ for each meter of depth in normal areas. This makes the ground an interesting renewable thermal energy source. Yet, its temperature is largely affected by its degree of exploitation and any thermal jump associated to a large injection/extraction of thermal energy in the ground will be only recovered very slowly over time. For this reason, the design of GSHP system is carried out considering not only the worst operating condition of the system in heating and cooling respectively but the whole thermal load profile of the building. In fact, the heating and cooling loads of the building can heavily affect the thermal energy balance at the ground side. MSHPS has air and sun in addition to the ground so the energy balance in the ground is more complex if compared to standard GSHP system.
The IDEAS’s control logic must promote the exploitation of air and solar sources when viable to prevent an early depletion of the ground source along the seasons. In addition, whenever the source side buffer tank (BF1) is thermally charged, attention may be devoted to additional operations, such as thermally regenerate the ground source through air or sun in case the sources temperature would allow it. The air can be used both in the heating and in the cooling period while the solar heat can only be useful during the heating season. It has to recall that in this analysis the domestic hot water production is not considered, for this reason the sun source is not used during the summer season.
A control algorithm of the source side must first include a list of all the possible system operating states in terms of set of sources exploited, then at each time it must attribute a score to each state to quantify the advantage that could be obtained by their exploitation. Finally, it must decide which state to activate and operate the valves accordingly. The set of possible source system states is summarized in Table 1 where a distinction is made between states aiming at keeping the buffer tank BF1 at the best temperature on the sources side (primary modes, see the third column of the table), and those aiming at performing side operations such as recharging or discharging the ground source or cooling the PVT panels from overheating during hot summer days (secondary modes).
For primary modes, the evaluation is made on a thermal power basis by estimating the thermal load that could be delivered to the buffer tank by each of them in a similar fashion to ɛ-NTU method for heat exchangers. It is trivially noted that the thermal power transferred by a source seen as a heat exchanger is proportional to its efficiency εsrc and to the temperature difference between the source Tsrc and the incoming fluid from the tank Tbt. By hypothesizing an infinite thermal capacity of the source, with no loss of generality the return temperature Tret can be evaluated as:
$\begin{aligned} T_{r e t}=T_{b t}+\varepsilon_{s r c} &\left(T_{s r c}-T_{b t}\right) =\varepsilon_{s r c} T_{s r c}+\left(1-\varepsilon_{s r c}\right) T_{b t} \end{aligned}$ (1)
so that a possible measure for attributing a score to a source is given by the quantity E:
$E_{s r c}=s \cdot \varepsilon_{s r c}\left(T_{s r c}-T_{b t}\right)$ (2)
which is expressed in ℃ and is proportional to the thermal power delivered. The term “s” is an index whose value is 1 in winter (heating season) and –1 in summer (cooling season).
The temperatures in the equation above are known from the probes installed in the plant, while the efficiencies must be estimated with numerical models, or from the technical datasheet of the devices installed in the system. These quantities are then corrected to account for the different mass flow rates experimentally measured in each state.
In case of two or more heat sources exploited at the same time, in series and/or in parallel, Tret and Esrc can still be evaluated in a similar way, even though through slightly more elaborated equations. The same holds for secondary states. For the case study discussed here, the ε values associated to each state have been estimated and embedded in the control algorithm in terms of parameters that an expert user can manipulate at need. In this way the proposed algorithm can be used in different systems.
Once the various Esrc have been estimated, the control algorithm must choose the state to be activated while considering the preservation of the ground source. To do so an additional parameter Er is introduced representing, for primary states, the desired recharge rate of the buffer tank. This quantity changes with the state of the HP. In fact, when the HP is on, the buffer tank will be rapidly discharged so that a larger recharge rate from the sources becomes a priority. On the contrary, when the HP is off, a moderate recharge rate is acceptable.
Table 1. Source system states
|
State Name |
A |
S |
G |
GAp |
GAs |
AS |
GS |
|
|
Sources Involved |
Air |
Sun |
Ground |
Ground & Air (in parallel) |
Ground & Air (in series) |
Air & Sun (in series) |
Ground & Sun (in series) |
|
|
Primary/Secondary |
P |
P |
P |
P/S |
P/S |
S |
S |
|
|
Mass flow rate to the different sources |
Ground |
0% |
0% |
100% |
fg% |
100% |
0% |
100% |
|
Sun |
0% |
100% |
0% |
0% |
0% |
100% |
100% |
|
|
Air |
100% |
0% |
0% |
100 – fg% |
100% |
100% |
0% |
|
In case the E associated to air or sun is larger than Er these sources will be used and the ground preserved. Otherwise, the best source (i.e. the one with the larger E) will be exploited. Yet, in case the E associated to ground is larger than Er, ground can be used in parallel to air to lower its thermal load while still meeting the desired recharge rate.
Finally, if all the E associated to primary states are lower than Er while the HP is off, it means the buffer tank is already charged at its best, and secondary states can be activated. Among secondary states, the one able to recharge the ground or cool the PVT panels more quickly (maximum E) should be chosen. An additional Er parameter is introduced for secondary states with the intention to save the electric energy needed to drive the pump in case too small an advantage is obtained in terms of ground thermal storage. If the maximum E associated to secondary states is lower than Er the system goes momentarily idle until the next temperatures update.
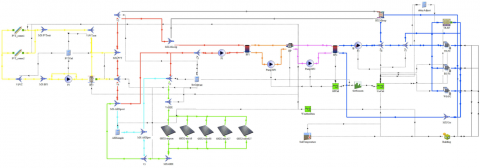
The value of the Ercoefficients have been optimized through a set of simulations. For this aim, the laboratory test facility has been modelled in TRNSYS. A scheme of the model is reported in Figure 4. In the diagram it can be seen the sections of the plant and the connection pipes. The core of the system is the HP in the centre of the figure. On the left side, the devices for the exploitation of the heat sources/sinks are shown, while on the right side the terminal units and the building are represented. The simulation model in TRNSYS environment is built and defined using TYPEs, which work as black boxes connected to each other. Each TYPE requires a set of parameters and input data to obtain the output data which represent the behaviour of the component. The model of the system uses many TYPES present in the standard library of the program, such as the pumps (TYPE114), the buffer tanks (TYPE534), the fancoils (TYPE996) and the building (TYPE56). In other cases, the non-standard TYPE such as the one that simulates the flat plate GHXs and the definition of the management algorithm were developed by the authors because of these components are not present in the program library.
4.3 Results of the model calibration using the dynamic simulations
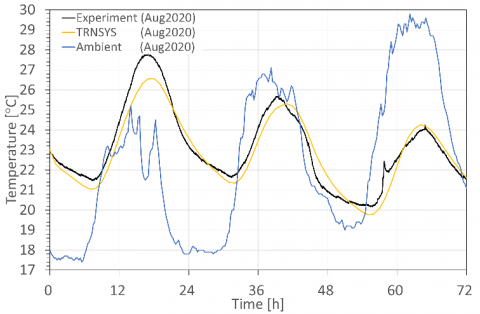
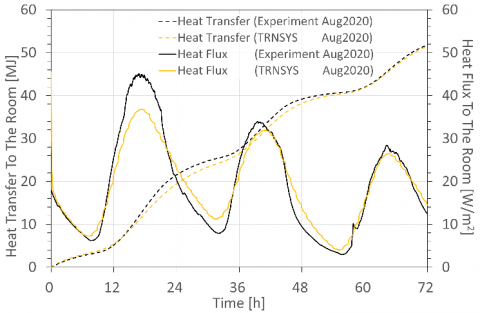
As described in the previous section, first of all, the model has been calibrated in order to match some set of experimental results at best. The calibration regarded primarily the building envelope and the radiant floor in terms of thermal conductivities of the walls and floor layers. The model was tested as to be able to replicate measured temperatures and heat fluxes both in typical summer and winter conditions for given water inlet temperatures and mass flow rates at the radiant floor. For instance, Figure 5 compares the measured and the simulated room temperature over a three-day summer period after calibration. Similarly, Figure 6 shows the heat fluxes at the radiant floor surface over the same period. The accuracy of the probes used in the experimental plant are summarized in Table 2.
Table 2. Accuracy of the sensors
|
Sensor |
Accuracy |
|
Room Temp. - NTC |
0.5K (from 0℃ to 40℃) |
|
External Temp. and RH |
0.5K 3% up to 90% or 4% |
|
Buffer Tank Temp. - RTD PT100 |
0.15K (@0℃) |
|
Heat Flux Meter for RF |
5% (@23℃) |
|
Electric Energy Meter |
1% |
|
Thermal Energy Meter |
<5% for the flow meter 0.5K for temperature |
Further, the calibration addressed the fan coils, the heat pump, and all the components on the sources side of the building. Here the core of the work was the proper setup of the various types used, including the creation of performance maps where needed according to technical data sheet from suppliers. This was the case for the fan coil, the HP, and the thermal properties of the PCMs adopted in various components. Additional experimental data also aided in the fine tuning of the components’ behaviour.
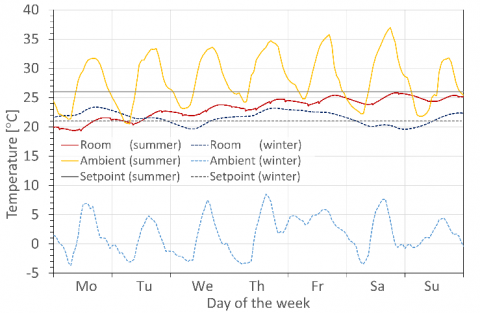
The control rules discussed in section 4 of the paper were then implemented in TRNSYS. Results of one week long simulations in typical summer and winter conditions are shown in Figure 7 shows the room and the ambient temperature trend. In summer, the external shading over the most sun exposed building walls prevented the room temperature from exceeding the setpoint for most of the time. Occasionally the fan coil switches on to control the room relative humidity as seen from the small and sudden room temperature changes, while the radiant floor remains mainly idle. The situation is much different in winter where the large temperature differences between room and ambient require the radiant floor to be often in operation. In any case, the system is able to keep the desired setpoint temperature in the room.
Figure 4. Scheme of the simulation model developed in TRNSYS environment
Figure 5. Example of RF calibration – Room Temperature and Ambient Temperature
Figure 6. Example of RF calibration – Heat Transfer and Heat Flux to the room
Figure 7. Example of results of the simulations in TRNSYS environment
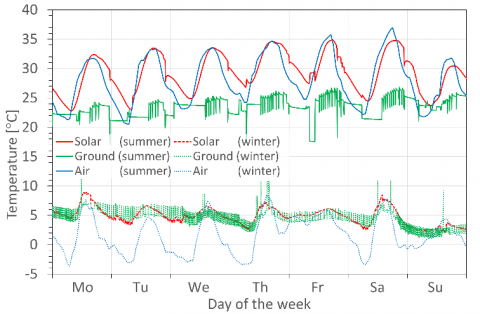
In Figure 8 the sources temperatures are shown over the same periods of time. Here ground source temperature is read on the surface of the panel and not at some distance in the ground, thus being subject to rather sudden changes of relatively large amplitude. Reference temperature for the sun is the temperature of the dedicated PCM integrated buffer tank instead. It is shown as the ground is often the most favourable source in terms of temperature, even though also sun can be particularly advantageous, particularly in winter time when due to radiation the panels warm up during clear days, and the thermal inertia of the buffer tank allow the temperature not to drop during the night. To be noted how the larger cold/hot temperature spikes in summer/winter ground temperature denote the underground thermal storage modes of operation.
Air source, most commonly used in single-source heat pump application, is rarely the best source to be exploited and in fact during the two one-week simulated periods is never used. Ground is the most exploited source, whereas sun exploitation becomes relevant in winter, as mentioned above, as it tends to be the warmer source under many circumstances.
Figure 8. Trends of the source’s temperatures for a typical week of the winter and summer season
The real plant logger data are summarized in this section to describe more in detail the characteristics of the system and how the free energy sources are involved by the management algorithm. The algorithm was activated at the beginning of last winter season in 2021, therefore the data of winter period is available and is presented in the following. Before, the plant used a simpler version of the algorithm based on temperature differences in place of efficiencies and thermal loads on the different sources.
As mentioned, the core of the plant is based on a MSHPS using ground, air, and sun. The GHXs represent the main source of the system, and they are arranged in three loops with different filling material.
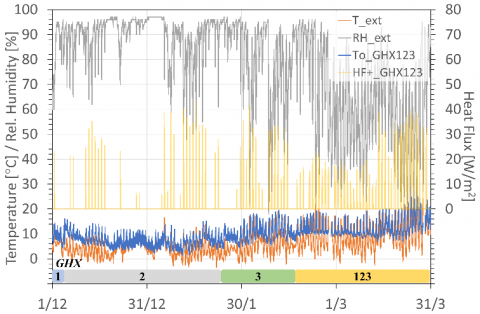
Figure 9. Trends of the GHX outlet temperature (ToGHX123), temperature and relative humidity of the external air (Text and RHext), positive heat fluxes at ground heat exchangers (HF+GHX123)
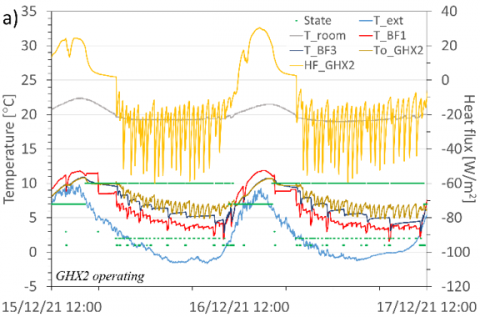
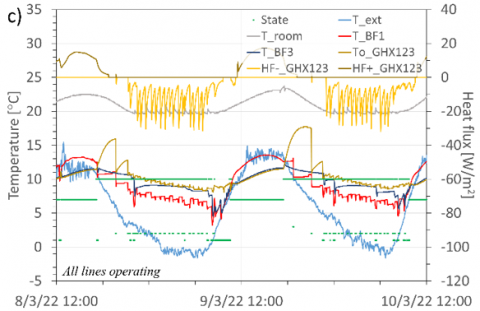
Figure 10. Detail of the system operating conditions at different times throughout winter: a) 15/12-17/12, b) 29/01-31/01, c) 08/03-10/03. Text is external ambient temperature, Troom the room temperature, TBF1 and TBF3 the temperatures of the buffer tank on the sources’ side and that linked to the PV/T panels. To_GHX123 and HF_GHX123 the outlet temperature and the heat flux from the ground source
Figure 9 shows the ground loop outlet temperature and positive heat fluxes, together with the temperature and relative humidity of the ambient air. The monitoring period goes from the beginning of December 2021 to the end of March 2022. In the first few days the GHX1 loop was used (1), followed by GHX2 (2) and GHX3 (3). In the late winter the three loops were exploited in parallel (123) as highlighted at the bottom of the figure. As expected, the outlet temperature of the GHX loops is higher than the ambient temperature for most of the time, notwithstanding the limited dimension of the ground field (each line has a length of only 6m). The temperature difference between ground and air is often around 5-6℃ or more, except for early December and late January. The positive heat flux spikes at the ground loop denote when the plant is using the solar loop to store free heat in the PVT tank and in the ground. During these sunny days, the positive effect of ground thermal storage through the solar loop is demonstrated by the GHX outlet temperature slowing down its negative trend (mid-December) or even increasing its mean value (mid-January and end of March) despite the cold season.
A detail of the operating conditions selected by the plant control algorithm is shown in Figure 10. The charts, besides showing several temperatures trends along the system, also show the selected system state through dots. In particular, a value is associated to each state: 1 for the use of sun, 2 for ground loop, 3 for air, 7 for underground thermal storage through PVT, and 10 for the system being idle.
Figures 10a and Figure 10b show the behaviour of the system during sunny winter days with ambient temperature below zero at nighttime, the main difference between them being the different GHX loop exploited, GHX2 and GHX3 respectively. The air-conditioned room, due to the good thermal properties of the envelope and the milder ambient temperatures, always remains above the setpoint temperature during the day, while the radiant system works mostly at night to maintain the desired room temperature. The temperature at the GHX loop outlet and in BF1 buffer tank always remain higher than ambient temperature, also thanks to the underground thermal storage through PVT panels protecting the ground from thermal drift notwithstanding its limited size. At the same time, the system benefits from the thermal inertia of the PCM distributed along various sections of the plant, such as ground and terminal unit.
Figure 11. Heat flux a) and electric consumption/production b) trend of different system components over wintertime. Positive (+) and negative (–) thermal loads in a) have been integrated separately. BF1 and BF2 refer to the buffer tanks on the source and user sides, Main loop stands for the radiant floor
The plant control rules affect the operating times and the switching between the different operating modes, as well as the extent to which the various sources are exploited. To have a wider overview over the system operation an eye must be kept on the heat fluxes and the electric consumptions associated to the plant operation. A summary of the cumulative thermal energy transferred and of the electric energy demanded/produced along the winter season is given in Figure 11.
Figure 11a shows how a large share of the heat load supplied to BF1 comes directly from the solar source and not only from ground loop, as it can be seen from the gap between the trends of BF1– and GHX–.
From Figure 11b it is apparent how the largest share of the total electric consumption is spent in driving the HP, whereas the consumption associated to the auxiliary pumps (P1 and P2) is much lower. The energy consumption of the fan of the air-to-water heat exchanger is almost negligible as the AHX is exploited only very seldomly during wintertime.
The present study summarizes the monitoring results of a MSHPS under the control of a novel algorithm which implements a set of rules for the exploitation of RESs: ground, sun and air. The system and the management rules have been adopted in a real small-scale plant which includes all the three sources and PCMs distributed in several components of the system from ground to terminal unit. The logging data recorded during last cold season was used to draw several observations on the plant operation. In conclusion: the MSHPS appears as a promising solution to maximize the exploitation of RESs toward the decarbonization of the building envelope. The use of solar source in cold climates is fundamental to avoid the thermal drift of the shallow geothermal field, especially when the ground heat exchanger extension is limited. The use of dedicated control algorithms is a must for the success of this technology.
This study was funded by the project “IDEAS” financed by the European Union’s Horizon 2020 research and innovation program, G.A. No. 815271 and the project “CLIWAX” co-financed by 2014–2020 POR FESR Emilia-Romagna Region Italy DGR 774/2015 – CUP F71F18000160009. The authors declare that there is no conflict of interests.
|
AHX |
Air Heat Exchanger |
|
ASHP |
Air Source Heat Pump |
|
COP |
Coefficient Of Performance |
|
E |
Efficiency score |
|
f |
fraction |
|
GHG |
GreenHouse Gas |
|
GHX |
Ground Heat eXchanger |
|
GSHP |
Ground Source Heat Pump |
|
HP |
Heat Pump |
|
MSHPS |
Multi Source Heat Pump System |
|
PCM |
Phase Change Material |
|
PLC |
Programmable Logic Controller |
|
PV |
PhotoVoltaic |
|
PVT |
PhotoVoltaic Thermal |
|
RES |
Renewable Energy Source |
|
s |
Seasonal coefficient |
|
SAHP |
Solar Assisted Heat Pump |
|
T |
Temperature, ℃ |
|
Greek symbols |
|
|
ɛ |
efficiency |
|
Subscripts |
|
|
bt |
buffer tank |
|
ext |
external ambient |
|
g |
ground |
|
o |
Outlet |
|
p |
peak |
|
r |
recharge |
|
ret |
return |
|
src |
source |
[1] Ehpa European Heat Pump Association AISBL - Rue d’Arlon 63-67 - B-1040 Brussels - Belgium - Press Release - Brussels, 9 March 2022 - #REPowerEU – Doubling heat pump sales requires a “Heat Pump Accelerator”. https://www.ehpa.org/fileadmin/user_upload/EHPA_PR_RePowerEU.pdf, accessed on 25 April 2022.
[2] EU Commission - REPowerEU: Joint European action for more affordable, secure and sustainable energy - https://ec.europa.eu/commission/presscorner/detail/en/ip_22_1511, accessed on 25 April 2022.
[3] https://energy.ec.europa.eu/topics/markets-and-consumers/energy-communities_en, accessed on 29 August 2022.
[4] Mutani, G., Usta, Y. (2022). Design and modeling renewable energy communities: A case study in Cagliari (Italy). International Journal of Sustainable Development and Planning, 17(4): 1041-1051. https://doi.org/10.18280/ijsdp.170401
[5] Nowak, T. (2021). European heat pump market. The REHVA European HVAC Journal, 58(4): 40-43. https://www.rehva.eu/rehva-journal/detail?tx_wbjournals_journaldetail%5Baction%5D=download&tx_wbjournals_journaldetail%5Bcontroller%5D=Journal&tx_wbjournals_journaldetail%5Bjournal%5D=77&cHash=53c415f7ec8a3d56950f316929bde7a4.
[6] Urchueguía, J.F., Zacarés, M., Corberán, J.M., Montero, Á., Martos, J., Witte, H. (2008). Comparison between the energy performance of a ground coupled water to water heat pump system and an air to water heat pump system for heating and cooling in typical conditions of the European Mediterranean coast. Energy Conversion and Management, 49(10): 2917-2923. https://doi.org/10.1016/j.enconman.2008.03.001
[7] Wang, X., Xia, L., Bales, C., Zhang, X., Copertaro, B., Pan, S., Wu, J. (2020). A systematic review of recent air source heat pump (ASHP) systems assisted by solar thermal, photovoltaic and photovoltaic/thermal sources. Renewable Energy, 146: 2472-2487. https://doi.org/10.1016/j.renene.2019.08.096
[8] Li, Z., Huang, X. (2022). Simulation analysis on operation performance of a hybrid heat pump system integrating photovoltaic/thermal and air source. Applied Thermal Engineering, 200: 117693. https://doi.org/10.1016/j.applthermaleng.2021.117693
[9] Kudela, L., Spilacek, M., Pospíšil, J. (2021). Influence of control strategy on seasonal coefficient of performance for a heat pump with low-temperature heat storage in the geographical conditions of Central Europe. Energy, 234: 121276. https://doi.org/10.1016/j.energy.2021.121276
[10] Liu, C., Zhao, H., Liu, H. (2020). Development of an experimental platform for multi-source complementary heat pump heating system. International Journal of Heat and Technology, 38(2): 321-326. https://doi.org/10.18280/ijht.380206
[11] Klein, S., Beckman, W., Mitchell, J., Duffie, J., Duffie, N., Freeman T. (2006). TRNSYS - A Transient System Simulation Program TRNSYS, Madison, WI, USA.
[12] https://www.horizon2020ideas.eu/, accessed on 15 April 2022.
[13] Cesari, S., Natali, A., Larwa, B., Baccega, E., Boschetti, M., Mainardi, E., Cavazzuti, M., Piazzi, A., Mangherini, G., Vincenzi, D., Bottarelli, M. (2021). A heat pump-based multi-source renewable energy system for the building air conditioning: The IDEAS project experience. TECNICA ITALIANA-Italian Journal of Engineering Science, 65(1): 12-22. https://doi.org/10.18280/ti-ijes.650102