Depeng Chen | Jinxun Zhuang*
© 2022 IIETA. This article is published by IIETA and is licensed under the CC BY 4.0 license (http://creativecommons.org/licenses/by/4.0/).
OPEN ACCESS
With the increasing demand for on-site test of heat transfer coefficient of building envelope, a new test method is proposed aiming at the problems of common detection methods. According to the one-dimensional steady-state heat transfer theory of the envelope structure, the formula for calculating the heat transfer coefficient of the building envelope is derived based on the air temperature on both sides of the enclosure, the inner surface temperature and the inner surface heat transfer resistance. After turning the formula into a calculation program and loading the program into a smart phone, the heat transfer coefficient at the corresponding position can be obtained as long as the corresponding temperature and surface heat transfer resistance are input into the program. Comparing with the existing on-site detection methods of heat transfer coefficient and analyzing the detection results, it can be seen that the heat transfer coefficient obtained by this detection method is reliable, and that the method meets the needs of engineering detection. It is an economical, convenient, fast and reliable detection method to test the heat transfer coefficient of building envelope using smart phone and thermo detector.
building envelope, heat transfer coefficient, building energy conservation, K value detection
Buildings are large consumers of energy in the world. In 2017, construction energy consumption accounted for 36% of the total social energy consumption [1]. Therefore, building energy conservation has become the theme in many countries’ implementation of energy conservation plans. From the current construction guideline of “applicability, economy, environment friendliness and beauty”, it can be seen that China attaches high importance to reducing building energy consumption and protecting the environment. With the continuous emergence of new technologies, new products and new materials, building energy conservation has been put under strict supervision in the construction industry in China, and comprehensive building energy conservation has been integrated into the needs of the new era. In particular, with the update and launch of a series of relevant standards such as the Assessment for Green Buildings (GB/T 50378-2019), energy-saving building materials, products and equipment should be fully taken into consideration in terms of site selection, planning, design, construction and use of buildings, and the thermal performance of building enclosure structures should be reasonably designed [2]. The thermal insulation performance of buildings is the key factor to provide residents with thermal comfort and reduce heat loss, which affects the energy consumption of building heating and cooling [3]. The quality of building insulation performance mainly depends on the heat transfer coefficient of its envelope structure (that is, the K value in the design standard for building energy efficiency). Therefore, the K value of building envelope structure is an important factor that determines the total energy consumption of building heating and cooling system and realizes the best thermal comfort for residents [4]. To evaluate the energy-saving effect of a building, it is necessary to determine the K value of its envelope which can be calculated according to the building drawings and the thermal performance parameters of building materials. However, since the thermal performance and energy-saving effect of building materials applied in practical projects are very different from that of building materials under experimental conditions due to the environmental discrepancy, there might be a large gap between the calculated K value and the on-site measured value [5, 6]. Therefore, the on-site measurement of heat transfer coefficient of building envelope has become an important part in evaluating the thermal performance of the building envelope. Whether for the energy-saving inspection and acceptance of new buildings or for the energy-saving evaluation of existing buildings, it is necessary to test the heat transfer coefficient of building envelope on site, and the demand is growing. This paper mainly discusses the principle and method of on-site detection of heat transfer coefficient of building envelope by smart phones and simple temperature measuring equipment.
From the current measurement technology, it can be seen that the heat-flow meter method, hot box method, temperature control box-heat flow meter method and thermal imaging technology method are mostly used to detect the heat transfer coefficient of building envelope on site.
2.1 Heat-flow meter method
Under the premise of one-dimensional steady-state heat transfer, the heat flow meter is used to detect the heat flow density in the envelope and the difference in surface temperature on both sides of the enclosure, and then the thermal resistance and heat transfer coefficient of the measured object are calculated [7]. The formula for calculation is:
$R=\frac{T_{2}-T_{1}}{E \times C}$ and $K=\frac{1}{R_{i}+R+R_{e}}$
where: R-thermal resistance of the measured object, (m2 • K) /W;
T1-cold side temperature of the envelope, ℃;
T2-temperature at the hot side of the envelope, ℃;
E-heat flow meter reading, mV;
C-test-head coefficient of heat flow meter (calibrated before delivery), W/ (m2 • mV);
K-heat transfer coefficient of the tested object, W/ (m2 • K);
Ri-heat transfer resistance of inner surface of the envelope (m2 • K) /W;
Re-heat transfer resistance of outer surface of the envelope (M2 • K) /W.
The heat flow meter method is the authoritative method to measure the heat transfer coefficient of envelope structure, and it is also the commonly used on-site test method both at home and abroad. When using this method to detect the heat transfer coefficient of the enclosure structure, the more stable the indoor and outdoor temperature is and the greater the indoor and outdoor temperature difference is, the higher the accuracy of the measurement results is [8].
2.2 Hot box method
The hot box method [9] is also based on the principle of one-dimensional steady-state heat transfer. An one-dimensional steady-state heat transfer environment is artificially designed. Then, a hot box is put in the inner side of the tested part to simulate the indoor conditions of the heating building. The temperature of the hot box is easy to control, the time required to adjust the temperature in the box is short, and the energy consumption is small. The other side is exposed to outdoor natural conditions. The temperature in the box shall be kept 8℃ higher than the outdoor temperature so as to ensure that there is an obvious heat flow from indoor to outdoor in the tested part. When the whole temperature field reaches a steady state, the heating amount of the heat box is equal to the quantity of heat transferred through the measured part. The heat transfer capacity of the tested part can be obtained based on the measurement of the heating amount inside the hot box, and then the heat transfer coefficient of the measured part can be calculated. The calculation formula is:
$K=\frac{Q}{A\left( {{T}_{i}}-{{T}_{e}} \right)}$
where: K-heat transfer coefficient of the measured object, W (m2 • K);
Q-heat transfer through the measured object, W;
A-opening area of hot box, m2;
Ti-air temperature inside hot box, ℃;
Te-outdoor air temperature, ℃.
When using the hot box method to measure the heat transfer coefficient of the building envelope, the stable temperature difference only exists on both sides of the tested part, and the heat flow around the tested part may be multidimensional, which may have a large gap with the calculation of heat transfer under one-dimensional steady-state.
2.3 Temperature-controlled box-heat flow meter method
The basic principle of the temperature-controlled box--heat flow meter method is almost the same as that of the heat flow meter method. The difference is that the temperature-controlled box--heat flow meter method uses the temperature-controlled box to create an artificial environment to obtain an ideal inner surface temperature of the enclosure structure, and then uses the heat flow meter method to measure the heat transfer coefficient of the measured object. The advantage of this method is that it is not limited by seasons, and it does not need to consider the boundary heat transfer dimension of the hot box method.
2.4 Thermal imaging method
Nowadays, quantitative thermal imaging technology has become a recognized reliable method to measure the thermal performance of buildings [10, 11]. It has the advantage of fast measurement speed, high sensitivity, vividness and non-contact especially in measuring the heat transfer coefficient (k value) of non-transparent enclosure structure. There are two common principles of using thermal imaging technology to detect the K value of the enclosure: one is to use infrared thermal imager to obtain the internal and external surface temperature of the enclosure, and then calculate the corresponding K value through the relevant formula; the other is to use the thermal image to directly read [12]. Based on a mass of data of walls of different building materials and structures and the thermo gram of the wall measured under different temperature conditions in different climatic regions, a relevant database is established to make the heat transfer coefficient value of each point on the wall surface directly correspond with the infrared thermal image of this point. Different grayscale or color on the infrared image can reflect the heat transfer coefficient value of this point, so when measuring on site, the heat transfer coefficient can be read directly from the infrared image.
From the current on-site detection methods of heat transfer coefficient of building envelope, the existing on-site detection methods of heat transfer coefficient mainly have the following shortcomings:
(1) The equipment is large and inconvenient to carry. Even if some equipment itself is not large, but coupled with temperature and heat flow sensors and wires, it is still inconvenient to carry the equipment.
(2) There are many sensors, which are inconvenient to use. For the heat flow meter method and the temperature- controlled box heat flow meter method, at least three sensors are needed for each measuring point, and each sensor needs a wire to connect with the equipment. If more than three measuring points are measured at the same time, the workload is large, and since many wires are connected with the equipment, it is easy to make mistake. In addition, if the position of the measuring point is high, the fixing of the sensor is also very inconvenient. Although a heat flow sensor can be removed in the hot-box method, it requires a heater and heating amount measurement, which is more inconvenient to use.
(3) The accuracy of measurement results is greatly affected by human factors. On the one hand, when the sensor is fixed to the surface of the measured object, the temperature field and heat flow of the measured object have been affected. Even after a long stable phase, this influence is inevitable due to the existence of the sensor. On the other hand, the tightness of the sensor attached to the surface of the measured object affects the accuracy of the measurement. If the sensor is loosely attached, the measured value differs greatly from the real value. If it is tightly attached, the accuracy of the sensor itself will be affected;
(4) The equipment is expensive and the operation is too professional. The equipment applied in the above-mentioned detection methods are basically owned and used by relevant scientific research institutions or professional detection departments, so the cost for using the equipment is relatively high. In addition, because the equipment is complex, it requires professional operation. Ordinary people who want to know the thermal insulation performance of their houses will not buy and use such equipment. If they really want to learn the heat transfer coefficient of their house envelope, they can only pay to find a professional testing department to test it.
Therefore, the existing on-site detection methods of heat transfer coefficient of building envelope have their own characteristics and merits for the academic research in building energy conservation, while for the engineering application of on-site detection in building energy conservation and ordinary people, there are still many problems, such as high cost, low efficiency, inconvenience, and so on.
In view of the various problems existing in the current detection methods, the research team has developed a set of cost-effective, simple, efficient and fast method to test the heat transfer coefficient of building envelope through theoretical and experimental research, which uses smart phones to detect the heat transfer coefficient of building envelopes.
The principle of using this method to detect the heat transfer coefficient of building envelope is as follows: when there is a large temperature difference between indoor and outdoor and the temperature is relatively stable, there must be a stable heat flow in the building envelope, that is, one-dimensional steady-state heat transfer. According to the heat transfer theory, the formula of heat flow intensity in the envelope structure is as follows [13, 14]:
$q=\frac{{{t}_{i}}-{{t}_{e}}}{{{R}_{0}}}=\frac{{{t}_{i}}-{{\theta }_{i}}}{{{R}_{i}}}$ (1)
The formula can be obtained by transforming formula (1):
${{R}_{0}}=\frac{{{t}_{i}}-{{t}_{e}}}{{{t}_{i}}-{{\theta }_{i}}}{{R}_{i}}$ (2)
Then the heat transfer coefficient of the enclosure is:
$K=\frac{1}{{{R}_{0}}}=\frac{{{t}_{i}}-{{\theta }_{i}}}{\left( {{t}_{i}}-{{t}_{e}} \right){{R}_{i}}}$ (3)
In formulas (1), (2) and (3):
q-heat flow intensity in the measured enclosure during one-dimensional steady-state heat transfer (W/m2);
ti-indoor air temperature (℃);
te-outdoor air temperature (℃);
θi-inner surface temperature of the tested enclosure (℃);
Ri-heat transfer resistance of the inner surface of the tested enclosure (m2·K/W);
R0-total thermal resistance of the tested enclosure (m2·K/W);
K-heat transfer coefficient of the tested enclosure (W/ (m2 • K)
Formula (3) can be programmed into a calculation program and loaded into a mobile phone, and the indoor and outdoor air temperatures ti and te required for calculation can be measured with an ordinary thermometer. They can be considered to be constant in a short time. The internal surface heat transfer resistance Ri is a constant, which is generally taken as 0.11m2 • K/W (winter) and 0.13m2 • k/w (summer) in the calculation of building energy efficiency. Inner surface temperature of enclosure θi is different for different enclosure structures or different positions of the same enclosure structure, which can be obtained conveniently, quickly and accurately by using the non-contact infrared thermometer. When using this method to detect the K value of the enclosure structure, it only needs to input the measured ti, te and constant Ri into the mobile phone calculation program, and then use the infrared thermometer to measure the inner surface temperature of the enclosure structure θi. By inputting it into the calculation program in the mobile phone, the heat transfer coefficient of the corresponding position of the envelope, that is, the K value of the position, can be obtained. When measuring the K value at different positions on the external building envelope of the same room, if the measurement process lasts for a short time (no more than 10 minutes), it can be considered that ti and te have not changed, so there is no need to re-enter ti, te and Ri. Instead, the K value could be obtained only through measuring and inputting θi at the corresponding position. When the K value of each point on the external enclosure structure of different rooms is to be measured or the measurement process lasts for a long time, the corresponding ti, te and Ri values need to be reentered.
This method of detection of the heat transfer coefficient of the building envelope features fast detection speed, high efficiency, low price, and no need of professional operation. The equipment required for this method is simple: a thermometer to measure the indoor and outdoor air temperature, a thermometer to measure the surface temperature of the enclosure, and a smart phone for communication. There is no need for any wire connection during the measurement, and the operation is simple. As long as the measured value is input into the corresponding space, the measurement result can be obtained. There is no need for the surveyor to have professional knowledge background, let alone understanding the relevant calculation formula. This method is very suitable for the energy-saving inspection and acceptance of green buildings and the thermal performance evaluation before the energy-saving transformation of existing buildings. It should be noted that the detection time is best selected in the period when the outdoor temperature is relatively stable around noon in the heating season, and the detection position is selected in the middle of the enclosure with a large area, so that the heat flow in the enclosure is closest to one-dimensional steady-state heat transfer, and the larger the indoor and outdoor temperature difference, the smaller the measurement error is.
The above detection and calculation process is to detect the heat transfer coefficient by measuring the inner surface temperature of the building envelope. During the heating period, the measurement of the inner surface temperature of the outer building envelope is carried out in a relatively comfortable environment, and is not limited by the height of the building, so the value of heat transfer coefficient K is generally obtained by measuring the inner surface temperature θi. Of course, the heat transfer coefficient of the building envelope, i.e. K value, can also be calculated by measuring the external surface temperature of the building envelope during the heating period in the northern severe cold and cold areas, as long as the calculation formula and the corresponding surface heat transfer resistance are changed accordingly.
That is, according to the theory of heat transfer, the formula of heat flow intensity in the enclosure structure is:
$q=\frac{{{t}_{i}}-{{t}_{e}}}{{{R}_{0}}}=\frac{{{\theta }_{e}}-{{t}_{e}}}{{{R}_{e}}}$ (1')
The formula can be obtained through transforming formula (1’):
${{R}_{0}}=\frac{{{t}_{i}}-{{t}_{e}}}{{{\theta }_{e}}-{{t}_{e}}}{{R}_{e}}$ (2')
The heat transfer coefficient of the enclosure is calculated by the following formula:
${{R}_{0}}=\frac{{{t}_{i}}-{{t}_{e}}}{{{\theta }_{e}}-{{t}_{e}}}{{R}_{e}}$ (3')
In formulas (1'), (2') and (3'):
q-heat flow intensity in the measured enclosure during one-dimensional steady-state heat transfer (W/m2);
ti-indoor air temperature (℃);
te-outdoor air temperature (℃);
θe-outer surface temperature of the tested enclosure (℃);
Re-heat transfer resistance of the outer surface of the tested enclosure (m2 • K/W);
R0-total thermal resistance of the tested enclosure (m2 • K/W);
K - heat transfer coefficient of the tested enclosure (W/ (m2 • K).
According to the recommendations of the Code for Thermal Design of Civil Buildings, the heat transfer resistance Re of the outer surface of the external building envelope is 0.04m2 • K/W in winter and 0.05m2 • K/W in summer.
The above research content is based on the on-site detection of the heat transfer coefficient of the outer envelope of buildings in the northern severe cold and cold areas during the heating period. If the heat transfer coefficient of the outer envelope of air-conditioned rooms in summer is to be detected on site (when the indoor and outdoor temperature field is continuously stable, it can be considered as one-dimensional steady-state heat transfer), it is only necessary to change the value of the heat transfer resistance Ri on the inner surface of the envelope or the heat transfer resistance Re on the outer surface, and the corresponding calculation formula remains unchanged. The indoor and outdoor air temperatures ti and te can still be input according to the actual measured values.
In order to test the reliability of the heat transfer coefficient test method for the envelope described in this paper, the research team selected different climatic conditions to conduct a comparative experimental study on the outer envelope structures of the two buildings with the test method described in this paper and the existing test method. Experiment 1: on a sunny day, the K value of a windowless gable in a classroom of No. 2 Teaching Building in University of Science and Technology Liaoning was tested on the spot. Although it was sunny, since the building is blocked by adjacent construction, the gable was not exposed to sunlight, avoiding the impact of sunlight on the experimental results. In Experiment 2, on a cloudy day, the K value of the outer wall of a corridor of No. 5 Teaching Building of Science and Technology Liaoning University was tested on site.
5.1 Testing equipment
The indoor and outdoor air temperature is measured by Taiwan Hengxin AZ8703 hygrometer, and the inner surface temperature of the outer wall is measured by portable infrared thermometer ST60XXAP of Raytek in America. The radiation coefficient ε is 0.95. The on-site detector for measuring the heat transfer coefficient of the enclosure for comparative detection is produced by Beijing Hongou Chengyun Technology Co., Ltd.: JXJ-1 heat flow and temperature inspection instrument. The inspection instrument detects the internal and external surface temperature of the wall and the heat flow in the wall on site, analyzes and calculates the measured data with the attached software, and can output data processing results and data analysis reports.
5.2 Test results
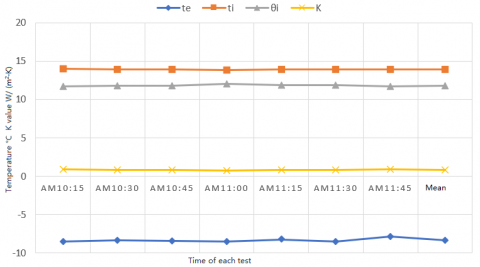
It can be seen from the measured data and the calculation results of the two experiments that both the change trend and deviation are very similar, therefore relevant measurement data of Experiment 1 are mainly demonstrated here. The temperature difference inside and outside the classroom during the measurement period is greater than 20℃, and the indoor and outdoor temperature during the measurement period is relatively stable, so there can be obvious and relatively stable heat flow in the wall, which is conducive to reducing the measurement error. The indoor and outdoor air temperature and internal surface temperature measured by the detection method described in this paper and the K value output by the mobile phone calculation program are shown in Table 1, and the corresponding curve is shown in Figure 1.
The data measured by JXJ-1 heat flow temperature inspection instrument and the calculation and analysis results are shown in Table 2 and Table 3, in which the values of aisle 2 and aisle 4 are the inner surface temperature of the measured envelope, the values of aisle 12 and aisle 13 are the outer surface temperature of the measured envelope, and the values of aisle 7 are the electromotive force corresponding to the heat flux intensity at the measured position in the envelope.
Table 1. Inner and outer air temperature and inner surface temperature of the wall measured at different time and corresponding K value
|
Item |
10:15 |
10:30 |
10:45 |
11:00 |
11:15 |
11:30 |
11:45 |
Average |
|
te(℃) |
8.5 |
8.3 |
8.4 |
8.5 |
8.2 |
8.5 |
7.8 |
8.3 |
|
ti(℃) |
14 |
13.9 |
13.9 |
13.8 |
13.9 |
13.9 |
13.9 |
13.9 |
|
θi(℃) |
11.7 |
11.8 |
11.8 |
12 |
11.9 |
11.9 |
11.7 |
11.8 |
|
K(W/(m2·K)) |
0.93 |
0.86 |
0.85 |
0.74 |
0.82 |
0.81 |
0.93 |
0.85 |
Figure 1. Inner and outer air temperature and inner surface temperature of the wall measured at different time and corresponding K value
Table 2. Data measured by the heat flow and temperature inspection instrument
|
Aisle 02 |
Aisle 03 |
Aisle 04 |
Aisle 05 |
Aisle 06 |
Aisle 07 |
Aisle 08 |
Aisle 09 |
Aisle 10 |
Aisle 11 |
Aisle 12 |
Aisle 13 |
|
11.23 |
-200 |
11.36 |
165.6 |
-192.48 |
1.58 |
-34.18 |
-200 |
-200 |
-200 |
-5.61 |
-5.69 |
|
11.19 |
-200 |
11.32 |
-28.33 |
-200 |
1.59 |
-60.2 |
200 |
-200 |
-195.79 |
-5.64 |
-5.69 |
|
11.18 |
-200 |
11.3 |
-135.85 |
-200 |
1.65 |
-81.61 |
200 |
200 |
-187.85 |
-5.69 |
-5.82 |
|
11.14 |
-200 |
11.32 |
-196.61 |
-200 |
1.69 |
-85.65 |
200 |
200 |
-177.95 |
-5.61 |
-5.72 |
|
11.13 |
200 |
11.32 |
-200 |
200 |
1.73 |
-83.68 |
200 |
200 |
-167.36 |
-5.62 |
-5.74 |
|
11.13 |
200 |
11.34 |
-200 |
200 |
1.79 |
-81.3 |
200 |
200 |
-157.27 |
-5.59 |
-5.68 |
|
11.12 |
200 |
11.32 |
200 |
200 |
1.86 |
-78.85 |
186.48 |
200 |
-147.54 |
-5.56 |
-5.65 |
|
11.11 |
200 |
11.33 |
200 |
200 |
1.81 |
-76.5 |
167.4 |
200 |
-140.62 |
-5.52 |
-5.57 |
|
11.11 |
200 |
11.33 |
200 |
200 |
1.88 |
-73.51 |
150.77 |
186.59 |
-135.46 |
-5.36 |
-5.43 |
|
11.11 |
200 |
11.34 |
200 |
200 |
1.94 |
-70.23 |
133.74 |
168.77 |
-131.51 |
-5.31 |
-5.38 |
|
11.08 |
198.21 |
11.37 |
200 |
191.19 |
1.91 |
-68.66 |
121.12 |
152.29 |
-130.59 |
-6.62 |
-7.07 |
Table 3. Partial reports on the inspection results by the inspection instrument
|
Name of Sample |
|
||
|
Inspected Item |
|||
|
Condition of Instrument before Experiment |
|
Condition of Instrument after Experiment |
|
|
Aisle and Constant |
|||
|
Inner aisle: 02 04; Outer aisle: 12, 13; heat flow aisle: 07; Ri=0.11 m2·k/w; Re=0.04 m2·k/w |
|||
|
Calculation Result |
|||
|
Heat flow coefficient K=0.782 |
|||
5.3 Result analysis
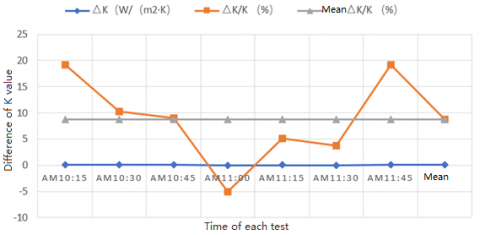
The K value and average K value measured at different moment by the detection method described in this paper are shown in Table 1, and the K value measured by JXJ-1 heat flow and temperature inspection instrument is shown in Table 3, that is, k=0.78 w/ (m2 • K). If the K value measured by the inspection instrument is used as the standard, the difference between the detection value and the standard value (including absolute difference and relative difference) obtained by the detection method studied in this paper at each time is shown in Table 4, and the corresponding curve is shown in Figure 2.
Table 4. Difference between the K value obtained by the detection method in this study and the K value detected by JXJ-1 inspection instrument
|
Item |
10:15 |
10:30 |
10:45 |
11:00 |
11:15 |
11:30 |
11:45 |
Average |
|
$\Delta$ K(W/(m2·K) |
0.15 |
0.08 |
0.07 |
0.04 |
0.04 |
0.03 |
0.15 |
0.07 |
|
$\Delta$ K/K (%) |
19.2 |
10.3 |
9.0 |
5.1 |
5.1 |
3.8 |
19.2 |
9.0 |
Figure 2. Difference between the K value obtained by the detection method in this study and the K value detected by JXJ-1 inspection instrument
It can be seen from Table 4 and Figure 2 that the maximum deviation between the K value measured by the detection method of this study and the K value measured using JXJ-1 heat flow temperature inspection instrument is 19.2%, the minimum deviation is 3.8%, and the average deviation is 9%. The average deviation of Experiment 2 is 7.7%. From the results of the two experiments, it can be seen that the deviation is basically too large, which is mainly caused by the inaccurate measurement of outdoor air temperature. As the outdoor air temperature measuring equipment AZ8703 hygrothermograph is digital and responds quickly to the changes of temperature and humidity, the displayed value of the thermometer is constantly changing due to the influence of outdoor wind. A suitable thermometer can be chosen to make the measurement of indoor and outdoor air temperature more accurate and reliable, so as to improve the accuracy of the heat transfer coefficient of the measured enclosure. Through comparative testing, it can be seen that although there is some error in using smart phones to detect the heat transfer coefficient of building envelope, it can meet the needs of engineering applications such as building energy efficiency evaluation.
The on-site detection method of heat transfer coefficient of building envelope studied in this paper can better solve many shortcomings of existing detection methods, and make the on-site detection of heat transfer coefficient simple, fast, economical and reliable. It is very suitable for the on-site detection of heat transfer coefficient of building envelope in the building energy efficiency inspection and acceptance, and existing building energy efficiency evaluation, and so on.
This paper was supported by Experimental Teaching Reform project of University of Science & Technology Liaoning (Grant No.: SYJG202237).
[1] Al-Homoud, M.S., Krarti, M. (2021). Energy efficiency of residential buildings in the kingdom of Saudi Arabia: Review of status and future roadmap. Journal of Building Engineering, 36: 102143. https://doi.org/10.1016/j.jobe.2020.102143
[2] Ministry of Housing and Urban-Rural Development of the People's Republic of China. Assessment standard for green building (GB/T 50378-2019). Beijing: China Architecture &Building Press, 2019.
[3] Asdrubali, F., D’Alessandro, F., Baldinelli, G., Bianchi, F. (2014). Evaluating in situ thermal transmittance of green buildings masonries-A case study. Case Studies in Construction Materials, 1: 53-59. http://dx.doi.org/10.1016/j.cscm.2014.04.004
[4] Desogus, G., Mura, S., Ricciu, R. (2011). Comparing different approaches to in situ measurement of building components thermal resistance. Energy and Buildings, 43(10): 2613-2620. http://dx.doi.org/10.1016/j.enbuild.2011.05.025
[5] Rehman, H.U. (2017). Experimental performance evaluation of solid concrete and dry insulation materials for passive buildings in hot and humid climatic conditions. Applied Energy, 185: 1585-1594. https://doi.org/10.1016/j.apenergy.2016.01.026
[6] Evangelisti, L., Guattari, C., Gori, P., De Lieto Vollaro, R. (2015). In situ thermal transmittance measurements for investigating differences between wall models and actual building performance. Sustainability, 7(8): 10388-10398. https://doi.org/10.3390/su70810388
[7] Tian, B.S. (2006). Study on in-situ measurement method of heat transfer coefficient of building envelope. Xi’an: Xi’an University of Architecture and Technology.
[8] Fei, H.H., Duan, K. (2000). The onsite check methods and influential factors of constructional energy conservation. Construction Technology, 29(7): 31-33. https://doi.org/10.3969/j.issn.1002-8498.2000.07.015
[9] Wang, F.H., Yao J.B., Wang, D.Y., Wang, X.K., Meng, X.Z. (2008). Study on field test method of heat transfer coefficient of existing building envelope. Building Energy & Environment, 27(5): 60-63. https://doi.org/10.3969/j.issn.1003-0344.2008.05.017
[10] Albatici, R., Tonelli, A.M., Chiogna, M. (2015). A comprehensive experimental approach for the validation of quantitative infrared thermography in the evaluation of building thermal transmittance. Applied Energy, 141: 218-228. https://doi.org/10.1016/j.apenergy.2014.12.035.
[11] Nardi, I., Ambrosini, D., De Rubeis, T., Sfarra, S., Perilli, S., Pasqualoni, G. (2015). A comparison between thermographic and flow-meter methods for the evaluation of thermal transmittance of different wall constructions. In Journal of Physics: Conference Series, 655(1). https://dx.doi.org/10.1088/1742-6596/655/1/012007.
[12] Zhang, W., Li, A.G. (2007). Application of infrared photography in construction power-saving checking. Shanxi Architecture, 33(18): 1-2. https://doi.org/10.3969/j.issn.1009-6825.2007.18.001
[13] Liu, X.T. (2010). Building Physics. Third. Beijing: China Architecture &Building Press.
[14] Liu, N.X., Qin, Y.G. (2005). Building Thermal Environment. First Edition. Beijing: Tsinghua University Press.