Bayu Rudiyanto* | Muhamad Andrianto | Bambang Piluharto | Miftah Hijriawan
© 2022 IIETA. This article is published by IIETA and is licensed under the CC BY 4.0 license (http://creativecommons.org/licenses/by/4.0/).
OPEN ACCESS
Biodiesel is an alternative renewable energy source derived from plants or animals. It reduces greenhouse gas emissions mostly caused by fossil fuels and threatens the environment. Furthermore, biodiesel is clean energy from a mixture of fatty acids and short-chain alcohols, such as esters, produced from oil waste through the transesterification and purification of the dry washing process using magnesium silicate hydrate. This study designed the Response Surface Methodology with the Box Behnken Design consisting of 3 independent variables, namely magnesium silicate hydrate concentration, temperature, and production time required to predict the optimum conditions of biodiesel. This result showed that the biodiesel produced is 85-94.50% with a minimum yield of 85.171% at a 1.6748% adsorbent concentration, 65℃ operating temperature, and 10 minutes. Furthermore, the validation result with the T-Test is achieved by an average of 85.01%.
biodiesel, dry washing, optimization, yield, response surface methodology
In numerous countries, the increase in greenhouse gas emissions threatens the balance of nature, leading to a shift from fossil fuels to renewable sources [1]. In this case, biodiesel is a type of renewable energy that comprises a mixture of fatty acids and short-chain alcohol Ester obtained from the transesterification of animal and vegetable fat [2]. It has similar characteristics to fossil fuels and is an alternative to energy sources [3]. Biodiesel acts as an alternative energy source due to its ability to increase the energy needs and sources of materials that are processed.
Biodiesel is non-toxic and biodegradable, with the ability to reduce emissions of CO, SO2, and other hydrocarbons [4-6]. Nevertheless, the application of biodiesel from palm oil as a substitute for petrodiesel is easily oxidized and damaged due to its high fatty acids [7, 8]. Furthermore, the viscosity of palm oil is higher than petrodiesel, which leads to the formation of smoke and directly destroys the engine [9, 10]. From an economic standpoint, the direct application of biodiesel is less profitable because it competes with commercial palm oil, which disrupts food security. Therefore, alternative raw materials that do not interfere with food security, such as cheap palm oil, Crude Palm Oil (CPO), and cooking oil, are needed.
Waste cooking oil derived from food and household industries is widely available. However, it cannot be reused for cooking due to free fatty acids and harmful radicals [11]. In Indonesia, 6.43 million tons of waste cooking oil is produced yearly [12]. It certainly shows the considerable potential of utilizing waste cooking oil for biofuel as an alternative energy source that is more environmentally friendly than fossil fuels. The previous studies have converted Wasted Cooking Oil into biodiesel. However, some have failed due to the high concentrations of free fatty acids. According to Singh et al. [13], the content can be reduced by applying homogeneous or heterogeneous catalysts. Biodiesel synthesis uses several homogeneous and heterogeneous catalysts for the transesterification process. In the transesterification reaction at 65°C using a homogeneous catalyst, the results showed that the homogeneous catalysts NaOH and H2SO4 (1% by weight) produced the largest yield of 95.15%. For heterogeneous catalysts, the largest yield was obtained using a heterogeneous catalyst SrO. SiO of 96.66% at a temperature of 65℃. Meanwhile, the K3PO4 catalyst, with the help of ZSM-5, can produce solid crystallinity of 101.7% at 175℃ for 24 hours. As a result, heterogeneous catalysts are preferred over homogeneous catalysts in the transesterification process because they can produce a greater yield. This treatment can increase the success of making wasted cooking oil into biodiesel.
Biodiesel, which is a mono-alkyl compound from long chains of fatty acids (triglycerides), can be obtained from vegetable, animal, or wasted cooking oils [14-17]. The processes involved in manufacturing biodiesel from waste cooking oil include esterification, transesterification, and refining [18]. Several purification processes are used to make biodiesel from waste cooking oil. Conventionally, water purification is referred to as the washing method approximately three times to remove impurities, residual glycerol, unreacted methanol, and the remaining catalyst contained in biodiesel. This method is time-consuming because it requires water and large energy [19]. According to Atadashi et al. [20], the difficulty in separating biodiesel from water produces waste in soap emulsions, glycerol, methanol, and catalysts that do not react with the environment due to the immediate discharge of water. Therefore, a purification method without water, adsorbent, and resin are needed during the dry washing process. This purification process can overcome the disadvantages of water washing, including the 100% reduction in the amount of water, shortening the purification process, reducing environmental waste, and being cost-effective. This technology also involves using a small amount of energy in the purification and drying process.
Several types of research on the dry washing method have been widely carried out, such as the studies conducted by Faccini et al. [19], which purified this compound using several adsorbent materials, such as Amberlite BD10 DRY, Silica, Magnesol, and Purolite PD 206. Then, Fadhil et al. [21] reported that activated carbon purifies biodiesel. Moreover, Nadembale et al. [22] stated that ion exchange resin could be employed to purify crude biodiesel. However, it was also reported that magnesium silicate is used to purify biodiesel from transesterification [23-26]. According to Manique et al. [27], rice husk ash serves as an adsorbent. Subsequently, Yang et al. [28] stated bio sorbent fibres could also be employed in the purification process. Following several previous studies, it was discovered that most researchers used magnesium silicate as an adsorbent. However, few studies have been conducted on the optimal use of magnesium silicate hydrates in the dry washing method. Furthermore, the purification using the dry washing method is influenced by several independent variables, namely the concentration of adsorbent, temperature, and the amount of time that affects the yield of the biodiesel [29].
The concentration of adsorbent, temperature, and time involved in the purification process needs to be studied because it serves as a benchmark for the success and quality of the pure biodiesel produced. Therefore, optimization is required to discover the absolute conditions for the independent variables such as adsorbent concentration, temperature, and contact time involved in the dry washing process. The Response Surface modelling with Box Behnken Design was employed because it is the most efficient statistical analysis for complex process optimization [30, 31]. RSM is a statistical method that may be used to design, optimize, and analyze experiments in any process. Traditional optimization methods can only expose one variable at a time, whereas RSM can provide details of interactions and quadratic effects of the process variables involved in the process. RSM offers four benefits: fewer experimental steps, prediction of optimal levels, cost savings, and interacting effects [32]. Ali et al. [2] stated that the evaluated feedstock for biodiesel production in the free lipase contained in liquid utilized the Response Surface Method (RSM). This model predicted that the optimal condition is approximately 86% Fatty Acid Methyl Ester (FAME) yield at a temperature of 44.2℃, the methanol-oil molar ratio of 3.05:1, 0.782 g lipase, the rotation speed of 170 rpm, and an incubation period of 24 hours.
Based on the previous explanation, it can be seen that waste cooking oil has great potential as a raw material for the production of biofuels as a renewable energy source. However, considering the high quantity of free fatty acids in waste cooking oil, more research on converting waste cooking oil into biofuel is needed to achieve a high success rate. Therefore, this study examines the optimization rate of magnesium silicate hydrate as an adsorbent in the purification of dry washing biodiesel from waste cooking oil. RSM was used to determine the best conditions of adsorbent concentration, temperature, and time for the response and quality of biodiesel.
2.1 Material
This study employed the pre-treatment process to reduce the water content and determine the number of free fatty acids contained in the raw materials of the waste cooking oil. The oil was homogenized before the initial treatment by stirring it evenly and heated at approximately 100-105℃ using an IKA® C-MAG HS 7 hot plate-magnetic stirrer to evaporate the water. It is followed by filtering the liquid oil layer from the solid impurities using a separating funnel and a filter paper WhatmanTM 1 Dia: 125 mm. The characterization of waste cooking oil, namely acid number, water content, free fatty acid content, kinematic viscosity, and density of the pycnometer method, was conducted. Furthermore, the purification and bleaching processes are carried out.
The purification process is conducted by heating 1000 mL of the pre-treatment samples at a temperature of 100℃. In addition, IKA® C-MAG HS 7 hot plate-magnetic stirrer was used for stirring the contents at a speed of ±500 rpm. Furthermore, an adsorbent in a mixture of activated charcoal with 5% m/v of oil and rice husk ash with 10% m/v of oil was added. After attaining the reaction time, the process needs to be stopped while the sample is allowed to stand for ±24 hours. Afterwards, it is filtered using filter paper to separate the oil from the adsorbent. The filtered oil's Free Fatty Acid (FFA) levels are analyzed, and assuming the content is <2%, the next technique, namely the transesterification process, is carried out. After the purification process, the content of the oil was characterized by including the acid number, FFA content, viscosity, density, and water content.
The transesterification process starts with the preparation of 200 mL of samples, heated at 55-60℃. Also, the methoxide solution from the mixture of methanol and KOH is added to the used cooking oil at a temperature of 55-60℃ and stirred at ± 500 rpm using an IKA® C-MAG HS 7 hot plate-magnetic stirrer for 60 minutes. This transesterification reaction was carried out with a methanol concentration of 60% m/v waste cooking oil and a KOH P.A catalyst of 0.5% m/v methanol. The sample consists of a mixture of oil and catalyst, is collected and allowed to stand until it reaches room temperature before separating the catalyst from the crude biodiesel. Afterwards, it was inserted into the separating funnel for ± 5 hours to separate glycerol from crude biodiesel. The top layer is crude biodiesel, while the bottom is a side product in the form of glycerol, which is further washed in the next stage.
This study utilized a dry washing method, with the crude biodiesel samples obtained from transesterification mixed using an adsorbent. The mass of adsorbent added is 1% - 2% m/v of the biodiesel sample. The crude biodiesel and adsorbent samples were mixed and heated at 45-65℃ for 10-20 minutes while stirring with a magnetic stirrer at 500 rpm. Furthermore, the outcome is allowed to stand for 2 hours and separated using filter paper.
2.2 Research parameters
The parameters in this study include the yield of biodiesel produced from dry washing using activated magnesium silicate hydrates. Biodiesel yield is the percentage ratio between the pure biodiesel (PB) with initial oil (IO) products. The equation for calculating yield is as follows:
Yield $(\%)=(P B(m l)) /(I O(m l)) \times 100 \%$ (1)
The data analysis used in this study is the optimization analysis with Response Surface Methodology and Box Behnken Design (BBD) through the help of MINITAB 17 software. The experimental design utilizes three factors independent variables, namely absorbent concentration (X1), purification temperature (X2), and time purification (X3). The optimized response variable (Y) is the yield of biodiesel production. The relationship between code and treatment is shown in Table 1. The selection of magnesium silicate hydrate concentrations was based on the research of Arifin et al. [26] and Darmawan and Susila [29], who used an adsorbent concentration of 1% for the highest yield. The concentration of 2% is selected based on the hypothesis that the higher the adsorbent concentration will produce the highest yield. The use of 10, 15, and 20 minutes are based on the research of Wisesa [32], which stated that 15 minutes is the most optimal time to get the best biodiesel quality. Whereas Puspaningrum [33] stated that 10-15 minutes is an effective time for use in stirring contact between a mixture of oil and biodiesel, and the use of 20 minutes is based on the hypothesis that the longer contact time of the coarse biodiesel mixture with the adsorbent will produce an optimal yield. The temperature used in this study was 45℃, 55℃, and 65℃. Based on Dyah and Zibbeni, [34] and Wisesa [32], 55℃ is the most optimal temperature to produce the highest yield. Meanwhile, the use of temperatures below 55℃ will reduce the yield. When above 65℃, magnesium silicate hydrates will deactivate or decrease the adsorbent's performance capability because temperatures above 55℃ are the saturation point.
A common problem with RSM is that the relationship between the response variable and the independent variable is unknown. Therefore, the first step in RSM is to find the form of the relationship between the response and several independent variables through an appropriate approach. The form a linear relationship is a form of relationship that is tried first because it is the simplest form of relationship (low-order polynomial). Suppose it turns out that the condition of the relationship between the response and the independent variable is a linear function. In that case, the functional approach is called a first-order model, as shown in Eq. (2):
$y=\beta_{0}+\beta_{1} x_{1}+\beta_{2} x_{2}+\cdots+\beta_{k} x_{k}+\varepsilon_{i}$ (2)
The first step in using RSM is finding the appropriate functions between the response and independent variables. A regression model was created to determine the link. In general, the form of the second-order regression equation is shown in Eq. (3):
$y=\beta_{0}+\sum_{i=1}^{k} \beta_{i} x_{i}+\sum_{i=1}^{k} \beta_{i i} x_{i}^{2}+\cdots+\sum_{i<j} \sum \beta_{i j} x_{i} x_{j}+\varepsilon$ (3)
Table 1. Coded and actual designed variables used for experimental design
|
Design Variable (Factor) |
Coded Variable |
Actual values of coded levels |
||
|
-1 |
0 |
1 |
||
|
Adsorbent Concentration (% m/v of biodiesel sample) |
X1 |
1 |
1.5 |
2 |
|
Temperature (°C) |
X2 |
45 |
55 |
65 |
|
Time (minutes) |
X3 |
10 |
15 |
20 |
If the value of k is 3, then the estimator for the second-order model is as shown in Eq. (4):
$Y=b_{0}+b_{1} X_{1}+b_{2} X_{2}+b_{3} X_{3}+b_{11} X_{1}^{2}+b_{22} X_{2}^{2}$$+b_{13} X_{1} X_{3}+b_{23} X_{2} X_{3}$ (4)
In this case $b_{0}$ is a constant and $b_{i}$ is a model parameters coefficient, while $X_{i}$ is an independent variable where i represents 1,2,3, ..., k. This study developed RSM with its interactive term for Yield (%) using Eq. (5).
$y=b_{0}+\sum_{i=1}^{n} b_{i} x_{i}+\sum_{i=1}^{n} b_{i i} x_{i}^{2}+\sum_{i<j}^{n} b_{i j} x_{i} x_{j}$ (5)
where, y is the predicted response, xi is the coded variables, and b0, bi, bii, bij are the regression coefficient. The values of the regression coefficients were determined using the ordinary least square method in the following Eq. (6) [31].
$b=\left(x^{\prime} x\right)^{-1} x^{\prime} y$ (6)
where, b is a column vector of the regression coefficients, x is the design matrix of the input variables' coded levels, and y is the column vector of the response.
3.1 Characterization, pre-treatment, purification, and bleaching of waste cooking oil
The initial characterization process of waste cooking oil is carried out to determine the free fatty acid levels, acid numbers, density, viscosity, and water content. The results from this process are shown in Table 2.
Table 2. The difference in the quality of waste cooking oil before and after purification
|
Testing Parameters |
Characterization Results |
|
|
Before Purification |
After Purification |
|
|
FFA level (%) |
3.2 |
0.94 |
|
Acid Numbers (mgKOH/gram) |
6.62 |
1.99 |
|
Density (Kg/m3) |
903 |
890 |
|
Viscosity (cSt) |
48.5425 |
46.0992 |
|
Water content (%) |
1.598 |
0.46 |
The results from the analysis of waste cooking oil in Table 2 show that the content of FFA and the acid number are 3.20% and 6.62 mgKOH/gram, respectively. Therefore, it is not directly used as a biofuel because one of its direct applications can cause damage to the engine by increasing the corrosity due to its high acid content. The results from the preliminary analysis showed that waste cooking oil is not directly processed with the transesterification reaction because the range of free fatty acids is more than 2%. However, a saponification process occurs assuming the transesterification reaction is carried out. Therefore, purification and bleaching processes need to be conducted to reduce the FFA levels.
Cooking oil that has been used as a frying medium and heat conductor will be in contact with oxygen, so it will quickly cause an oxidation process. As a result of this process, used cooking oil or used cooking oil will be brown to black and cause an unpleasant odour. To avoid this situation, wasted cooking oil must be refined before being re-consumed or used as a biodiesel source material. The purification process of used cooking oil aims to reduce the oil's FFA content and eliminate unpleasant odours. One of the refining processes for used cooking oil is bleaching, which is a process that aims to remove or disguise the brown to black colour of used cooking oil due to heating and oxidation processes using an adsorbent. Therefore, the right choice of method is the purification and bleaching process to reduce FFA levels. The high value of acid number and FFA content causes an increase in the value of viscosity and density.
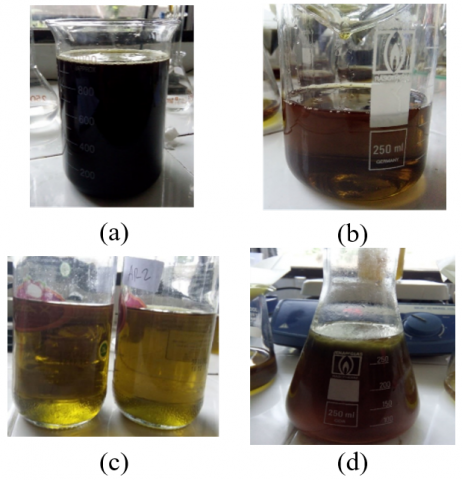
The purification and bleaching process aims to reduce FFA levels and improve the colour, which is turbid and black. A visual comparison of the initial waste cooking oil and purification results is shown in Figure 1.
The purification process is carried out using rice husk ash, which has acidic properties, and it absorbs acids contained in the oil, thereby reducing the FFA levels. Meanwhile, the colour was bleached using a 5% m/v waste cooking oil of synthetic activated charcoal cleaning agent in fine form, which serves as an adsorbent media. Table 2 illustrates the decline in the FFA levels, acid numbers, viscosity, water content, and density.
The previous FFA level of 3.20% decreases to 0.94%. It implies that the purification and bleaching process was eligible. Therefore the transesterification technique needs to be continued. In addition, it also leads to a decrease in viscosity and water content. Purification also reduces the density to 890 kg/m3. However, it is expected that during the transesterification process, density within the range of 850-890 kg/m3 needs to be obtained. It follows the Indonesian National Standard (SNI), where biodiesel has a density value of 850-890 kg/m3 at 40℃. In this case, the density value needs to reach 850 kg/m3 because it is related to the calorific value and the power produced by the diesel engine. A low-density value will create a high calorific value.
3.2 Transesterification process
Figure 1. Visual comparison of waste cooking oil colour before (a) and after purification (b), and the crude biodiesel transesterification (c) and glycerol (d)
The transesterification process needs to be allowed for ±8 hours using a separating funnel. However, the main purpose is to separate biodiesel from glycerol. Biodiesel has a brighter colour than the side product in the form of glycerol, as shown in Figure 1.
3.3 Biodiesel purification with dry washing method
This method begins by activating the adsorbent and separating the sample from the transesterification, which contains residuals of catalyst, glycerol, unreactive methanol, and other contaminants, all of which are quantified separately by volume. Furthermore, the concentration of magnesium silicate hydrate is determined by 1%, 1.5%, and 2% of the volume of transesterified oil, as shown in Table 1. The results showed that the highest yield of 94.5% was obtained at a 2% concentration treatment. It shows that a higher adsorbent concentration tends to produce the highest yield. The concentration causes the adsorption process to be properly executed. Furthermore, the purification process with dry washing is also influenced by time and temperature.
The duration process of dry washing is quite short compared to the wet washing method. In this research, the process lasted for 10, 15, and 20 minutes. According to the results, the treatment time of 20 minutes produced biodiesel with the largest yield of 94.5%. A longer contact time of a crude biodiesel and adsorbent mixture produces an optimal yield. In addition, using a higher concentration and stirring time results in greater yield gains. However, this condition does not apply to the temperature treatment, which was 45℃, 55℃, and 65℃. In this research, the highest yield of 94.5% was obtained at a temperature of 55℃. The application of a temperature less than 55℃ reduces the yield.
3.4 Biodiesel yield
The yield of biodiesel from the transesterification and purification by the dry washing method using activated magnesium silicate hydrates is within the range of 85.00 - 94.50%, as shown in Table 3. A determination test (R2), the fitting of the predicting model to the experimental data, was conducted to determine the independent variables' influence on the yield response. The resulting R2 value is 0.9783 at a 95% confidence level. It means that the yield of biodiesel is influenced by the independent variables, while 2.17% is influenced by others, as shown in Table 4.
The processed result is the second-order mathematical model, which is stated as shown in Eq. (7):
$\begin{aligned} Y_{\text {Yield }}=91.167 &+0.063 x_{1}+0.750 x_{2}+0.937 x_{3} \\ &+1.167 x_{1}{ }^{2}-3.208 x_{2}{ }^{2} \\ &+0.667 x_{3}^{2}-0.625 x_{1} x_{2} \\ &+0.250 x_{1} x_{3}+3.125 x_{2} x_{3} \end{aligned}$ (7)
The lack of fit testing examines the second-order model for the yield response in Eq. (7). The equation shows that the Yield response proportionally increases under the absorbance concentration, temperature, processing time, and interaction, as shown by the positive constant value. Furthermore, a negative constant value indicates the yield response decreases due to temperature interaction and absorbance concentration.
According to Table 4, the outcome of this test shows that the resulting P-value of 0.190 is greater than the 0.05 degree of error. It simply means that the lack of fit is not significant. Therefore, the second-order model is accepted and appropriate.
Table 3. Box-Behnken design arrangement and response
|
No. Run |
Factor (Controllable input variable) |
Biodiesel Production Yield (%) |
||||||
|
Concentration (%) |
Temperature (℃) |
Time (min) |
||||||
|
X1 |
C |
X2 |
T |
X3 |
t |
Experimental |
Predicted |
|
|
1 |
-1 |
1 |
-1 |
45 |
0 |
15 |
88.00 |
87.75 |
|
2 |
1 |
2 |
-1 |
45 |
0 |
15 |
88,5 |
89.13 |
|
3 |
-1 |
1 |
1 |
65 |
0 |
15 |
91.00 |
90.51 |
|
4 |
1 |
2 |
1 |
65 |
0 |
15 |
89.00 |
89.40 |
|
5 |
-1 |
1 |
0 |
55 |
-1 |
10 |
92.00 |
92.31 |
|
6 |
1 |
2 |
0 |
55 |
-1 |
10 |
92,5 |
91.95 |
|
7 |
-1 |
1 |
0 |
55 |
1 |
20 |
93.00 |
93.70 |
|
8 |
1 |
2 |
0 |
55 |
1 |
20 |
94,5 |
94.33 |
|
9 |
0 |
1.5 |
-1 |
45 |
-1 |
10 |
90.00 |
90.12 |
|
10 |
0 |
1.5 |
1 |
65 |
-1 |
10 |
85.00 |
85.39 |
|
11 |
0 |
1.5 |
-1 |
45 |
1 |
20 |
86.00 |
85.76 |
|
12 |
0 |
1.5 |
1 |
65 |
1 |
20 |
93,5 |
93.52 |
|
13 |
0 |
1.5 |
0 |
55 |
0 |
15 |
91.00 |
90.99 |
|
14 |
0 |
1.5 |
0 |
55 |
0 |
15 |
90,75 |
90.99 |
|
15 |
0 |
1.5 |
0 |
55 |
0 |
15 |
91.00 |
90.99 |
Table 4. ANOVA of the RSM model corresponding to the response performance index (Yield)
|
Source |
|
DF |
Adj SS |
Adj MS |
F-Value |
P-Value |
|
|
Model |
|
9 |
100.329 |
11.1477 |
25.00 |
0.001 |
|
|
|
Linear |
3 |
11.563 |
3.8542 |
8.64 |
0.020 |
|
|
|
Concentration |
1 |
031 |
0.0313 |
0.07 |
0.802 |
|
|
|
Temperature |
1 |
4.500 |
4.5000 |
10.09 |
0.025 |
|
|
|
Time |
1 |
7.031 |
7.0313 |
15.77 |
0.011 |
|
|
|
Square |
3 |
47.892 |
15.9639 |
35.81 |
0.001 |
|
|
|
Concentration × Concentration |
1 |
5.026 |
5.0256 |
11.27 |
0.020 |
|
|
|
Temperature × Temperature |
1 |
38.006 |
38.0064 |
85.25 |
0.000 |
|
|
|
Time × Time |
1 |
1.641 |
1.6410 |
3.68 |
0.113 |
|
|
|
2-way Interaction |
3 |
40.875 |
13.6250 |
30.56 |
0.001 |
|
|
|
Concentration × Temperature |
1 |
1.562 |
1.5625 |
3.50 |
0.120 |
|
|
|
Concentration × Time |
1 |
0.250 |
0.2500 |
0.56 |
0.488 |
|
|
|
Temperature × Time |
1 |
39.063 |
39.0625 |
87.62 |
0.000 |
|
|
Error |
|
5 |
2.229 |
0.4458 |
|
|
|
|
|
Lack-of- Fit |
3 |
1.938 |
0.6458 |
4.43 |
0.190 |
|
|
|
Pure error |
2 |
0.292 |
0.1458 |
|
|
|
|
Total |
|
|
14 |
102.558 |
|
|
|
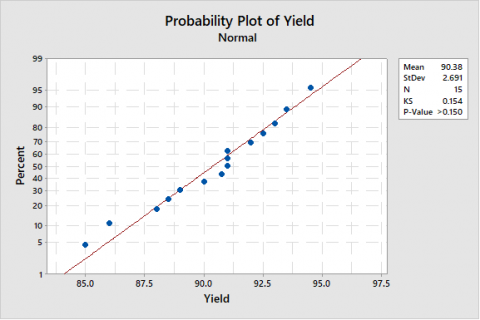
Figure 2. Kolmogorov-Smirnov normality test
The residual assumption is independent, assuming the value of the Auto-correlation Function (ACF) is at an interval of ±2 /√n, where n is 15. Therefore, it is observed that the independent residual assumptions fulfilled the second-order model in equation 7. A normal distribution test is carried out to determine the model deviation. Residuals are stated to be normally distributed, assuming the residual point produced approaches a predetermined straight line. The statistical results from the Kolmogorov-Smirnov (KS) normal distribution test in Figure 2 showed that the KS at 0.154 is less than the statistical value of 0.338 obtained at a confidence level of 0.05. Therefore, the residual normality test is normally distributed.
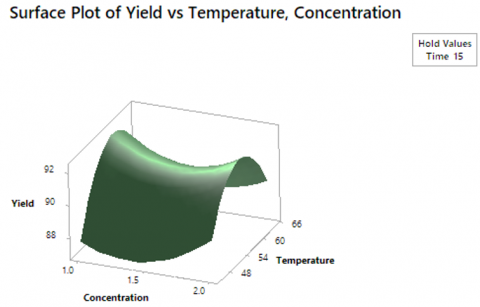
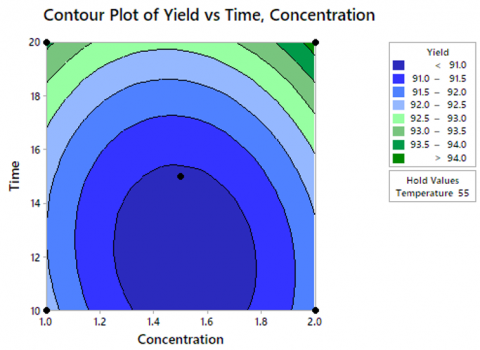
Testing conducted on the residual assumptions from Identic, Independent, and Normal Distribution in the equation model concluded that the three residual assumptions were fulfilled. Therefore, the model is appropriate. The plot of the response surface, which is a function of two out of the three tested variables, is used to easily determine the influencing factors. Figure 3. shows the relationship between temperature and concentration of the response surface formed and the plot contour with yield values within the range of 91-92%. The interaction between temperature and adsorbent concentration during biodiesel purification affects yield formation.
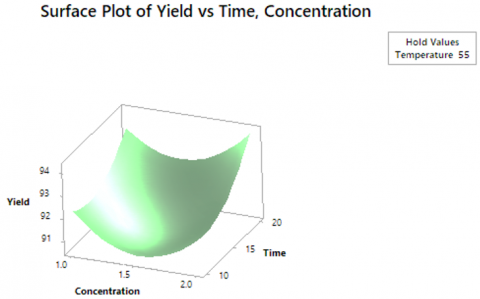
The relationship between time and concentration in the surface response and contour plots is shown in Figure 4. It is observed that the relationship between time and concentration is within the range of 91 - 91.5%. The interactions between temperature and concentration of adsorbent affect the yield of biodiesel from the purification process using the dry washing method.
(a)
(b)
Figure 3. Relationship of temperature and concentration on the surface plot of yield response (a) and contour plot (b)
(a)
(b)
Figure 4. Relationship between time and concentration on the surface plot of yield response (a) and contour plot (b)
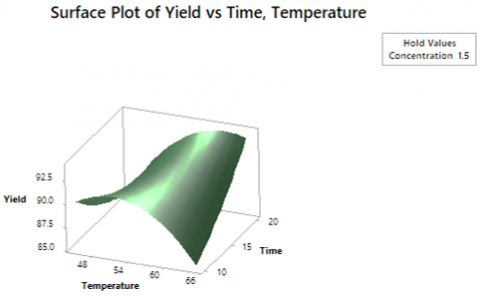
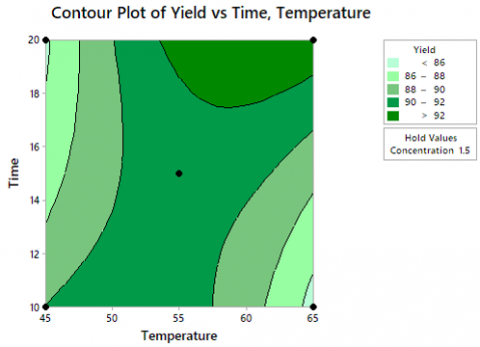
The interaction between temperature and reaction time influences yield formation. Visually, biodiesel yield is formed within 90-92%, as shown in Figure 5. Table 4 showed a significant interactive effect of reaction temperature and time with the interactive effect demonstrated in Figure 5. The effect of reaction temperature on yield at 10 minutes differed from 20 minutes. The reaction temperature has an overall negative and positive effect on yield at 10 minutes and 20 minutes.
The dry washing method's yield optimization response is based on examining temperature, duration, and the overall concentration of adsorbent used. The optimum value occurs when the adsorbent concentration is 1.6748%, the condition for the operating temperature is 65℃, and the time is 10 minutes. The optimum solution on the surface response produces a minimum yield of y=85.17% with a composite desirability value d=0.98. Therefore, to produce a high biodiesel yield value, it needs to be under the operating conditions discovered using the optimum solution. The optimum adsorbent concentration with a minimum yield of 1.6748% produces a minimum response.
(a)
(b)
Figure 5. Relationship between temperature and time towards the surface plot of yield response (a) and contour plot (b)
3.5 The validation of yield response optimization results on initial conditions
Validation is conducted to determine the extent to which the yield of experimental biodiesel is under the expected optimization. Testing is carried out with a T-test on the CI (Confidence Interval) of 95% or 0.05. The results from the T-test are shown in Table 5.
Table 5. Result T-test
|
Test of µ=85.01 vs ≠ 85.01 |
|||||||
|
Response |
N |
Mean |
StDev |
SE Mean |
95% CI |
T |
P |
|
Yield |
5 |
85.0100 |
0.1673 |
0.0748 |
(84.8022;85.2178) |
-0.00 |
1.000 |
Table 6. Validation of yield response optimization results
|
Ratio |
Independent Variable |
Respond Yield (%) |
||
|
Concentration (%) |
Temperature (℃) |
Time (minutes) |
||
|
Experimental |
1.6748 |
65 |
10 |
85.01 |
|
Prediction |
1.6748 |
65 |
10 |
85.171 |
The results from the T-test in Table 5 show that the PI (Predicted Interval) value of the response is from 84.8022% to 85.2178%, with a P-value of 1.00, which is greater than 95% CI (Confidence Interval). Therefore, H0 is accepted, this implies that statistically, the yield of biodiesel optimization is similar to the re-examination. Based on the results in Table 5, the optimization of the yield response (minimum) is 85,171 at a concentration of 1.647%, temperature of 65℃, and 10 minutes. A difference of 0171% was detected between the initial and optimum conditions, as shown in Table 3. This difference is caused by various concentrations of adsorbent, which led to different yield responses. The validation of the yield response (minimum) results between experimental and predictive shows that the difference is not large, at 0.161%, as shown in Table 6.
The purification is carried out by dry washing using a cleaning agent such as magnesium silicate hydrate, which increases the quality and yield of the biodiesel produced. The results showed that the highest yield of 94.5% was obtained at treatment with 2% concentration, which increases following a rise in adsorbent concentration. Furthermore, the longer contact time of a coarse biodiesel mixture with adsorbent produces a more optimal yield. Meanwhile, the use of temperatures less than 55℃ reduces the yield, and those above 65℃ deactivate or decrease the performance ability of the magnesium silicate hydrate because it has reached its saturation point. The research showed that the transesterification and purification processes produced biodiesel using the dry washing method and activated magnesium silicate hydrates obtained a minimum yield of 85% in the treatment at an adsorbent concentration of 1.5%, a temperature of 65℃ and with 10 minutes of stirring time. Meanwhile, the validation results on the yield response optimization obtained a minimum yield of 85.171% in treatments at a 1.6748% concentration level, the temperature of 65℃, and in 10 minutes. The validation results using the T-test obtained an average yield of 85.01%. Therefore, it can be concluded that biodiesel production from waste cooking oil using the purification process is the right effort used to increase its economic value and usefulness.
|
Nomenclature |
|
|
Y |
Yield |
|
X1 |
Concentration |
|
X2 |
Temperature |
|
X3 |
Time |
|
y |
Predicted response |
|
x |
Coded variables |
|
b |
Regression coefficient |
|
PB |
Pure Biodiesel |
|
IO |
Initial Oil |
|
Abbreviation |
|
|
BBD |
Box Behnken Design |
|
FAME |
Fatty Acid Methyl Ester |
|
RSM |
Response Surface Methodology |
|
CPO |
Crude Palm Oil |
|
FFA |
Free Fatty Acid |
|
ANOVA |
Analysis of variance |
|
KS |
Kolmogorov-Smirnov |
|
CI |
Confidence Interval |
[1] Jiang, Y., Zhang, Y. (2016). Supply chain optimization of biodiesel produced from waste cooking oil. Transportation Research Procedia, 12: 938-949. https://doi.org/10.1016/j.trpro.2016.02.045
[2] Ali, C.H., Qureshi, A.S., Mbadinga, S.M., Liu, J.F., Yang, S.Z., Mu, B.Z. (2017). Biodiesel production from waste cooking oil using onsite produced purified lipase from Pseudomonas aeruginosa FW_SH-1: Central composite design approach. Renewable Energy, 109: 93-100. https://doi.org/10.1016/j.renene.2017.03.018
[3] Can, Ö. (2014). Combustion characteristics, performance and exhaust emissions of a diesel engine fueled with a waste cooking oil biodiesel mixture. Energy Conversion and Management, 87: 676-686. https://doi.org/10.1016/j.enconman.2014.07.066
[4] Noiroj, K., Intarapong, P., Luengnaruemitchai, A., Jai-In, S. (2009). A comparative study of KOH/Al2O3 and KOH/NaY catalysts for biodiesel production via transesterification from palm oil. Renewable Energy, 34(4): 1145-1150. https://doi.org/10.1016/j.renene.2008.06.015
[5] Takase, M., Zhang, M., Feng, W., Chen, Y., Zhao, T., Cobbina, S.J., Wu, X. (2014). Application of zirconia modified with KOH as heterogeneous solid base catalyst to new non-edible oil for biodiesel. Energy Conversion and Management, 80: 117-125. https://doi.org/10.1016/j.enconman.2014.01.034
[6] Xue, J., Grift, T.E., Hansen, A.C. (2011). Effect of biodiesel on engine performances and emissions. Renewable and Sustainable Energy Reviews, 15(2): 1098-1116. https://doi.org/10.1016/j.rser.2010.11.016
[7] Wang, W.C., Zhai, Y.L., Li, F.S., Li, Y. (2020). Application and analysis of rapid determination of oxidative degradation of biodiesel by surface tension and UV absorbance. Renewable Energy, 152: 1431-1438. https://doi.org/10.1016/j.renene.2020.01.082
[8] Kumar, N. (2017). Oxidative stability of biodiesel: Causes, effects and prevention. Fuel, 190: 328-350. https://doi.org/10.1016/j.fuel.2016.11.001
[9] Rabelo Neto, R.C., Lima, D.O., Pinheiro, T.D., Almeida, R.F., Castro Dantas, T.N., Dantas, M.S., Azevedo, D.C. (2004). Thermo-oxidative stability of mineral naphthenic insulating oils: combined effect of antioxidants and metal passivator. Industrial & Engineering Chemistry Research, 43(23): 7428-7434. https://doi.org/10.1021/ie049645o
[10] Knothe, G. (2002). Structure indices in FA chemistry. How relevant is the iodine value? Journal of the American Oil Chemists' Society, 79(9): 847-854. https://doi.org/10.1007/s11746-002-0569-4
[11] Soegiantoro, G.H., Chang, J., Rahmawati, P., Christiani, M.F., Mufrodi, Z. (2019). Home-made eco green biodiesel from chicken fat (CIAT) and waste cooking oil (PAIL). Energy Procedia, 158: 1105-1109. https://doi.org/10.1016/j.egypro.2019.01.267
[12] Kuncahyo, P., Fathallah, A., Sanuri, S.S.S.S.S. (2013). Analisa prediksi potensi bahan baku biodiesel sebagai suplemen bahan bakar motor diesel di Indoesia. Jurnal Teknik ITS, 2(1): B62-B66. https://doi.org/10.12962/j23373539.v2i1.3156
[13] Singh, D., Sharma, D., Soni, S.L., Sharma, S., Sharma, P.K., Jhalani, A. (2020). A review on feedstocks, production processes, and yield for different generations of biodiesel. Fuel, 262: 116553. https://doi.org/10.1016/j.fuel.2019.116553
[14] Risnoyatiningsih, S. (2012). Biodiesel from avocado seeds by transesterification process. Jurnal Teknik Kimia, 5(1): 345-351.
[15] Atadashi, I.M., Aroua, M.K., Aziz, A.A., Sulaiman, N.M.N. (2013). The effects of catalysts in biodiesel production: A review. Journal of Industrial and Engineering Chemistry, 19(1): 14-26. https://doi.org/10.1016/j.jiec.2012.07.009
[16] Silitonga, A.S., Masjuki, H.H., Mahlia, T.M.I., Ong, H.C., Chong, W.T. (2013). Experimental study on performance and exhaust emissions of a diesel engine fuelled with Ceiba pentandra biodiesel blends. Energy Conversion and Management, 76: 828-836. https://doi.org/10.1016/j.enconman.2013.08.032
[17] Ong, H.C., Masjuki, H.H., Mahlia, T.M.I., Silitonga, A.S., Chong, W.T., Leong, K.Y. (2014). Optimization of biodiesel production and engine performance from high free fatty acid Calophyllum inophyllum oil in CI diesel engine. Energy conversion and Management, 81: 30-40. https://doi.org/10.1016/j.enconman.2014.01.065
[18] Veljković, V.B., Banković-Ilić, I.B., Stamenković, O.S. (2015). Purification of crude biodiesel obtained by heterogeneously-catalyzed transesterification. Renewable and Sustainable Energy Reviews, 49: 500-516. https://doi.org/10.1016/j.rser.2015.04.097
[19] Faccini, C.S., Cunha, M.E.D., Moraes, M.S.A., Krause, L.C., Manique, M.C., Rodrigues, M.R.A., Caramão, E.B. (2011). Dry washing in biodiesel purification: a comparative study of adsorbents. Journal of the Brazilian Chemical Society, 22(3): 558-563.
[20] Atadashi, I.M., Aroua, M.K., Aziz, A.A., Sulaiman, N.M.N. (2015). Crude biodiesel refining using membrane ultra-filtration process: An environmentally benign process. Egyptian Journal of Petroleum, 24(4): 383-396. https://doi.org/10.1016/j.ejpe.2015.10.001
[21] Fadhil, A.B., Dheyab, M.M., Abdul-Qader, A.Q.Y. (2012). Purification of biodiesel using activated carbons produced from spent tea waste. Journal of the Association of Arab Universities for Basic and Applied Sciences, 11(1): 45-49. https://doi.org/10.1016/j.jaubas.2011.12.001
[22] Nedambale, N., Thokan, Z., Whitaker, R., Matambo, T., Low, M., Harding, K.G. (2013). Biodiesel purification: Comparing water washing with ion exchange resins. Chemical Technology.
[23] Swati, G. (2014). wet and dry washing purification method for biodiesel/Swati Gupta. In Wet and Dry Washing Purification Method for Biodiesel, International Conference of Advance Research and Innovation, pp. 592-596.
[24] Ismail, S.A.E.A., Ali, R.F.M. (2015). Physico-chemical properties of biodiesel manufactured from waste frying oil using domestic adsorbents. Science and Technology of Advanced Materials. https://doi.org/10.1088/1468-6996/16/3/034602
[25] Farid, M.A.A., Hassan, M.A., Taufiq-Yap, Y.H., Shirai, Y., Hasan, M.Y., Zakaria, M.R. (2017). Waterless purification using oil palm biomass-derived bioadsorbent improved the quality of biodiesel from waste cooking oil. Journal of Cleaner Production, 165: 262-272. https://doi.org/10.1016/j.jclepro.2017.07.136
[26] Arifin, Z., Rudiyanto, B., Susmiati, Y. (2016). Produksi Biodiesel dari Minyak Jelantah Menggunakan Katalis Heterogen Cangkang Bekicot (Achatina fulica) dengan Metode Pencucian Dry Washing. Jurnal Rotor, 9(2): 100-104.
[27] Manique, M.C., Onorevoli, B., Lacerda, L.V., Alves, A.K., Bergmann, C.P. (2016). Evaluation of a methodology of biodiesel purification: Study of the contaminant removal capacity. Biofuels, 7(2): 155-161. https://doi.org/10.1080/17597269.2015.1122473
[28] Yang, J., He, Q.S., Niu, H., Corscadden, K., Caldwell, C. (2016). A comparative study on the performance of fiber-based biosorbents in the purification of biodiesel derived from camelina sativa. Journal of Technology Innovations in Renewable Energy, 5(4): 123-132. https://doi.org/10.6000/1929-6002.2016.05.04.2
[29] Darmawan, F.I., Susila, I.W. (2013). Proses Produksi Biodiesel dari Minyak Jelantah dengan Metode Pencucian Dry-Wash Sistem. Jurnal Teknik Mesin, 2(1).
[30] Montgomery, D.C. (2001). Design and Analysis of Experiments. United Stated of America: John Willey and Sons, Inc.
[31] Gunst, R.F., Myers, R.H., Montgomery, D.C. (2002). Response Surface Methodology: Process and Product Optimization Using Designed Experiments. New Jersey: JohnWiley & Sons. https://doi.org/10.2307/1270613
[32] Wisesa, S.A. (2015). Pemurnian Metode Dry Washing untuk Meningkatkan Kualitas Biodiesel Hasil Transesterifikasi dengan Katalis Basa Heterogen. Politeknik Negeri Jember.
[33] Puspaningrum, S. (2007). Pengaruh Jenis Adsorben pada Pemurnian Biodiesel dari Minyak Jarak Pagar (Jatropha curcas L.). Institut Pertanian Bogor.
[34] Dyah, A.R.N., Zibbeni, A. (2010). Pengaruh Stir Washing, Bubble Washing dan Dry Washing Terhadap Kadar Metil Eester Dalam Biodiesel Dari Biji Nyamplung (Calophyllum inophyllum). Institut Teknologi Sepuluh Nopember.