Zainal Arifin* | Bhimo Ageng Tribhuwana | Budi Kristiawan | ominicus Danardono Dwi Prija Tjahjana | Syamsul Hadi | Rendy Adhi Rachmanto | Singgih Dwi Prasetyo | Miftah Hijriawan
© 2022 IIETA. This article is published by IIETA and is licensed under the CC BY 4.0 license (http://creativecommons.org/licenses/by/4.0/).
OPEN ACCESS
Solar energy is renewable energy with infinite amounts and low emissions. The work of the solar panel is affected by the increase in its working temperatures. In this study, 50 Wp polycrystalline solar panel with and without soybean wax placed on backplate solar panels using PCM container as a passive cooling system were simulated on the solar simulator with variations in light intensity of 400 W/m2, 600 W/m2, 900 W/m2, 1000 W/m2, and 1100 W/m2. The blower was simulated the ambient wind in the surrounding area constantly. The PV panel temperature simulation approach was carried out to determine the error in the experimental results. The simulation obtained the average temperature at 1100 W/m2 intensity of PV panels with and without soybean wax PCM 56.8℃ and 48.6℃, respectively. The experiment show that PV applied with soybean wax as a passive cooling system can reduce the maximum PV temperature at 1100 W/m2 intensity from 60.7℃ to 54.7℃ and increase its maximum efficiency by 0.42% at 900 W/m2 intensity. Soybean wax cooling system has proven to be effective in reducing PV temperature. The error values from the simulation and experimental results of PV panels with and without PCM are 6.9% and 12.61%, respectively.
cooling system, PCM, photovoltaic, temperature
The world population is increasing every year, which is 2050 predicted that the world population will increase by 9.6 billion [1]. This population size affects the increase in energy sources, especially on a large scale. Issues of non-renewable resources are getting less encouraging researchers to develop renewable energy sources. Various experts have conducted renewable energy research, such as solar energy [2, 3]. Solar energy is a renewable energy source with an unlimited supply and produces few emissions. A photovoltaic (PV) solar panel may convert solar energy into electrical energy [4]. This PV system utilizes solar cell technology to convert photon energy from sunlight into electrical energy. However, the efficiency of the common PV modules on the market is around 15%. In this situation, solar energy that can be converted into electricity accounts for just 15% of total incoming energy since PV modules have flaws, one of which is that the efficiency of the PV module decreases by 0.04% for every 1°C increase in temperature on the PV module’s surface [5].
In general, the work of the solar panel is affected by the increase in its working temperatures, where at high temperatures, the performance of PV decreases [6]. It is because most of the solar energy is transferred to waste heat in PV panels. Waste heat on the surface of this PV panel can cause the panel temperature to increase, and this high temperature can reduce the efficiency of the panel [7]. It means that a PV cooling system is needed to minimize the increase in PV working temperature to maximize its work. In this case, the passive cooling method is one method that can be used to reduce the working temperature and increase the efficiency of the PV panels [7-9]. The passive cooling method utilizes natural convection, so it does not require additional energy to operate. Therefore, passive cooling tends to be a little slower and less effective in the cooling process. However, with the innovation and variety of devices for passive cooling of solar panels, the performance and efficiency of PV panels can increase [10].
One of the simplest passive cooling methods is to apply Phase Change Material (PCM). PCM can absorb latent heat, and then it can be discharged into the environment where it can be used to a cooling system in PV to reduce its temperature [11]. PCM can generally be classified into two major groups, namely organic and inorganic [12]. One type of organic PCM is solid paraffin (wax). High latent heat storage capacity with a small temperature range can be obtained, and this type of PCM is environmentally friendly, harmless, and non-toxic. Solid paraffin is relatively inexpensive and has the properties of an average thermal energy storage density but low thermal conductivity. Therefore, it requires a large surface area [13].
Several studies have proven that PCM can minimize the increase in PV temperature so that PCM can be used as a passive PV cooling system. The result of the study by Singh et al. where the results obtained are that calcium chloride hexahydrate (CaCl2.6H2O) reduced the average maximum temperature of the solar panel at 12:40 local time from 64.4℃ to 46.4℃ (28%) under the same conditions and time [14, 15]. Another study by Roslan & Razak is that PCM can reduce the average temperature of solar panels by 9.5℃ by applying paraffin behind the solar panel as a passive cooling device [16]. A study conducted by Stropnik & Stritih shows that PV used RT28HC as a cooling system can reduce the temperature of PV without a cooling system by 35.6℃ [17]. Various explanations and previous research show that PCM has reliability as a passive cooling medium in PV panels.
Soybean wax can be categorized as PCM because it has the properties shown in Table 2 as possessed by each PCM, so soybean wax is capable of 3 steps of energy storage work: charging, storing, and discharging [18]. The thermal conductivity of soybean wax is relatively high compared to other PCM, so the heat transfer rate is high enough [19]. The price of soybean candles is IDR 70,000/Kg which is relatively cheap because the raw materials for making soybean wax can be found easily. The use of soybean wax is only once and can be used many times without reducing its thermal properties, so soybean wax is environmentally friendly and economically feasible. Therefore, this study aimed to prove that PCM can reduce the PV temperature. The variation used in this experiment were PV panels without cooling system and PV panels with soybean wax as a passive cooling system.
2.1 Numerical setup
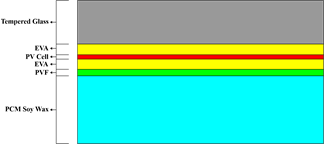
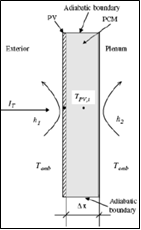
The layer arrangement on the cooling system PV panels is shown in Figure 1. An aluminum container containing PCM is mounted to the back of the PV panel. There is no air gap between the PCM and the back of the PV panel for maximum heat absorption. A single composite layer is assumed in the modeling program for the solar panel [8, 20, 21]. The parameters of each layer of the solar module are listed in Table 1.
Figure 1. PV panel cooling system layering
Table 1. The properties of each layer in the PV panel [8]
|
Properties |
Tempered Glass |
EVA |
PV Cell |
EVA |
PVF |
|
Density (kg/m3) |
2450 |
960 |
2330 |
960 |
1200 |
|
Specific heat capacity (kJ/kg K) |
0.79 |
2.09 |
0.667 |
2.09 |
1.25 |
|
Thermal conductivity (W/m K) |
0.7 |
0.311 |
130 |
0.311 |
0.15 |
|
Thickness (mm) |
3.2 |
0.5 |
0.21 |
0.5 |
0.3 |
The simulation was carried out using Ansys 18.2 steady-state thermal software. The radiation intensity is applied to the surface of the PV panel with a heat flux of 1100 W/m2. However, another treatment assumes there is only a convection loss of 8 W/m2. ℃, where the meshing is done by default. The fluid-solid interface is given to get the temperature after the simulation. In general, the electrical efficiency of polycrystalline silicon lies in the range of 11% to 20% as long as the tempered glass reflects 3% to 10% of solar radiation into the environment [8, 22].
2.2 Experimental setup
The experiment took place at Mechanical Engineering Laboratory, University of Sebelas Maret, Surakarta, Indonesia. Twenty halogen lamps of 500 Watts respectively with a distance between lamps of 37.5 cm were needed to simulate the sun with variations in light intensity of 400 W/m2, 600 W/m2, 900 W/m2, 1000/m2, and 1100 W/m2, as shown in Figure 3. The first 15 minutes to stabilize the intensity of the solar simulator in the PV state covered with aluminum foil, then the aluminum foil was opened and exposed to the light of the solar simulator for 40 minutes. The total height of the solar simulator is 2.5 m with the halogen lamp perpendicular to the PV [23, 24]. The distance between the halogen lamp and PV is 75 cm, with a non-uniformity below 5% [25]. Nine blowers’ fans arranged in a 3×3 configuration was used to simulate the mean wind speed in Surakarta of 2.5 m/s. The distance between each blower is set at equal intervals of 0.55 m, covering a cross-section of 1.1 m×1.1 m [26]. PCM is used as a passive cooling system of photovoltaic solar panels. PCM will absorb latent heat by changing its phase and dissipating the heat to the environment. The type of PCM used in this study is soybean wax, and its specifications from several references are shown in Table 2.
Table 2. The properties of soybean wax
|
Properties |
Soybean Wax |
|
Heat Latent (kJ/kg) |
100.90 [27, 28] |
|
Thermal Conductivity (W/m K) |
0.25 [28] |
|
Density (Kg/m3) |
900 [29] |
|
Specific Heat Capacity (kJ/kg K) |
0.496 [28] |
|
Thickness (mm) |
40 [30] |
Table 3. Specification of Yingli JS 50 Wp polycrystalline solar panel
|
Variation |
Soybean Wax |
|
Cell (material/dimension) |
Polycrystalline silicon/156 × 52 mm |
|
Open-circuit voltage (VOC) |
22,9 V |
|
Short-circuit current (ISC) |
2,87 A |
|
Maximum power (PMPP) |
50 Wp |
|
Efficiency |
14% |
|
Operating module temperature |
̵ 40°C ̶ 85℃ |
|
Dimension |
660 × 540 × 25 mm |
|
Temperature coefficient of power |
̵ 0,45% per ℃ |
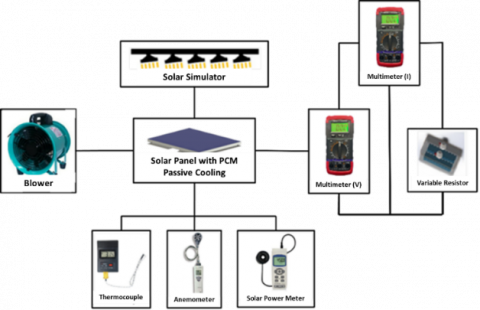
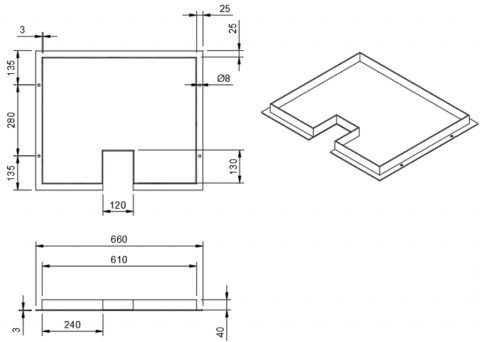
The data collection process requires several instruments in this study. Figure 2 shows the experimental scheme for this study. The Yingli JS 50 Wp polycrystalline solar panel is the main component in this study. It is used to excite electrons and convert them into electrical energy, with specifications shown in Table 3. The aluminum container is the place of PCM and as the place for the solar panel bracket as a Figure 4. The container is designed to have no air gap between the PCM and the back of the solar panel by equating the maximum thickness of the PCM used with the height of the container so that heat absorption can be maximized. Variable resistor produces variations of current (I) and voltage (V) by varying the resistance (Ω) and will get the I-V curve. The multimeter is used to measure the current (I) and voltage (V) which will produce the values of the I-V curve where the resistance (Ω) has been varied with a variable resistor. The solar power meter is used to measure the amount of light intensity on the surface of solar panels emitted by the solar simulator. K-type thermocouples mounted on the top and bottom of the PV surface to read the solar panel’s temperature. Anemometer is needed to measure the wind speed given by the blower.
Figure 2. Schematic configuration of the PV with PCM soybean wax
Figure 3. Experimental setup
Figure 4. Dimensions and geometry PCM container
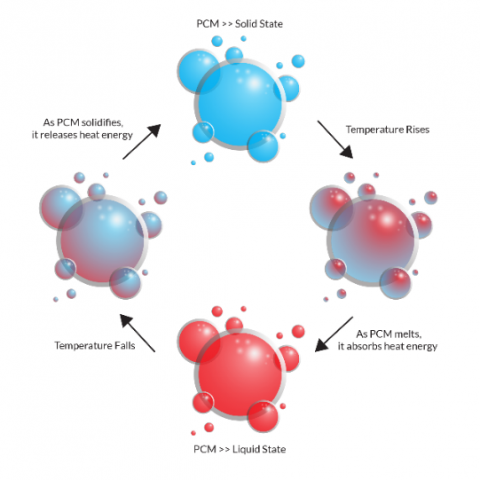
PCM refers to substances that absorb and release thermal energy when they melt and solidify, as the chemical reaction shown in Figure 5. A PCM absorbs a lot of heat (energy) from the surroundings as it melts. When a PCM solidifies, however, it releases a lot of energy in the form of latent heat. PCM goes through this process indefinitely, making them excellent for a wide range of common applications that require temperature control. PCM decreases temperature fluctuations and can maintain a constant temperature for long periods.
(a) The physical mechanism
(b) The chemical mechanism
Figure 5. Phase change mechanism of PCM [31]
Measurement of heat transmission between the solar cell module and the environment can be used to measure the surface temperature of the photovoltaic module. Conduction, convection, and radiation are the three methods of heat transfer in solar cell modules.
The convection heat transfer that occurs in PV is formulated by:
$q_{\text {conv }}=h_{c} \cdot A \cdot\left(T_{\text {module }}-T_{\text {surroundinq} } \,\,\, \right)$ (1)
where, Tmodule displays the temperature on the PV module’s surface, while Tsurrounding displays the temperature in the surrounding area. The PV module’s physical conditions influence the convective heat transfer coefficient, h. For the PV module, the value for h can be written as follow, where v is ambient air velocity:
$h=6,91 v+3,9$ (2)
The general form of the radiation heat transfer equation is as follows:
$q_{\text {rad }}=\varepsilon \sigma A\left(T_{s}^{4}-T_{\text {module }}^{4}\right)$ (3)
where, qrad represents solar irradiation on the PV module’s surface, ε represents the material’s emissivity, s represents the Boltzmann constant (5.6710-8 W/m2.K4), A represents the active module area, and Ts represents the temperature of the radiation source. The heat flux of conduction can be calculated as follows:
$q_{\text {cond }}=-k A \frac{\Delta T}{\Delta x}$ (4)
The material has a thermal conductivity of k, a distance between sides with different temperatures of ∆x, and a temperature difference of ∆T between the two sides calculated in Eq. (4).
Photons are emitted and reach the surface of an object can be absorbed, reflected, and transmitted through the object’s surface. Absorptivity (α) (the entering radiation and then absorbed), reflectivity (ρ) (the receiving radiation and then reflected), and transmissivity (τ) (the arriving radiation and then advanced) are three surface qualities that can take photons.
$\alpha+\rho+\tau=1$ (5)
Solar radiation energy (IT) is absorbed by PV at a given point in time, and the majority of the received energy is transformed to heat. Heat will also be transported to the PCM, which is found at the bottom of the PV. If the PV temperature is assumed to be the same as the PCM temperature, the front and back heat transfer coefficients are h1 and h2, and the ambient temperature is Tamb, the PV active surface area is A, and the ambient temperature is Tamb. At a particular point, the PCM temperature changes from the initial state (Tpv) to (Tpv,t+∆t), with no heat loss from the adiabatic system’s limit. Equation 6 is utilized to construct an energy balance when the calculation temperature is lower than the PCM melting point (Tm).
$A l_{T} \Delta t=A\left(h_{1}+h_{2}\right)\left(T_{p v, t}-T_{a m b}\right) \Delta t+\left(T_{p v, t+\Delta t}-T_{p v, t}\right) \rho C_{p} \Delta x A$ (6)
When the temperature Tpv,t+∆t is larger than the melting point of the PCM, the energy spent by the PCM to change the phase and temperature remains constant until the material transforms completely. The PCM’s latent heat is set to H, its volume is set to ∆xA, and the total time for the material to change phase is set to ∆t. Equation 7 is the energy balance equation for the phase transition.
$A l_{T} \Sigma \Delta t=A\left(h_{1}+h_{2}\right)\left(T_{m}-T_{a m b}\right) \Sigma \Delta t+H \Delta x A$ (7)
The heat transfer process occurs when a solar panel is paired with a PCM. It can be illustrated as in Figure 6.
Figure 6. Dimensions and geometry PCM container
The data obtained from this experiment compares the temperature of the PV using a PCM passive cooling system and the temperature of the PV without using any cooling system with the light intensity of the solar simulator, blower wind speed, and data collection time under the same conditions. Data collection is supported by Computational Fluid Dynamics (CFD) analysis to prove that PCM soybean wax affects PV’s working temperature and efficiency.
3.1 CFD analysis
The simulation was performed in a steady-state environment. The meshing simulation yields node and element values of 120834 and 19126, respectively. The average value of the standard mesh with matrix skewness is 3.6795 10-3, indicating that the mesh quality is very good and that the chance of error is negligible.
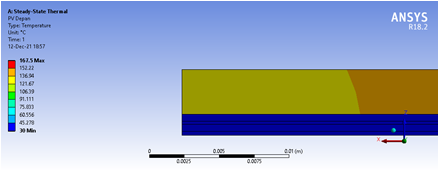
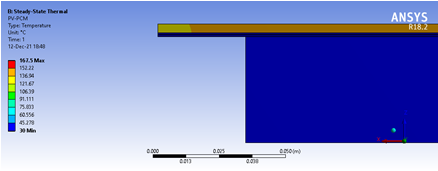
The temperature contour of the PV panel at steady-state with a heat flow of 1100 W/m2 with and without PCM soybean wax is depicted in Figure 7. PV panels without PCM soybean wax averaged 56.8℃, while PV panels with PCM soybean wax averaged 48.6℃. After adding PCM soybean wax, the temperature dropped to 8.2℃, and heat transfer from the panel to the air improved considerably.
(a) Without PCM soybean wax
(b) With PCM soybean wax
Figure 7. The thermal contour of PV panels
3.2 Experimental result
The purpose of the experiment was to determine the effect of soy wax on the performance of photovoltaic solar panels in the room using a solar simulator system and then the results will be compared with the simulation results to find out how big the error is in the experiment.
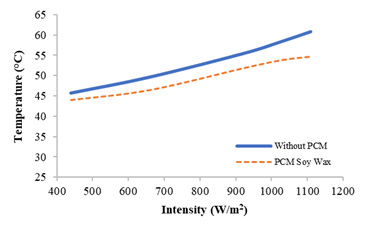
The high working temperature of photovoltaic directly impacts PV performances [32]. The function of PCM is to minimize the very high rise in PV temperature, thereby improving PV performance. Previous studies have shown that the application of PCM in PV as a passive cooling system has better performance than PV without a cooling system [16, 14, 30]. Figure 8 shows the effect of intensity on PV temperature. PV panels without a cooling system and PV panels with soybean wax were employed in this experiment.
Figure 8. The relation between the intensity of the solar simulator and PV temperature
Based on Figure 8, the working temperature of the photovoltaic shows an increase as the intensity value increases. Prove that the light intensity is proportional to the temperature PV. The maximum temperature is obtained at a light intensity of 1100 W/m2 in PV without a cooling system. The maximum temperature of PV at 1100 W/m2 without a cooling system and PV with soybean wax is 60.7℃ and 54.7℃, respectively. The thermal properties of soybean wax will cause the temperature of PV to decrease.
Latent heat enables PCM to absorb and store thermal energy without changing its temperature [33-35]. The higher latent heat, the higher ability to absorb and store thermal energy. Thermal conductivity determines the heat transfer rate in the process of heat absorption or release [34, 35]. Therefore, the smaller the thermal conductivity, the longer the freeze-thaw process of the material will take. Soybean wax has latent heat and thermal conductivity, so it is the best in the heat absorption process of PV and has been proven to reduce the maximum PV temperature by 6.0℃.
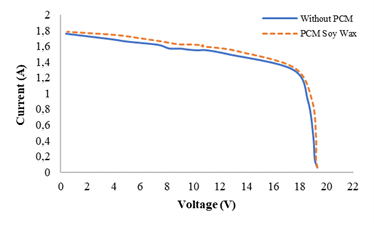
Figure 9. The relation between voltage and current of PV
Voltage and current graphs are obtained from experiments that have been carried out with PV at an intensity of 1100 W/m², as shown in Figure 9 above. The area under the current and voltage curve at an intensity of 1100 W/m2 shows that the output power increases. PV without a cooling system with an intensity of 1100 W/m2 produces a VOC of 19.30 V, an ISC of 1.76 A. PV using PCM soybean wax passive cooling with an intensity of 1100 W/m2 produces a VOC of 19.30 V and an ISC of 1.78 A.
Table 4. PV characteristics without cooling system and using PCM soybean wax passive cooling
|
No. |
Cooling system |
Intensity (W/m2) |
Temperature (℃) |
Efficiency (%) |
|
1. |
Without PCM |
400 600 900 1000 1100 |
45.6 49.5 55.4 58.2 60.7 |
4.58 4.93 6.18 5.76 5.85 |
|
2. |
PCM Soybean Wax |
400 600 900 1000 1100 |
43.9 46.4 51.9 53.8 57.7 |
4.86 5.29 6.60 6.09 5.98 |
The efficiency is obtained by calculating equation 2. Based on Table 4, PV without a cooling system and PV applying soybean wax have a maximum efficiency of 6.18% and 6.60%, respectively, at an intensity of 900 W/m2. The best variation in increasing PV efficiency is soybean wax by 0.42%. The PV efficiency will increase to the optimal point, and then the efficiency will drop because at a certain intensity, the photon light will be excessive, resulting in the PV material (silicon) not accommodating it so that the photon becomes residual heat. Based on the results of simulations and experiments, the error values obtained from the average temperature of PV panels with and without PCM soybean wax are 6.9% and 12.61%, respectively.
This simulation and experiment use one variation of PCM soybean wax and PV without a cooling system as a comparison variation to determine which PCM can reduce PV temperature. This study concludes that the variation of PV applied by soybean wax is the lowest in reducing the PV temperature than PV without a cooling system. The results show that PV used by soybean wax as passive cooling can reduce the maximum PV temperature by 6.0℃ and increase its maximum efficiency by 0.42%. According to simulation and experimental results, the error values of the average temperature of photovoltaic panels with and without PCM soybean wax are 6.9% and 12.61%, respectively.
This work was partially supported by a grant from PDUPT 2021 (research grant number 221.1/UN27.22/HK.07.00/2021) from the Ministry of Research, Technology, and Higher Education, Republic of Indonesia.
[1] Center, U.N. (2013). World population projected to reach 9.6 billion by 2050–UN report.
[2] Indartono, Y.S., Prakoso, S.D., Suwono, A., Zaini, I.N., Fernaldi, B. (2015). Simulation and experimental study on effect of phase change material thickness to reduce temperature of photovoltaic panel. In IOP Conference Series: Materials Science and Engineering, 88(1): 012049. https://doi.org/10.1088/1757-899X/88/1/012049
[3] Bilgili, M., Ozbek, A., Sahin, B., Kahraman, A. (2015). An overview of renewable electric power capacity and progress in new technologies in the world. Renewable and Sustainable Energy Reviews, 49: 323-334. https://doi.org/10.1016/j.rser.2015.04.148
[4] Ginley, D., Green, M.A., Collins, R. (2008). Solar energy conversion toward 1 terawatt. MRS Bulletin, 33(4): 355-364. https://doi.org/10.1557/mrs2008.71
[5] Rif’an, M., Pramono, S.H., Shidiq, M., Yuwono, R., Suyono, H., Suhartati, F. (2012). Optimasi pemanfaatan energi listrik tenaga matahari di Jurusan Teknik Elektro Universitas Brawijaya. Jurnal EECCIS, 6(1): 44-48.
[6] Apribowo, C.H.B., Habibie, A., Arifin, Z., Adriyanto, F. (2020). Experimental method for improving efficiency on photovoltaic cell with using floating installation method. In AIP Conference Proceedings, 2217(1): 030190. https://doi.org/10.1063/5.0000827
[7] Setyohandoko, G., Sutanto, B., Rachmanto, R.A., Tjahjana, D.D.D.P., Arifin, Z. (2020). A numerical approach to study the performance of photovoltaic panels by using aluminium heat sink. Journal of Advanced Research in Fluid Mechanics and Thermal Sciences, 70(2): 97-105. https://doi.org/10.37934/ARFMTS.70.2.97105
[8] Arifin, Z., Tjahjana, D.D.D.P., Hadi, S., Rachmanto, R.A., Setyohandoko, G., Sutanto, B. (2020). Numerical and experimental investigation of air cooling for photovoltaic panels using aluminum heat sinks. International Journal of Photoenergy, Article ID: 1574274. https://doi.org/10.1155/2020/1574274
[9] Guardian, I., Sutanto, B., Rachmanto, R.A., Hadi, S., Arifin, Z. (2020). Improving the performance of photovoltaic panels by using aluminum heat sink. In Proceedings of the 6th International Conference and Exhibition on Sustainable Energy and Advanced Materials, pp. 437-448. https://doi.org/10.1007/978-981-15-4481-1_42
[10] Hasanuzzaman, M., Malek, A.B.M.A., Islam, M.M., Pandey, A.K., Rahim, N.A. (2016). Global advancement of cooling technologies for PV systems: A review. Solar Energy, 137: 25-45. https://doi.org/10.1016/j.solener.2016.07.010
[11] Murthy, B.R., Gumtapure, V. (2020). Thermo-physical analysis of natural shellac wax as novel bio-phase change material for thermal energy storage applications. Journal of Energy Storage, 29: 101390. https://doi.org/10.1016/j.est.2020.101390
[12] Pudjiastuti, W. (2011). Jenis-Jenis Bahan Berubah Fasa dan Aplikasinya. Jurnal Kimia dan Kemasan, 33(1): 118-123. https://doi.org/10.24817/jkk.v33i1.1838
[13] Akgün, M., Aydın, O., Kaygusuz, K. (2007). Experimental study on melting/solidification characteristics of a paraffin as PCM. Energy Conversion and Management, 48(2): 669-678. https://doi.org/10.1016/j.enconman.2006.05.014
[14] Singh, P., Mudgal, V., Khanna, S., Mallick, T.K., Reddy, K.S. (2020). Experimental investigation of solar photovoltaic panel integrated with phase change material and multiple conductivity-enhancing-containers. Energy, 205: 118047. https://doi.org/10.1016/j.energy.2020.118047
[15] Radziemska, E. (2003). Thermal performance of Si and GaAs based solar cells and modules: A review. Progress in Energy and Combustion Science, 29(5): 407-424. https://doi.org/10.1016/S0360-1285(03)00032-7
[16] Roslan, M.E.B.M., Razak, A. (2019). Performance effect of applying paraffin wax on solar photovoltaic backplate. Indonesian Journal of Electrical Engineering and Computer Science, 14(1): 375-380. https://doi.org/10.11591/ijeecs.v14.i1.pp375-380
[17] Stritih, U. (2016). Increasing the efficiency of PV panel with the use of PCM. Renewable Energy, 97: 671-679. https://doi.org/10.1016/j.renene.2016.06.011
[18] Haller, M.Y., Cruickshank, C.A., Streicher, W., Harrison, S.J., Andersen, E., Furbo, S. (2009). Methods to determine stratification efficiency of thermal energy storage processes–review and theoretical comparison. Solar Energy, 83(10): 1847-1860. https://doi.org/10.1016/j.solener.2009.06.019
[19] Khodadadi, J.M., Fan, L., Babaei, H. (2013). Thermal conductivity enhancement of nanostructure-based colloidal suspensions utilized as phase change materials for thermal energy storage: A review. Renewable and Sustainable Energy Reviews, 24: 418-444. https://doi.org/10.1016/j.rser.2013.03.031
[20] Armstrong, S., Hurley, W.G. (2010). A thermal model for photovoltaic panels under varying atmospheric conditions. Applied Thermal Engineering, 30(11-12): 1488-1495. https://doi.org/10.1016/j.applthermaleng.2010.03.012
[21] Liu, L., Wang, Q., Lin, H., Li, H., Sun, Q. (2017). Power generation efficiency and prospects of floating photovoltaic systems. Energy Procedia, 105: 1136-1142. https://doi.org/10.1016/j.egypro.2017.03.483
[22] Arifin, Z., Prasetyo, S.D., Prabowo, A.R., Tjahjana, D. D.D.P., Rachmanto, R.A. (2021). Effect of thermal collector configuration on the photovoltaic heat transfer performance with 3D CFD modeling. Open Engineering, 11(1): 1076-1085. https://doi.org/10.1515/eng-2021-0107
[23] Hussain, F., Othman, M.Y.H., Yatim, B., Ruslan, H., Sopian, K., Anuar, Z., Khairuddin, S. (2011). Fabrication and irradiance mapping of a low cost solar simulator for indoor testing of solar collector. Journal of Solar Energy Engineering, 133(4): 1–4. https://doi.org/10.1115/1.4004548
[24] Arifin, Z., Kuncoro, I.W., Hijriawan, M. (2021). Solar simulator development for 50 WP solar photovoltaic experimental design using halogen lamp. International Journal of Heat and Technology, 39(6): 1741–1747. https://doi.org/10.18280/ijht.390606
[25] Irwan, Y.M., Leow, W.Z., Irwanto, M., Amelia, A.R., Gomesh, N., Safwati, I. (2015). Indoor test performance of PV panel through water cooling method. Energy Procedia, 79: 604-611. https://doi.org/10.1016/j.egypro.2015.11.540
[26] Wong, K.H., Chong, W.T., Sukiman, N.L., Shiah, Y.C., Poh, S.C., Sopian, K., Wang, W.C. (2018). Experimental and simulation investigation into the effects of a flat plate deflector on vertical axis wind turbine. Energy Conversion and Management, 160: 109-125. https://doi.org/10.1016/j.enconman.2018.01.029
[27] Yoo, J., Chang, S.J., Wi, S., Kim, S. (2019). Spent coffee grounds as supporting materials to produce bio-composite PCM with natural waxes. Chemosphere, 235: 626-635. https://doi.org/10.1016/j.chemosphere.2019.06.195
[28] Jeon, J., Park, J.H., Wi, S., Yang, S., Ok, Y.S., Kim, S. (2019). Latent heat storage biocomposites of phase change material-biochar as feasible eco-friendly building materials. Environmental Research, 172: 637-648. https://doi.org/10.1016/j.envres.2019.01.058
[29] Cui, Y., Liu, C., Hu, S., Yu, X. (2011). The experimental exploration of carbon nanofiber and carbon nanotube additives on thermal behavior of phase change materials. Solar Energy Materials and Solar Cells, 95(4): 1208-1212. https://doi.org/10.1016/j.solmat.2011.01.021
[30] Zhao, J., Li, Z., Ma, T. (2019). Performance analysis of a photovoltaic panel integrated with phase change material. Energy Procedia, 158: 1093-1098. https://doi.org/10.1016/j.egypro.2019.01.264
[31] Zhang, W., Mazzarello, R., Ma, E. (2019). Phase-change materials in electronics and photonics. MRS Bulletin, 44(9): 686-690. https://doi.org/10.1557/mrs.2019.201
[32] Sato, D., Yamada, N. (2019). Review of photovoltaic module cooling methods and performance evaluation of the radiative cooling method. Renewable and Sustainable Energy Reviews, 104: 151-166. https://doi.org/10.1016/j.rser.2018.12.051
[33] Sarbu, I., Sebarchievici, C. (2018). A comprehensive review of thermal energy storage. Sustainability, 10(1): 191. https://doi.org/10.3390/su10010191
[34] Nayak, A.O., Gowtham, M., Vinod, R., Ramkumar, G. (2011). Analysis of PCM material in thermal energy storage system. International Journal of Environmental Science and Development, 2(6): 437-411. https://doi.org/10.7763/ijesd.2011.v2.165
[35] Yang, T., King, W.P., Miljkovic, N. (2021). Phase change material-based thermal energy storage. Cell Reports Physical Science, 2(8): 100540. https://doi.org/10.1016/j.xcrp.2021.100540