Kien Nguyen Trung* | Quy Nguyen Trong
© 2022 IIETA. This article is published by IIETA and is licensed under the CC BY 4.0 license (http://creativecommons.org/licenses/by/4.0/).
OPEN ACCESS
Internal combustion engines are currently so well-optimized that enhancing their performance is a prohibitively expensive endeavor. The success of the engine simulation approach is determined by the accuracy of the heat transfer model. The purpose of these models is to figure out how much heat is transferred from the combustion gases to the cylinder walls. To see which of these relationships may best explain the experimental data for internal combustion engines utilizing various fuel mixtures. The cylinder liner temperature distribution of a diesel engine running on M10, E10, and B10 fuels is presented in this research using the Hohenberg correlation. The results demonstrate that when alcohol is added to mineral diesel fuel, the maximum temperature of the cylinder liner rises by 5.4 percent, 3.7 percent, and 2.23 percent, respectively, allowing the engine to run safely with diesel-alcohol dual fuel.
heat transfer correlation, Hohenberg, cylinder liner distribution, M10, E10, B10
The efficient generation and utilization of renewable energy are critical needs for ensuring economic prosperity. As a result, alcohol is given as an energy source that can be used in internal combustion engines. The heat transfer that occurs inside the cylinder can be studied to determine a portion of this efficiency. Alcohols like ethanol and methanol can be used as a substitute for gasoline in a variety of engines [1]. Alcohols will be employed as alternative fuels in the future, either in pure form or as part of a blend with conventional fuels, to reduce demand for conventional fuels [2]. Alcohol fuels can also be used in conjunction with diesel fuel in a variety of dual-fuel operation scenarios. Blending and fumigation are the most common approaches. Alcohol fuels are combined with diesel fuel before being injected into the cylinder. Extra additives are necessary to stabilize the miscibility of combining alcohol with diesel fuel. As a result, the amount of alcohol that can be utilized in the blending operation is limited. The introduction of alcohol fuel into the intake air upstream of the manifold, either by spraying, carbureting, or injecting, is known as alcohol fumigation. This technique of introduction has the advantage of supplying a percentage of the total fuel supply premixed with the intake air, resulting in better air usage [3].
There are researches in the literature that employs methanol (CH3OH) as an alternative fuel additive for diesel engines, but not as much as ethanol. Methanol can be made cheaply from petroleum-based fuels or coal, but its miscibility in diesel fuel is limited. Ethanol, on the other hand, is preferable to methanol since it is renewable (bioethanol) and has higher miscibility with diesel fuel. Alcohol reduced CO, HC, and smoke emissions while increasing NOx, with methanol mixes having a higher brake specific fuel consumption (BSFC) than ethanol blends. With the addition of the alcohols, brake thermal efficiency (BTE) was reduced, and the lowest value of BTE was achieved with M10 [4, 5].
The four-carbon alcohol butanol (C4H9OH) has fuel qualities that are more like petroleum-based fuels. Because of its greater cetane number, higher miscibility, and lower vapor pressure, butanol has several advantages over other alcohols as an alternative fuel for diesel engines. Butanol also has a higher energy content and is less corrosive. As a result, butanol is thought to be a better substance for use as a diesel fuel additive, and it has recently gained popularity [6]. Lower exhaust emissions can be achieved without major changes in engine performance, according to experiments on diesel engines fueled by butanol - diesel mixes [7-9].
As previously indicated, numerous experiments on diesel engines have been undertaken to evaluate the exhaust emissions and engine performance of various alcohol-diesel blends. However, when compared to performance and emissions research in the literature, investigations on heat transfer and thermal distribution of components in a diesel engine working with diesel-alcohol blends are restricted. For that reason, in this case, this paper presents the cylinder liner temperature distribution valuation of a diesel engine operating with M10, E10, and B10 fuels used correlation of Hohenberg. The simulations were run at 2000 rpm with the engine at full power, using various alcohol mixes made by blending 10% butanol, ethanol, and methanol with diesel fuel. After that, the alcohol blends were compared to one another as well as petroleum-based diesel fuel. Calculating the temperature and heat transfer coefficient of the gases in the cylinder is required to determine the amount of heat transferred to the cylinder wall, which necessitates calculating the engine running cycle by GT-Power software. When alcohol is added to mineral diesel fuel, the maximum temperature of the cylinder liner rises when compared to pure diesel, according to the findings. The temperature distribution of the cylinder liner was calculated using the finite element method developed in ANSYS parametric design language (APDL). In this model, the thermal circuit approach is used to describe the process of heat transfer (heat conduction) from the rings and piston skirt area to the cylinder wall. The findings show that when alcohol is added to mineral diesel fuel, the cylinder liner’s maximum temperature rises by 5.4 percent, 3.7 percent, and 2.23 percent, respectively. All of the paper’s steps are completed in the order listed below: To begin, the engine simulation model that has been tested is utilized to simulate the engine with the researched fuels. Then, using the cylinder heat distribution calculation model in the paper’s appendix, we evaluate the influence of various fuels on the thermal state of the cylinder liner.
The significance of heat transmission to combustion chamber walls of internal combustion engines has been acknowledged, and the findings of many theoretical and experimental research efforts on this issue have been published. However, it is acknowledged that the topic is complex, and many parts of it have yet to be thoroughly investigated. Thermal losses, which account for 50-60% of all losses, are one of three important aspects for optimizing the performance of internal combustion engines in terms of better energy efficiency, according to Richardson [10]. The cylinder wall temperature should preferably be kept near to that of the in-cylinder gases to reduce thermal losses. The temperature of the cylinder liner is important in thermodynamic control-oriented modeling of cycle-to-cycle exhaust gas temperature. To improve such models, Dehghani Firoozabadi et al. [11] stress the necessity of identifying the cylinder wall temperature. In addition, Wang and Stone [12] found that cylinder wall temperature had a considerable impact on HC and NOx emissions from engines. It has been demonstrated that higher liner temperatures reduce HC emissions, although the opposite is frequently true for NOx emissions. As a result, based on desired trade-off between HC and NOx emissions, an optimum liner temperature should be determined.
Table 1. Parameters of test fuels [4]
|
Properties |
Diesel (D100) |
B10 |
E10 |
M10 |
|
Density, [kg/m3] |
931.5 |
829.3 |
827 |
827.4 |
|
Flash point, [℃] |
70 |
23 |
21 |
20 |
|
Kinematics viscosity, [mm2/s] |
2.4 |
2.6 |
2.2 |
2.1 |
|
Lower heating value, [MJ/kg] |
43.2 |
41.7 |
41.2 |
40.4 |
|
Cetan Number |
58.8 |
55.6 |
53.4 |
52.1 |
|
Carbon (wt%) |
86.6 |
84.4 |
83.2 |
81.7 |
|
Oxygen (wt%) |
0 |
2.2 |
3.5 |
5 |
|
Hydrogen (wt%) |
13.4 |
13.4 |
13.3 |
13.3 |
In order to understand the influence of different alcohol additions on engine performance and cylinder temperature distribution, this study used ethanol, methanol, and butanol blends as well as petroleum-based diesel fuel. To collect reference data, D100 diesel fuel was employed. Then, in a 10 wt% proportion, butanol, ethanol, and methanol were combined with diesel fuel and dubled B10, E10, and M10, respectively. Table 1 shows the basic properties of these fuels, in spite of the high oxygen content of the alcohols, the alcohol proportion in the test blends was chosen 10 wt%, which is the optimum mixture ratio, in order to minimize the poor combustion characteristics due to low cetane number and heating value of the alcohols. Table 2 gives the main characteristics of the studied engine. The V-12 engine is a high-speed diesel engine with a cooling system by cooling water. The engine consists of 12 cylinders, arranged in a V-shape, with a 60° angle between their axis.
Table 2. The technical specifications of the studied engine [13]
|
Parameters |
Symbol |
Value |
Unit |
|
Number of cylinders |
i |
12 |
- |
|
Engine type |
V-12 |
Diesel, the V arrangement, the twelve cylinders are arranged in two banks of six, with a 60° angle between their axis. |
|
|
The firing order of the cylinders |
1L-6R-5L-2R-3L-4R-6L-1R-2L-5R-4L-3R |
||
|
Compression ratio |
$\varepsilon$ |
15±0.5 |
|
|
Maximum power |
- |
387.4/2000 |
kW/rpm |
|
Maximum torque |
- |
2256.3/1200 |
Nm/rpm |
|
Intake valve open |
IVO |
340 |
oCA ATDC |
|
Intake valve close |
IVC |
-132 |
oCA BTDC |
|
Exhaust valve open |
EVO |
132 |
oCA ATDC |
|
Exhaust valve close |
EVC |
380 |
oCA ATDC |
|
Specific fuel consumption |
Ge.min |
265±5 |
[g/kW.h] |
The results showed that the Hohenberg correlation is most suited for the tupe of engine investigated in this study, according to Trung [14]. The engine simulation model generated with GT-Power software was verified for dependability, as shown in Figure 1 [15]. The author then studies the temperature and convective heat transfer coefficient using the test fuels using this model.
Figure 1. V-12 engine simulation model
The Numerical method is the approach of solving mathematical of physical equations using computers. This is done by converting differential equations defined in continuous space and time to a large system of equations in discretized domain. Numerical methods give approximate solutions and they are much easier when compared to analytical methods. So that in our work, the temperature field of the wet cylinder liner is analyzed using a numerical analysis method. The cylinder liner is subjected to 3-D finite element thermal studies with various test fuels. The author used the heat transfer model of the cylinder (as shown in Figure 2) to compute the cylinder temperature distribution of the V-12 engine, and the calculation program using ANSYS code is detailed in appendix [14, 16].
Figure 2. Heat exchange surfaces of the wet cylinder liner of the studied engine
The combustion chamber, the region between the piston and the liner, the rings, the skirt, and the cooling water are all thermal boundaries of the cylinder liner. Thermal boundary conditions in this investigation are determined by author's prior experience and similar works from the literature. The heat transfer inside the internal combustion engine is complex. The thermal boundary conditions must be determined before analyzing the temperature distribution of the cylinder liner. The third type of heat transfer boundary conditions is used in this study to calculate the cylinder liner's steady-state temperature field, which includes the heat transfer coefficient and the medium temperature. Currently, empirical and semi-empirical formulas are used to calculate boundary conditions.
When a simulation model produced by GT-Power software is run with the test fuels, the temperature and the heat transfer coefficient of the in-cylinder gases are determined according to the crank angle, as illustrated in Figure 3 and Figure 4. It can be seen that when using fuel B10, E10, and M10, the temperature and heat transfer coefficient have a larger change than when using mineral diesel, but this change value is relatively small. Especially for the heat transfer coefficient, there is almost no change in the whole working cycle, but only a clear change in the area of the maximum value. We can calculate the values of heat transfer coefficient (ai - [W/m2.K]) and the temperature corresponding to each section of the cylinder liner (Ti - [K]) owing to exposure to the in-cylinder gases based on the calculation results and the graph integration approach. Thermal boundary conditions of the cylinder liner of the engine operating the different test fuels are shown in Table 3.
With the defined boundary conditions, through the program for calculating the temperature distribution of the cylinder liner, written in APDL format. Through running the program written by the ANSYS Parametric Design Language (APDL) in the appendix with the different test fuels [13], we get the results of the temperature distribution of the cylinder liner according to the different test fuels as shown in figures from Figure 5 to Figure 8.
Table 3. Thermal boundary conditions
|
Surfaces |
B10 |
|
|
T, [K] |
a, [W/m2.K] |
|
|
1 |
980.43 |
360.60*10E-6 |
|
2 |
790.43 |
348.26*10E-6 |
|
3 |
753.46 |
325.59*10E-6 |
|
4 |
640.82 |
230.44*10E-6 |
|
5 |
588.76 |
198.56*10E-6 |
|
6 |
587.43 |
186.92*10E-6 |
|
7 |
355.15 |
500*10E-6 |
|
8 |
341.15 |
500*10E-6 |
|
9 |
328.15 |
200*10E-6 |
|
10 |
358.15 |
5000*10E-6 |
|
11 |
363.15 |
6000*10E-6 |
|
12 |
364.15 |
5000*10E-6 |
|
Surfaces |
E10 |
|
|
T, [K] |
a, [W/m2.K] |
|
|
1 |
1009.43 |
370.60*10E-6 |
|
2 |
801.43 |
352.26*10E-6 |
|
3 |
758.46 |
330.59*10E-6 |
|
4 |
645.82 |
232.44*10E-6 |
|
5 |
593.76 |
198.56*10E-6 |
|
6 |
595.43 |
186.92*10E-6 |
|
7 |
355.15 |
500*10E-6 |
|
8 |
341.15 |
500*10E-6 |
|
9 |
328.15 |
200*10E-6 |
|
10 |
358.15 |
5000*10E-6 |
|
11 |
363.15 |
6000*10E-6 |
|
12 |
364.15 |
5000*10E-6 |
|
Surfaces |
M10 |
|
|
T, [K] |
a, [W/m2.K] |
|
|
1 |
960.43 |
350.60*10E-6 |
|
2 |
775.43 |
340.26*10E-6 |
|
3 |
745.46 |
320.59*10E-6 |
|
4 |
630.82 |
220.44*10E-6 |
|
5 |
580.76 |
190.56*10E-6 |
|
6 |
580.43 |
180.92*10E-6 |
|
7 |
355.15 |
500*10E-6 |
|
8 |
341.15 |
500*10E-6 |
|
9 |
328.15 |
200*10E-6 |
|
10 |
358.15 |
5000*10E-6 |
|
11 |
363.15 |
6000*10E-6 |
|
12 |
364.15 |
5000*10E-6 |
Figure 3. The combustion gas temperature in the cylinder with the different test fuels
Figure 4. The heat transfer coefficient of the in-cylinder gases with the different test fuels
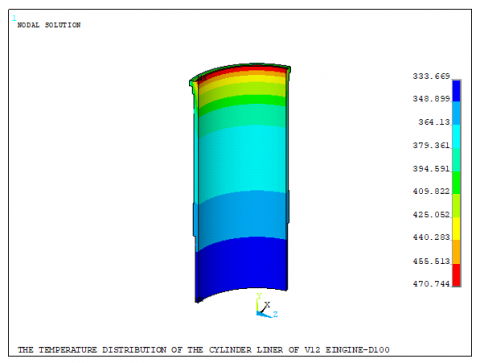
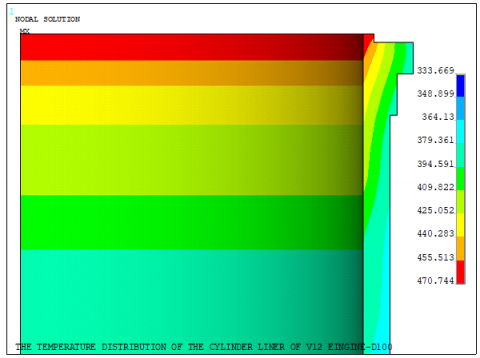
Figure 5. The temperature distribution of the cylinder liner of a V12 engine operating with D100 fuel
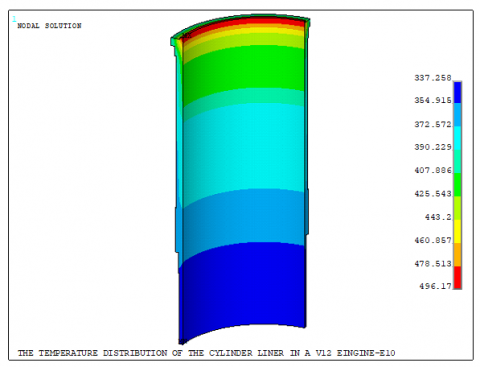
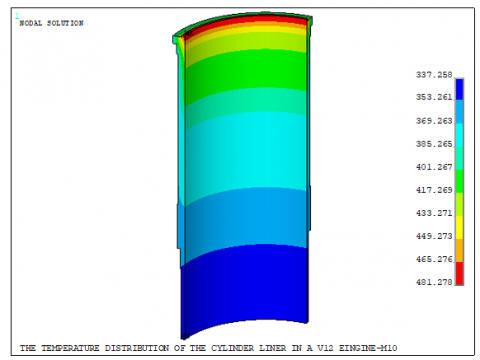
We can see how the temperature varies along the length of a V12 diesel engine liner by comparing the temperature distribution of the cylinder liner of a diesel engine operating with the different test fuels, as shown by the calculation results of the cylinder liner temperature field when using D100, E10, B10, and M10 fuels. According to these findings, the cylinder liner’s top inside edge has the maximum temperature. From the mirror surface to the back of the liner, the temperature distribution drops progressively, and the temperature reduces dramatically with distance from the cylinder head. Because this area is a surface that forms the volume of the combustion chamber, it is exposed to high temperature in-cylinder burned gases, the results are consistent with those found in the literature. After significant gas expansion, the lower sections of the liner are only exposed to combustion products for a portion of the cycle.
Figure 6. The temperature distribution of the cylinder liner of a V12 engine operating with E10 fuel
Figure 7. The temperature distribution of the cylinder liner of a V12 engine operating with M10 fuel
Figure 8. The temperature distribution of the cylinder liner of a V12 engine operating with B10 fuel
The results have shown that when adding alcohol to mineral diesel fuel, the maximum temperature of the cylinder liner increases, respectively: E10: 5.4%; B10: 3.7%; and M10: 2.23%, which allows the engine to continue operating safely with diesel-alcohol dual fuel.
In order to provide an optimized tool for future studies, the program for calculating the temperature distribution of the cylinder liner, written by the ANSYS Parametric Design Language (APDL), has been investigated in the present work. The results have shown that when adding alcohol to mineral diesel fuel, the maximum temperature of the cylinder liner increases, respectively: E10: 5.4%; B10: 3.7%; and M10: 2.23%. This enables the engine to continue operating safely with diesel-alcohol dual fuel.
The thermal circuit approach is used to investigate the process of heat transfer (heat conduction) from the rings and piston skirt region to the cylinder wall in our study. However, because analytical approaches cannot fully explain the entire flow and heat fields in the cylinder, particularly in the boundary layer, empirical methodologies are still used to select these parameters. Furthermore, engine operating conditions, such as the warm-up process, have substantial effects on cylinder temperatures, therefore it can be included in the next phases in our future research.
|
T |
temperature, K |
|
wt% |
percent by mass (weight) |
|
Greek symbols |
|
|
$\alpha$ |
convective heat transfer coefficient, W/m2K |
|
Subscripts |
|
|
TDC |
top dead center |
|
BDC |
bottom dead center |
|
CMP |
compression process |
|
EXH |
exhaust process |
|
TDCF |
top dead center firing |
The following APDL Code is a written program for a specific case (B10 fuel) by The ANSYS Parametric Design Language (APDL):
FINISH
/CLEAR
/TITLE, THE TEMPERATURE DISTRIBUTION OF THE CYLINDER LINER IN A V12 EINGINE-B10
/FILNAME,Cylinder-V12-B10
/PREP7
KEYW,Thermal,1
/PMETH,STAT,0
K,1,0,0,0
K,2,78.5,0,0
K,3,78.5,64,0
K,4,79,64,0
K,5,79,82.3,0
K,6,82,82.3,0
K,7,82,122.3,0
K,8,81,122.3,0
K,9,81,259,0
K,10,82.5,259,0
K,11,82.5,268,0
K,12,86,268,0
K,13,86,275,0
K,14,77.5,275,0
K,15,77.5,276.8,0
K,16,75,276.8,0
K,17,75,268.8,0
K,18,75,238.8,0
K,19,75,208.8,0
K,20,75,178.8,0
K,21,75,148.8,0
K,22,75,118.8,0
K,23,75,88.8,0
K,24,75,0,0
K,25,0,280,0
L,2,3
L,3,4
L,4,5
L,5,6
L,6,7
L,7,8
L,8,9
L,9,10
L,10,11
L,11,12
L,12,13
L,13,14
L,14,15
L,15,16
L,16,17
L,17,18
L,18,19
L,19,20
L,20,21
L,21,22
L,22,23
L,23,24
L,24,2
LGLUE,ALL
AL,ALL
VROT,ALL,,,,,,1,25,90,1
/VIEW,1,-2,1,1
/TYPE
ET,1,SOLID90
MPTEMP,1,20,100,200,300,400,500
MPTEMP,7,600,700,800
MPDATA,C,1,2,496,517,533,546,575,609
MPDATA,C,1,8,638,676
MPDATE,DENS,1,1,7710,7710,7710,7710,7710,7710
MPDATE,DENS,1,7,7710,7710,7710
MPDATA,KXX,1,1,33*10E-3,33*10E-3,32*10E-3,31*10E-3,20*10E-3,20*10E-3
MPDATA,KXX,1,7,28*10E-3,27*10E-3,27*10E-3
MPDATA,ALPX,1,2,11.5*10E-6,11.8*10E-6,12.7*10E-6,13.4*10E-6,13.9*10E-6,14.7*10E-6
MPDATA,ALPX,1,8,14.9*10E-6
MPDATA,ALPY,1,2,11.5*10E-6,11.8*10E-6,12.7*10E-6,13.4*10E-6,13.9*10E-6,14.7*10E-6
MPDATA,ALPY,1,8,14.9*10E-6
MPDATA,ALPZ,1,2,11.5*10E-6,11.8*10E-6,12.7*10E-6,13.4*10E-6,13.9*10E-6,14.7*10E-6
MPDATA,ALPZ,1,8,14.9*10E-6
TUNIF,400
SFA,16,,CONV,360.60*10E-6,980.43
SFA,17,,CONV,348.26*10E-6,790.43
SFA,18,,CONV,325.59*10E-6,753.46
SFA,19,,CONV,230.44*10E-6,640.82
SFA,20,,CONV,198.56*10E-6,588.76
SFA,21,,CONV,186.92*10E-6,587.43
SFA,22,,CONV,500*10E-6,355.15
SFA,23,,CONV,500*10E-6,341.15
SFA,2,,CONV,200*10E-6,328.15
SFA,4,,CONV,5000*10E-6,358.15
SFA,6,,CONV,5000*10E-6,358.15
SFA,8,,CONV,6000*10E-6,363.15
SFA,10,,CONV,5000*10E-6,364.15
SFA,12,,CONV,5000*10E-6,364.15
ESIZE,6
VSWEEP,ALL
FINISH
/SOLU
ANTYPE,0,NEW
NROPT,AUTO
CNVTOL,TEMP,300,0.0005
SOLVE
FINISH
/POST1
PLNSOL,TEMP,,,1
[1] Regattieri Sampaio, M., Rosa, L.P., de Almeida D′Agosto, M. (2007). Ethanol–electric propulsion as a sustainable technological alternative for urban buses in Brazil. Renewable and Sustainable Energy Reviews, 11(7): 1514-1529. https://doi.org/10.1016/j.rser.2005.11.007
[2] Bayraktar, H. (2008). An experimental study on the performance parameters of an experimental CI engine fueled with diesel–methanol–dodecanol blends. Fuel, 87(2): 158-164. https://doi.org/10.1016/j.fuel.2007.04.021
[3] Ghadikolaei, M.A. (2016). Effect of alcohol blend and fumigation on regulated and unregulated emissions of IC engines: A review. Renewable and Sustainable Energy Reviews, 57: 1440-1495. https://doi.org/10.1016/j.rser.2015.12.128
[4] Emiroğlu, A.O., Şen, M. (2018). Combustion, performance and emission characteristics of various alcohol blends in a single cylinder diesel engine. Fuel, 212: 34-40. https://doi.org/10.1016/j.fuel.2017.10.016
[5] Jamrozik, A. (2017). The effect of the alcohol content in the fuel mixture on the performance and emissions of a direct injection diesel engine fueled with diesel-methanol and diesel-ethanol blends. Energy Conversion and Management, 148: 461-476. https://doi.org/10.1016/j.enconman.2017.06.030
[6] Kumar, S., Cho, J.H., Park, J., Moon, I. (2013). Advances in diesel–alcohol blends and their effects on the performance and emissions of diesel engines. Renewable and Sustainable Energy Reviews, 22: 46-72. https://doi.org/10.1016/j.rser.2013.01.017
[7] Atmanlı, A., İleri, E., Yüksel, B. (2015). Effects of higher ratios of n-butanol addition to diesel–vegetable oil blends on performance and exhaust emissions of a diesel engine. Journal of the Energy Institute, 88(3): 209-220. https://doi.org/10.1016/j.joei.2014.09.008
[8] Rakopoulos, D.C., Rakopoulos, C.D., Giakoumis, E.G., Dimaratos, A.M. (2010). Effects of butanol–diesel fuel blends on the performance and emissions of a high-speed DI diesel engine. Energy Conversion and Management, 51(10): 1989-1997. https://doi.org/10.1016/j.enconman.2010.02.032
[9] Campos-Fernández, Arnal, J.M., Gómez, J., Pilar Dorado, M. (2012). A comparison of performance of higher alcohols/diesel fuel blends in a diesel engine. Applied Energy, 95: 267-275. https://doi.org/10.1016/j.apenergy.2012.02.051
[10] Richardson, D.E. (2000). Review of power cylinder friction for diesel engines. Trans ASME, J Eng Gas Turb Power, 122(4): 504-519. https://doi.org/10.1115/1.1290592
[11] Dehghani Firoozabadi, M., Shahbakhti, M., Koch, C.R., Jazayeri, S.A. (2013). Thermodynamic control-oriented modeling of cycle-to-cycle exhaust gas temperature in an HCCI engine. Appl Energy, 110: 236-243. https://doi.org/10.1016/j.apenergy.2013.04.055
[12] Wang, X., Stone, C.R. (2008). A study of combustion, instantaneous heat transfer, and emissions in a spark ignition engine during warm-up. Proc ImechE, Part D: J Automob Eng., 222: 607-618. https://doi.org/10.1243/09544070JAUTO610
[13] Trung, K.N. (2020). A study for determination of the pressure ratio of the V12 diesel engine based on the heat flow density to cooling water. Lecture Notes in Networks and Systems, 178: 64-74. https://doi.org/10.1007/978-3-030-64719-3_9
[14] Trung, K.N. (2021). Effect of heat transfer correlation on wet cylinder liner temperature distribution when converting an old engine into a turbocharged engine. Archives of Thermodynamics, 42(3): 159-172. https://doi.org/10.24425/ather.2021.138114
[15] Kien, N.T., Hai, H.T. (2021). Effects of ethanol port injection timing and delivery rate on combustion characteristic of a heavy-duty V12 diesel engine. Thermal Science, 26(1): 343-352. https://doi.org/10.2298/TSCI200710137N
[16] Trung, K.N. (2021). The temperature distribution of the wet cylinder liner of v-12 engine according to calculation and experiment. Journal of Thermal Engineering, 7(14): 1872-1884. https://doi.org/10.18186/thermal.1051265