Sarah Abbas Jawad* | Farhan Lafta Rashid | Zeina Ali Abdul Ridha
© 2022 IIETA. This article is published by IIETA and is licensed under the CC BY 4.0 license (http://creativecommons.org/licenses/by/4.0/).
OPEN ACCESS
Water stream flow is the major factor that affects the performance of a spiral solar water collector, it can be maximize the collector performance by decreasing the water stream flow velocity. The water stream flow was in two spiral tube arrangements of length 15 m, diameter 0.012 m, and number of coils (11). The inner surface of the solar collector was coated with matte black paint with a mixture of nanomaterial (thermal dye with 5% TiN). The experimental rig placed in Babylon - Iraq, at longitude (44.4 E) and latitude (32.4 N) in the best experimental conditions for the province during the month's (2,3,4,5). Also, a simulation program was made to extract the results in the case of a single flow, where the geometry was drawn in the Solid Work program and then entered into the ANSYS program, where the same practical cases were applied. The experimental results were compared with the numerical results which gave a good agreement with an error percent of 11% and 8.8% in the closed and opened system, respectively. The experiment included two parts, the first part: the flow of water in four different levels at case of the closed system (1, 1.5, and 2) L/min. The second part: the flow of water was at the same levels but at case of open system. The results showed that a decrease in the mass flow rate leads to increase in exit temperature and thus increase in the temperature difference between (inlet and outlet). The maximum temperature difference in the closed system was 25.2℃ for a water flow rate of 1 L/min. The maximum temperature difference in the open system was 12.3℃ for the water flow rate of 1 L/min.
closed system, open system, solar water collector, spiral solar water collector, solar water collector simulation and solar energy
As a result of the environmental situation caused by the damages burning fossil fuels and their overuse, the ecological balance has been disturbed and pollution has increased dramatically, especially in recent years. All this led to resorting to the use and investment of renewable energies and the constant pursuit of its development. There are many types of sustainable renewable energy, the most important and most famous of which is solar energy, because it is often the basis of itself and many other energies. Countries must use a correct policy to adopt and support these energies and innovations, to ignite the spirit of competition and show more capabilities among the explorers on the one hand, and to show their interest in development and highlight the outstanding performance that renewable energy technology can offer on the other hand [1]. The most common way to heat water in the past and still is today was the use of sunlight. It started with a simple idea according to the tools available at that time, and then gradually began to develop according to the techniques and technologies of each era. Where developers an advertisements scientific researchers compete to include and develop reasonable ideas to make the most of the sun's rays at appropriate costs so that solar collectors are widely included in the market and become an alternative to electric heater [2].
The researchers Maheshwaran and Kalidasa Murugavel [3] studied the performance of a solar-powered water heaters with spiral flow Where the solar collector was a spiral copper tube well fixed on an aluminum plate covered with glass, tests were conducted in the summer in India, where the efficiency of the spiral solar heater increased compared to the flat solar heater. Hashim et al. [4] created a flat square solar collector (resembling a spiral) designed with specific dimensions and the flowing from an entrance to the outside is 15.9 meters long. They ran with two different flow patterns (5.3 and 6.51 L / min) and used water. The experiments were conducted under the conditions of the University of Technology in Baghdad, Iraq. As they concluded from the experiment with little flow, the temperature increased. And the formation of the solar collector in this way led to an increase in its efficiency and effectiveness. Moravej et al. [5] worked an experimental study of circular flat plate solar collector behavior with winding pipes, where they changed the geometry of the collector, as it was made of a flat plate, circular in shape with an area of one square meter, and inside it there are spiral tubes that flow from the sides and way out from the middle. The experiments were conducted according to ASHRAE specifications, focusing on the thermal behavior of the solar collector and measuring the efficiency. As the efficiency of this solar collector reached 75.3%. Verma et al. [6] worked performance comparison of innovative spiral shaped solar collector design with conventional flat plate solar collector. Encouraging results were obtained in the obligatory conditions set by the researcher, where the efficiency was improved by approximately 21.94 compared to the flat solar collector. Pavlović et al. [7] designed a complex using commercial Solid Works software and simulated thermally and optically in their Flow Simulation Studio (FSS). Optical study has demonstrated that the quixotic placement of the absorber material is 2.1 m from the reflector location to enhance the optical duty and make a proportional heat flux through the absorber. In the thermal analysis part, the efficiency of energy was predicted to be around 65%, while the efficiency of energy ranged from 4 to 15% depending on the temperature of the inlet water. Rajkumar et al. [8] studied the performance of a winding solar water collector without an absorbent plate, where it is focused on the use of helical solar water collector with twice disclosure and compare the results of experimental with that obtained from ANSYS software. The experiment was conducted at different flow rates and times, where the analytical and experimental results showed maximum error of 0.6 percent. The research showed that the theoretical results and the results of the analysis do not have a significant difference. Saffarian et al. [9] presented a software comparison between the different collector shapes (a conventional flat solar collector and a flat U shaped spiral tube solar collector). In addition to this, nanomaterial's were used with water to improve the thermal transfer performance, and they obtained good results in the spiral and U-shape.
This research aims to study the thermal performance of the solar water collector practically and numerically, where the results are extracted through the experimental performance of the solar water collector and compared with the results of the numerical analysis of the simulation program (ANSYS) of the flowing water in two arranged spiral copper tubes. The performance of the solar water collector was examined experimentally in Babylon - Iraq, longitude (44.4 E) and latitude (32.4 N) in the best experimental conditions of the province during the months of the beginning of the year.
The experiment included the work of several parts:
1. Provide an overview of recent developments in the field of improving the performance of solar water collectors.
2. The design of the manual work system, the solar water collector, consists of two copper tubes in a spiral arrangement with a length of 15 meters, a diameter of 0.012 meter with 11 coils. The inner surface of the solar collector is also painted with matte black paint with a mixture of nanomaterials (5%) with thermoplastic dye of (TiN).
3. The practical experiment included two parts, the first part was the flow of water only at four different levels (1, 1.5, and 2) L/min in the case of a closed system. The second part is the flow of water at the same flow levels, but in the case of an open system.
4. We performed experiments to measure the inlet and outlet temperature in each test, as well as the absorbent plate temperature.
5. Measuring the effects of various factors (solar radiation, air temperature, and water flow rate) on the performance of the solar water collector.
6. The numerical experiment included the use of a simulation system, where we created a virtual pool for water powered by solar energy, which was designed in the Solid Work program and then entered into the Ansys program. The test was conducted in the program and extracted the results of water flow at four different levels (1, 1.5 and 2) L/min, for both systems (closed and open).
7. Analyze and compare experimental results.
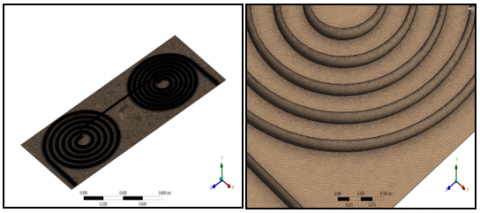
The designing of solar collector was with special specifications to make the most of the solar radiation falling on it, as attention was paid to its design in terms of angles and in terms of choosing the shape, where the tubes were installed in the form of two spiral rings, and the inner surface of the solar collector was also painted with a matte black paint with a mixture of a nanomaterial (thermal dye with 5% of TiN) to increase the plate's absorption of radiation, which causes an increase in the heat transfer to the water, the solar collector is also a type of heat exchanger that absorbs heat from sunlight, as the heat is transmitted between the parts of the collector starting from the fall of solar radiation on the glass plate and its transmission between the layers of the solar collector to the flat plate, part of it turns into the working fluid that flows in the collection tubes, the rest is reflected or scattered.
The sketch of the experimental rig and the image of the solar collector are shown in Figures 1 and 2, respectively. Also, Table 1 shows the specifications of the solar collector.
(1. Tank, 2. Water pump, 3. Water flow meter, 4. Valve, 5. Check valve, 6. Temperature recorder, 7. Thermocouple, 8. Solar water collector, 9. Storage tank)
Figure 1. sketch of the experimental rig
Figure 2. Photographic view of the experimental rig
Table 1. Specification of the solar collector
|
Dimensions |
120*80*24 cm |
|
Casing |
Aluminum alloy/ white |
|
Cross area |
0.9600 m2 |
|
Aperture area |
0.7810 m2 |
|
Absorber Material |
Special black coating mixed with nonmaterial |
|
Tube material |
Copper |
|
Tube specification |
Length:15 m, diameter:0.012 m, number of coil: 11 |
|
Insulation material |
Fiber glass, thickness: 3 cm |
|
Glass cover |
Thickness: 6 cm |
|
Tilt angle |
45˚ |
The simulation is done using ANSYS 21 with various procedures and they are described as follows:
A. Meshing
ANSYS relies on solving problems based on the finite element method in the solution, which is known as a grid, which divides the shape into small areas, to perform hundreds or thousands of calculations that check each item to choose the most accurate solution.
For this simulation, the suggested lattice type is a tetrahedron. Geometric patterns must be defined in the best number of blocks to form a suitable mesh to give accurate results. Several attempts were made to test, then the feature network results were designed as shown in Table 2. Figure 3. illustrates the 3D network for the initialization analyzed in this work.
Figure 3. Mesh of SAHWS
Table 2. Details of the mesh
|
Details of the Mesh |
Values |
|
Elements number |
19,718,339 |
|
Nodes of number |
3,950,928 |
|
Minimum size of cell |
0.001 m |
|
Maximum size of cell |
0.01m |
|
Growth Rate |
1.2 |
|
Curvature Normal Angle |
18.0 ˚ |
|
Bounding Box Diagonal |
2.1703 m |
|
Average Surface Area |
8.0224e-002 m2 |
4.1 Boundary conditions
The boundary conditions for model elements zone is shown in the Table 3.
Table 3. Illustrates the boundary conditions
|
Boundary – Inlet Water |
|
|
Type |
Water Flow rate :(1, 1.5, 2) L/min |
|
Water Temperature |
Taken from exp. Data |
|
Boundary – Outlet water |
|
|
Pressure |
0 Pa |
|
Boundary – Wall |
|
|
Type |
Walls |
|
Heat Flux |
Taken from exp. Data |
4.2 Methodology adapted
In the present case, ANSYS Fluent was used to solve Reynolds Averaged Navier Stokes equations (RANS), these equations are based on the fundamental concepts of conservation of mass, energy and momentum [10-16].
4.3 Continuity equation
$\frac{\partial \rho}{\partial t}+\nabla \cdot(\rho \bar{u})=0$ (1)
The first term in Eq. (1) represents the change rate of mass in a control volume element and the second term represents the change rate in mass due to convection.
4.4 Momentum equation
$\frac{\partial}{\partial t}(\rho \bar{u})+\nabla(\rho \bar{u} \bar{u})=-\nabla P+\nabla(\overline{\bar{\tau}})+\rho \bar{g}$ (2)
The first term in Eq. (2) represents the change rate of momentum into volume element and the second term represents the change rate in momentum due to convection, the third is the change rate due to pressure forces, the fourth represents the change rate due to viscous forces and the last is the change rate due to gravitation.
4.5 Energy equation
$\rho c_{p}\left(\frac{\partial \mathrm{T}}{\partial \mathrm{t}}+\mathrm{v}_{x} \frac{\partial t}{\partial x}+v_{y} \frac{\partial T}{\partial y}\right)=\lambda\left(\frac{\partial^{2} T}{\partial x^{2}}+\frac{\partial^{2} T}{\partial y^{2}}\right)$ (3)
Eq. (3) represents the energy equation which is required whenever heat transfer or pressure work is present in the flow. For our case, the flow is assumed to be compressible and constant viscosity.
The performance of the solar water collector was verified experimentally and numerically under the influence of different levels of water flow. The work was carried out from ten in the morning until four in the evening, and the results were taken every 15 min of the specified period and on different days during the month's (2, 3, 4, 5) under almost the same weather conditions in terms of solar radiation, air temperature and humidity, and wind speed, which had a clear impact on the performance of the device solar water collection.
The three levels of water flow rate (1, 1.5, 2) L/min were taken, as it is observed that the decrease in the mass flow rate leads to an increase in the output temperature and thus an increase in the difference in the outlet and inlet temperature in the case of incoming and outgoing systems; As the lower mass flow rate is small and thus causes more solar energy to be absorbed.
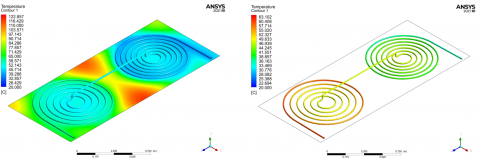
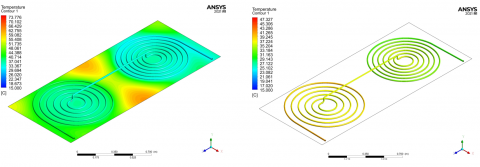
The numerical analysis shows that in the time period 11 AM to 3 PM when the water flow is at a rate of 1 L/min, it gives the best results due to the slow water flow through the copper tubes in the solar collector, which allows more time to the absorber plate to transfer the required heat to the water. The resulting water is as hot as possible at this flow level, and the value of the highest temperature was 61.8℃ as shown in Figure 4 in the closed system, while the value of the highest temperature in the open system was 46℃ as shown in Figure 7.
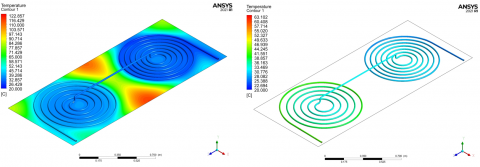
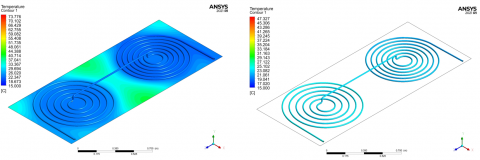
For the time period 11 AM to 3 PM, when the water flow is at a rate of 1.5 L/min, it gives a good results, but the flow is less than the case of using one liter per minute, so the highest temperature was 54.5℃ in the closed system as shown in Figure 5, but in the open system there is no big difference and the highest temperature was 30.8℃ as shown in Figure 8.
Figure 4. Temperature distributions for the absorber plate with water flow rate of 1 L/min. at time interval (11 AM -12 PM/12 PM -1 PM/1 PM -2 PM/2 PM -3 PM), respectively
Figure 5. Temperature distributions for the absorber plate with water flow rate of 1.5 L/min. at time interval (11 AM -12 PM/12 PM -1 PM/1 PM -2 PM/2 PM -3 PM), respectively
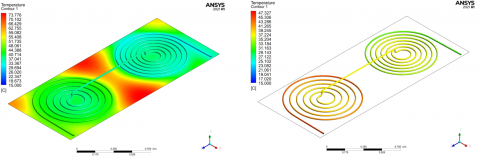
Figure 6. Temperature distributions for the absorber plate with water flow rate of 2 L/min. at time interval (11 AM -12 PM/12 PM -1 PM/1 PM -2 PM/2 PM -3 PM), respectively
Figure 7. Temperature distributions for the absorber plate with water flow rate of 1 L/min. at time interval (11 AM -12 PM/12 PM -1 PM/1 PM -2 PM/2 PM -3 PM), respectively
Figure 8. Temperature distributions for the absorber plate with water flow rate of 1.5 L/min. at time interval (11 AM -12 PM/12 PM -1 PM/1 PM -2 PM/2 PM -3 PM), respectively
Figure 9. Temperature distributions for the absorber plate with water flow rate of 2 L/min. at time interval (11 AM -12 PM/12 PM -1 PM/1 PM -2 PM/2 PM -3 PM), respectively
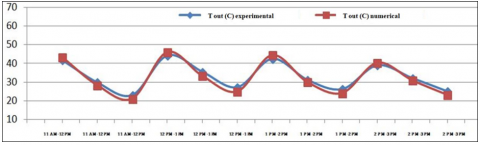
Figure 10. Comparison between the experimental and numerical results (closed system)
Figure 11. Comparison between the experimental and numerical results (opened system)
Table 4. Comparison between the experimental and numerical results (Close system)
|
Local Solar Time |
Water Flow Rate (L/min.) |
Tin (℃) |
Tout (℃) experimental |
Tout (℃) numerical |
Error (%) |
|
11 AM -12 PM |
1 |
32.2 |
52.2 |
55.3 |
5.9 |
|
11 AM -12 PM |
1.5 |
30.5 |
48.2 |
52.5 |
8.9 |
|
11 AM -12 PM |
2 |
23.3 |
43.5 |
40.9 |
5.9 |
|
12 PM -1 PM |
1 |
35 |
58.2 |
61.8 |
6.1 |
|
12 PM -1 PM |
1.5 |
30.8 |
48.9 |
53 |
8 |
|
12 PM -1 PM |
2 |
24.7 |
48.1 |
42.7 |
11 |
|
1 PM -2 PM |
1 |
32 |
57.2 |
61 |
6.6 |
|
1 PM -2 PM |
1.5 |
32.3 |
51.9 |
54.5 |
5 |
|
1 PM -2 PM |
2 |
25 |
46.9 |
42.8 |
8.7 |
|
2 PM -3 PM |
1 |
32.8 |
55.6 |
59 |
6 |
|
2 PM -3 PM |
1.5 |
31.2 |
49.2 |
51.2 |
4 |
|
2 PM -3 PM |
2 |
24.3 |
47.8 |
42 |
12 |
Table 5. Comparison between the experimental and simulation results (Open system)
|
Local Solar Time |
Water Flow Rate (L/min.) |
Tin (℃) |
Tout (℃) experimental |
Tout (℃) numerical |
Error (%) |
|
11 AM -12 PM |
1 |
31 |
42.3 |
44 |
4 |
|
11 AM -12 PM |
1.5 |
23.3 |
29.8 |
28.3 |
5 |
|
11 AM -12 PM |
2 |
17.1 |
22.7 |
20.6 |
8.8 |
|
12 PM -1 PM |
1 |
31.5 |
44.1 |
46 |
4.3 |
|
12 PM -1 PM |
1.5 |
25.2 |
32.1 |
30.5 |
4.9 |
|
12 PM -1 PM |
2 |
20.9 |
27.2 |
24.9 |
8.4 |
|
1 PM -2 PM |
1 |
31 |
43.3 |
45.2 |
4.3 |
|
1 PM -2 PM |
1.5 |
26 |
32.2 |
30.8 |
4.3 |
|
1 PM -2 PM |
2 |
20.5 |
26.4 |
24.2 |
8.3 |
|
2 PM -3 PM |
1 |
29.8 |
42.4 |
44.3 |
4.4 |
|
2 PM -3 PM |
1.5 |
26.7 |
31.9 |
30.6 |
4 |
|
2 PM -3 PM |
2 |
20.4 |
26.2 |
24.1 |
8 |
For the time period 11 AM to 3 PM, when the water flow is at a rate of 2 L/ min, it gives results that are not very satisfactory because of the speed of the water flow and not catching up with the heat transfer and heating it sufficiently, the highest temperature was 42.8℃ in the closed system as shown in Figure 6, while in the open system, the highest temperature was 24.9℃ as shown in the Figure 9.
After extracting the simulation results and clarifying them in the form of pictures, as well as extracting the exit water temperature during the proven time periods, and then comparing it with the practical results,
As shown in Table 4 in the case of the closed system, and it shows that the error rate amounted to 11%, also the results were plotted for all the periods used, in Figure 10, where the period from 12 PM to 1 PM recorded the highest value of the outgoing temperature. At a flow of 1 liter per minute, which amounted to 61.8 in the simulation, and reached 58.2 due to the increase in solar radiation in this period, as the difference is simple and acceptable between the practical and simulation results, then the value begins to decrease as the rate of water flow through the solar water collector increases.
In the open system, the values were shown in Table 5. The simulation and practical results were also compared and showed that the highest error rate was 8.8%. The results were plotted in Figure 11, where the highest temperature was also recorded in the period 12 PM to 1 PM due to high solar radiation and then it records lower degrees in the same period when the levels of water flow in the solar collector increase.
In this work, the design of the experimental rig which consists of two copper tubes in a two-spiral arrangement, and the inner surface of the solar collector is also painted with matte black paint with a mixture of nanomaterials (5%) with thermoplastic dye of (TiN). The research showed that the theoretical results and the results of the analysis are similar and have a good agreement. So while designing the spiral solar water collector, there is no need to create a prototype instead we can design the model through the software and analyze it to predict the results. For our convenience, the required port temperature, plate temperature and all related data are obtained.
[1] Ishii, S., Sugavaneshwar, R., Nagao, T. (2016). Titanium nitride nanoparticles as plasmonic solar heat transducers. J. Phys. Chem. C, 120(4): 2343-2348. https://doi.org/10.1021/acs.jpcc.5b09604
[2] Rockenbaugh, C., Dean, J. (2016). High Performance Flat Plate Solar Thermal Collector Evaluation. https://doi.org/10.13140/RG.2.1.4966.6808
[3] Maheshwaran, S., Kalidasa Murugavel, K. (2013). Experimental study on spiral flow passive solar water heater. Appl. Sol. Energy (English Transl. Geliotekhnika), 49(2): 89-92. https://doi.org/10.3103/S0003701X13020060
[4] Hashim, W., Shomran, A., Jurmut, H., Gaaz, Kadhum, H., Al-Amiery, A. (2018). Case study on solar water heating for flat plate collector. Case Stud. Therm. Eng., 12: 666-671. https://doi.org/10.1016/j.csite.2018.09.002
[5] Moravej, M., Saffarian, M., Li, L., Doranehgard, M., Xiong, Q. (2020). Experimental investigation of circular flat-panel collector performance with spiral pipes. J. Therm. Anal. Calorim., 140(3): 1229-1236. https://doi.org/10.1007/s10973-019-08879-1
[6] Verma, S., Sharma, K., Gupta, N., Soni, P., Upadhyay, N. (2020). Performance comparison of innovative spiral shaped solar collector design with conventional flat plate solar collector. Energy, 194: 116853. https://doi.org/10.1016/j.energy.2019.116853
[7] Pavlović, S., Bellos, E., Stefanović, V., Tzivanidis, C., Stamenković, Z. (2016). Design, simulation, and optimization of a solar dish collector with spiral-coil thermal absorber. Therm. Sci., 20(00): 1387-1397. https://doi.org/10.2298/TSCI160213104P
[8] Rajkumar, I., Paul Vinofer, B., Chokkalingam, B., Raja, V., Professor, A. (2020). Thermal performance investigation of spiral solar collector using Cfd. Int. J. Adv. Sci. Technol., 29(12s): 1968-1981.
[9] Saffarian, M., Moravej, M., Doranehgard, M. (2020). Heat transfer enhancement in a flat plate solar collector with different flow path shapes using nanofluid. Renew. Energy, 146: 2316-2329. https://doi.org/10.1016/j.renene.2019.08.081
[10] Abdul Redha, Z., Rashid, F. (2021). Heat transfer enhancement in subchannel geometry of pressurized water reactor using water-based yttrium oxide nanofluid. International Journal of Heat and Technology, 39(3): 979-986. https://doi.org/10.18280/ijht.390335
[11] Talib, Sh. Rashid, F., Eleiwi, M. (2021). The effect of air injection in a shell and tube heat exchanger. Journal of Mechanical Engineering Research and Developments, 44(5): 305-317.
[12] Azziz, H., Shareef, A., Rashid, F. (2018). Experimental investigation of the heat transfer for the effect of nanoparticles with different base fluid and solar collector tilt angle. Journal of Engineering and Applied Sciences, 13(13): 10614-10620.
[13] Shareef, A.S., Rashid, F.L., Hassan, A.J. (2017). The experimental investigation of a flat plate solar collector using water as a heat transfer agent. Information and Computer Technology, Modeling and Control: Proceedings of the International Scientific Conference Devoted to the 85th Anniversary of Academician I. V. Prangishvili, pp. 107-117.
[14] Rashid, F.L., Talib, S.M., Hussein, A.K., Younis, O. (2022). An experimental investigation of double pipe heat exchanger performance and exergy analysis using air bubble injection technique. Jordan Journal of Mechanical and Industrial Engineering, 16(2): 195-204.
[15] Hussein, E.Q., Rashid, F.L., Hussein, A.K., Younis, O. (2021). Hydrodynamics of single bubble rising through water column using volume of fluid (VOF) method. Journal of Thermal Engineering, 7(1): 2107-2114. https://doi.org/10.14744/jten.2021.0006
[16] Hashima, H.T., Rashid, F.L., Kadham, M.J. (2021). Concentration solar thermoelectric generator (CSTEG): Review paper. Journal of Mechanical Engineering Research and Developments, 44(1): 435-447.