Shiva Kumar | Vijay Gaddle Srinivas | Krishna Murthy* | Mohammed Shaheen Sudheer
© 2021 IIETA. This article is published by IIETA and is licensed under the CC BY 4.0 license (http://creativecommons.org/licenses/by/4.0/).
OPEN ACCESS
The present work analyses the performance and combustion characteristics of LPG- diesel dual fuel engine. The combustion process has been studied using a two-zone model and vital parameters like pressure rise, peak pressure, heat release rate in both premixed and diffusion phase of combustion are analyzed. The predicted results are compared with the obtained experimental values from a four stroke stationary diesel engine. The results revealed that the performance of the dual fuel engine deteriorates at lower loads and with reduced LPG mass flow rates. It was observed that higher LPG flow rates with higher loads result in abnormal combustion. At 75% load conditions with a 0.6 kg/hr LPG mass flow rate showed optimum engine performance in a higher pressure rise and rate heat release. Further predicted results for the rate of pressure rise and heat release rate indicated a good agreement between the simulated and experimental results with an average difference of 12% between them over the tested range. The present work emphasizes the utilization of gaseous fuel in CI engines more effectively with dual fuel mode since the liquid fuel cost is steadily rising.
dual fuel, pressure rise, pilot fuel, crank angle, heat release rate
Diesel engines are the widely accepted prime movers due to their various advantages such as higher power, better fuel economy, and durability. An increase in the number of vehicles has increased the demand for liquid fuel. The exponential growth in the consumption of fuel resulted in a fuel crisis. Since gaseous fuels such as LPG (Liquefied Petroleum gas), CNG (Compressed natural gas), biogas, and producer gas, are available abundantly, they can be used as an alternative fuel in conventional engines [1-3]. However, using those gaseous fuels directly in diesel engines is impossible, as the auto-ignition temperature of such gaseous fuels is very high. Alternatively, those gaseous fuels could be introduced along with air and combusted inside the engine cylinder. The combustion is possible by injecting a small quantity of pilot fuel such as diesel, which results in dual fuel engine concept. Dual fuel engines exhibit combustion features of both SI and CI engines [4]. The inducted gaseous fuel and air are called primary fuel. To initiate the combustion process, pilot fuel is injected at the end of compression stroke, similar to standard diesel engines. The dual fuel combustion depends on the type and flow rates of primary and secondary fuels, load, injection timing, injection pressure and injector configuration [5, 6]. Several researchers have conducted experimental investigations using various kinds of inducted fuels in diesel engines.
Ganesan and Ramesh [7] carried out the performance and emission studies in a C.I engine using diesel-LPG combination. Their observation was the highest increase in thermal efficiency at full load with 35% diesel substitution. Barbour et al. [8] used natural gas as the gaseous fuel along with diesel. Experimental study on a dual fuel engine by Papagiannakis and Hountalas [9] shown that peak pressure rise in a dual fuel mode is higher than the conventional diesel engine. At lower loads, combustion duration was longer with increased BSFC. Poonia et al. [10] investigated the dual fuel combustion features of LPG with diesel fuel engines and concluded that at low loads, dual fuel combustion is not effective. On the other hand, reliable combustion was observed at 20-40% LPG substitution with optimum loading conditions. Kumar et al. [11] concluded that 7% increase in BTE could be achieved using H2 and vegetable oil in a dual fuel engine. Investigations [12-14] on dual fuel engines resulted in satisfactory results using gaseous fuels like biogas, producer gas and H2, along with diesel.
The dual fuel combustion is influenced mainly by the type and quantity of the primary and secondary fuels, operating parameters such as compression ratio, injection pressure and engine load. Thus, engine design requires all those operating parameters to be optimized for the best combustion performance. Such important parameters are obtained by exhaustive experimentation or through modeling and simulation. Conducting experiments for all different combinations of the variables is cumbersome, time-consuming and not economical. Combustion analysis through numerical modeling by the computational fluid dynamics approach is complicated due to complex geometry and higher computational time. Conversely, analytical modeling and simulation is another approach wherein, fundamentals of thermodynamics, combustion process, and energy balance are used to predict the performance parameters. The advantages of the analytical method are easy prediction, reduced computational time, and highly accurate prediction.
Several researchers conducted analytical modeling of normal CI engines [15, 16]. The combustion modeling in a dual fuel engine is a complicated process. Liu et al. [17] simulated five-zone combustion model in a dual fuel engine with methane-diesel combination. The predicted results of combustion and experimental results were very close to each other. Hountalas and Papagiannkis [9] formulated a two-zone model to predict the combustion parameters of a dual fuel engine with the diesel-natural gas combination. Results indicated a rise in peak pressure and thermal efficiency, which further increased with the surge in gaseous fuel percentage. Thygarajan and Babu [18] developed a single-zone combustion model to forecast the performance parameters using a diesel biogas combination. They modeled the spray characteristics and the results obtained were in line with the experimental values. The numerical approach by Mbarawa et al. [19] shows that increasing the number of holes and injection pressure will lead to improved engine performance. The prediction model by Mansoor et al. [20] was for natural gas-diesel combination. They simulated the parameters like peak pressure, temperature and species concentrations and the results were very close to the experimental results.
Karim and Liu [21] and Ahmad et al. [22] have studied similar analytical models to predict the combustion parameters. A multi-zone dual fuel model by Liu et al. [23] predicted the spray and combustion characteristics. They concluded that air entrainment significantly contributes to engine performance, and accurate results can be obtained by considering the wall impingement. Similar combustion models have been developed by the researchers [24-26] using a combination of diesel and other gaseous fuels.
Most of the developed models were based on fuels like natural gas, CNG etc., and models using LPG- diesel dual fuel combinations are scanty. In most of the available literature for dual-fuel mode, the cylinder pressure data has been used to predict heat release and pollutant formation. However, there is very limited research available with pilot fuel, inducted fuel, and relative proportions for modeling the dual fuel engine. In addition to this, most of the authors used Wiebe’s function to predict the heat release rate in a conventional diesel engine, whereas literature related to the applicability of Wiebe’s model to a dual fuel engine is very limited.
By considering the above facts, an attempt has been made to develop a simulation model to predict engine cylinder pressure as well as heat release rate in a dual fuel engine, run with the diesel-LPG combination. Experiments were conducted using the above combination of fuels under different operating conditions and a blend of primary and secondary fuel flow rates. The combustion parameters, such as cylinder pressure, heat release etc., have been predicted and compared with the experimental values to validate the developed prediction model.
Combustion modeling helps to analyze the heat release rate and pollutants formation. The developed dual fuel engine combustion model is a two-dimensional phenomenological type. The combustion characteristics like rate of pressure, heat release pattern and knocking are affected by the quantity of fuel injected and rate and pattern of injection. The injector forms an integral part of dual fuel engine. The influencing parameters of fuel injection in a dual fuel are the velocity of the injected fuel, the mass of fuel injected, injection duration, cone angle and penetration, which are usually represented in terms of empirical relations. The heat released during combustion is a strong function of fuel injection per cycle. The mixing of the primary fuel injected in dual fuel engine is affected by the cone angle.
The fuel leaving the injector penetrates as a cylindrical liquid column before braking up known as break up length and the corresponding time is called the breakup period. The fuel injection velocity is considered constant during the breakup period. Once the breakup period ends, the spray jet breaks up due to the shear resistance of the air and gaseous fuel mixture and forms a conical shape, and then penetrates deep into the combustion chamber. The penetration helps in creating many ignition spots and initiation of combustion at many locations. When the spray jet breaks up it results in a free jet cone and further it results in entrainment of the surrounding air and gaseous fuel mixture into the cone. The entrainment is mainly due to the relative motion between the jet cone and the surrounding mixture. The mass of the surrounding gas mixture entrained is obtained using the relation given by [27]:
$\frac{\left(m_{e n}+m_{f}\right)}{m_{f}}=0.32\left(\frac{S}{d_{e}}\right)$ (1)
In the above equation, men represent the mass of gaseous fuel and air entrained and mf denotes the rate of primary fuel injected.
The entrained gaseous mixture in a dual fuel engine is nothing but uniformly mixed air and LPG mixture. The mass of LPG and air entrained at each crank angle is obtained by assuming uniform injection during the injection period. The cumulative fuel injected at the end of each crank angle position is obtained by adding the fuel injected successively at each crank angle. The overall air-fuel ratio is calculated at each crank angle position. The combustion will start only at the lapse of the delay period. At the end of breakup period, the entrainment of LPG and air mixture starts by the pilot jet. The interaction between pilot fuel and entrained gaseous results in combustion.
In dual fuel engines, the stoichiometric fuel air ratio is the chemically correct condition of both pilot and gaseous fuel together. When two hydrocarbon fuels with chemical formula Cx1Hy1 and Cx2Hy2 are mixed in proportion a1:a2, stoichiometric fuel air ratio is given by [28]:
$\begin{aligned}
\left(F /_{A}\right)_{\text {stoichio }}=&\left\{\frac{a}{a+b}\right\}\left(F /_{A}\right)_{\text {stoichio1 }} \\
&+\left\{\frac{b}{a+b}\right\}\left(F /_{A}\right)_{\text {stoichio2 }}
\end{aligned}$ (2)
where, $a=\left(\frac{x_{1}+y_{1}}{4}\right) a_{1} \text { and } b=\left(\frac{x_{2}+y_{2}}{4}\right) a_{2}$.
Stoichio1 and Stoichio2 represent the pilot fuel stoichiometric fuel-air ratios and gaseous fuel-air ratios considered separately. As combustion progresses inside the cone, the stoichiometric fuel air ratio continuously changes.
2.1 Combustion modelling
To analyse the combustion process, the working fluid inside the combustion chamber is considered in two zones after the delay period.
The two zones considered are at different temperatures and compositions, but the pressure will be uniform throughout as it is a direct injection engine. The entrainment process terminates when the cumulative entrained mass is equal to the sum of inducted air-LPG mixture and residual gasses.
2.1.1 Thermodynamic analysis
The first law of thermodynamics and continuity equations are used to analyze burnt and unburnt zones. Modeling fuel injection and the entrainment process will give the mass of burnt and unburnt zones separately. The total mass of working substance in the combustion chamber is obtained by the principle of conservation of mass, m= mu + mb, where the suffix ‘b’ refers to burnt charge and the suffix ‘u’ refers to unburnt charge. At the start of injection mb= 0 and mu= mLPG + mair + mresidualin which mair, mLPG, mresidual are the mass of air, LPG and residual gases respectively at the beginning of compression process. The burnt zone mass at any time is equal to the total mass of the fuel injected and the mass of the surrounding gasses entrained until that instant: $m_{b i_{i}}=m_{\text {inj } i}+m_{\text {entr } i}$. Since we are considering two-zone model, the volume constraint is given by $V_{i}=V_{u_{i}}+V_{b i}$ where suffix ‘i’ refers to combustion chamber volume at any moment. To account for energy contents of burnt and unburnt zones, the first law equation is written separately for both the zones:
$d U_{b}=d Q_{b}-P d V_{b}+d m_{u} h_{u}+d m_{f b} h_{f}$ (3)
$d U_{u}=d Q_{u}-P d V_{u}-d m_{u} h_{u}$ (4)
The term hu represents the specific enthalpy of unburnt gasses, whereas hf is the specific enthalpy of injected fuel. The product P* Vb is the work done at a given crank angle by the burnt zone.
Three simultaneous equations are obtained when we combine volume constraint and the first law for the unburnt and burnt gases along with the thermal gas equation. The energy equations, along with volume constraints are solved using Genetic Algorithm (GA). The GA when applied repeatedly, will calculate the unburnt and burnt gas pressure and temperatures at each crank angle. The calculated Tu, Tb and P at a given CA can be used to fix the range of pressure and temperature for burnt and unburnt charges for the next CA.
2.1.2 Heat release analysis
In a dual fuel engine, injected fuel exhibits two-stage characteristics represented by premixed combustion and diffusive combustion, irrespective of the operating conditions [29]. The premixed combustion usually occurs in a short period (about 8-12℃A) whereas diffusive combustion that starts simultaneously takes a longer period (50-70℃A). To estimate the rate of combustion for these two overlapping stages, two superposed Wiebe’s function [30] used, as given below:
$\begin{aligned}
&\left(\frac{d q}{d \theta}\right)_{P}= \\
&6.9 * \frac{m_{p}}{\theta_{p}}\left(S_{p}+1\right)\left(\frac{\theta}{\theta_{p}}\right)^{S_{p}} \exp \left[-6.9\left(\frac{\theta}{\theta_{p}}\right)^{S_{p}+1}\right]
\end{aligned}$ (5)
$\begin{aligned}
&\left(\frac{d q}{d \theta}\right)_{d}= \\
&6.9 * \frac{m_{d}}{\theta_{d}}\left(S_{d}+1\right)\left(\frac{\theta}{\theta_{p}}\right)^{S_{d}} \exp \left[-6.9\left(\frac{\theta}{\theta_{d}}\right)^{s_{d}+1}\right]
\end{aligned}$ (6)
The suffix ‘p’ and ‘d’ represents premixed and diffusion combustion parts, ‘S’ represents shape factor, ‘m’ represents mass of pilot fuel consumption and q is the duration of combustion [30]. The entrained gaseous fuel air mixture into the burning zone is subjected to high temperature and pressure, results in combustion of gaseous fuel along with the injected pilot fuel almost simultaneously. The gaseous fuel heat release rate is represented inside the combustion zone represented by the two Wiebe’s functions [30]. The quantity of gaseous fuel ready for combustion is a function of relative proportion of gaseous fuel in the inducted mixture. Total heat release is equal to the sum of the heat released by injected fuel and gaseous fuel at each crank angle.
The experimental setup used in this work consists of a single-cylinder four-stroke water-cooled DI compression ignition engine of Kirloskar make with a rated power of 5.2kW running at 1500 rpm connected to an eddy current dynamometer. Pressure sensors are used to measure combustion gas pressure and fuel injection pressure, and an encoder is fixed for crank angle record. The signals from these sensors are interfaced through a computer to an engine indicator to display P-θ plots. A differential pressure transducer detects the air pressure difference across the orifice for volumetric liquid fuel flow measurement.
The experiments were conducted under different load conditions from no load to full load, in steps of 25% of full load. Both the pilot fuel and the inducted fuel are varied in the correct sequence. The gaseous fuel LPG were varied from 0.2 kg/hr to 0.8 kg/hr in steps of 0.2 kg/hr. As the load increases with fixed LPG flow rate, the engine governor increases pilot fuel injection. Simulations were carried out with the above combinations of operating conditions. The experimental cylinder pressure and simulated pressure were compared for validation purpose.
4.1 Variation of cylinder pressure
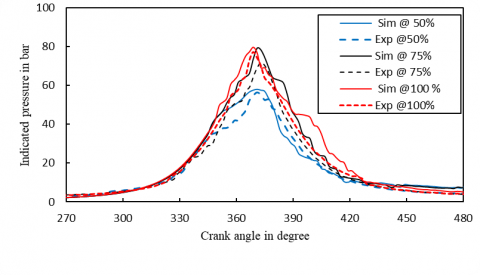
Variation of both simulated and experimental cylinder pressure for a given LPG flow rate of 0.6 kg/hr is shown in Figure 1. Dark lines represent the simulated values and dotted lines represent the experimental values of indicated pressure. Blue, black and red lines showing the engine loading conditions of 50%, 75% and 100% respectively. The trend between the simulated and experimental values being the same with an average error of 12% between them which is acceptable. It is very clear from the plot that with the increase in load, the peak pressure increases. On increasing load with a fixed LPG flow rate, the amount of liquid fuel injected will increase.
Figure 1. Indicated pressure variation with ℃A at LPG flow rate of 0.6 kg/hr
At lower loads, the amount of diesel fuel injected will be less compared to the gaseous fuel. This affects in an increase in delay period due to which the pressure rises per crank angle and the peak pressure will be lower. As the load increases, the amount of pilot fuel increases, increasing the number of ignition spots, resulting in a decrease in delay period. This will further cause an increase in the rate of pressure rise and higher peak pressure in the cycle. At higher loads, peak pressure points slightly advanced compared to lower loads, thus increasing the power output.
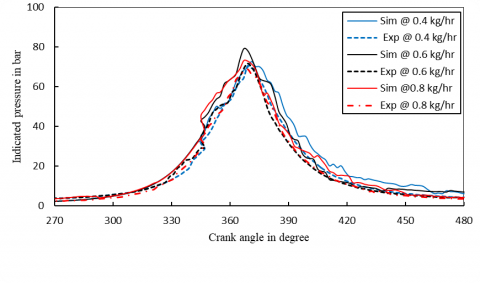
Figure 2 shows the comparison of simulation and experimental cylinder pressures at different flow rates of LPG at 75% load. Various test fuel conditions have been depicted with different colors for identification. It is clear from the graph that predicted pressure is slightly more than that of experimental values in all cases. The deviations are more during the expansion process, which could be due to the assumptions made in simulation like no leakage through the inlet and exhaust valves and no blow by losses.
Figure 2. Indicated pressure variation with ℃A at 75% load
With the increase in LPG flow rate for a given load, the injected fuel will reduce, and hence the LPG air mixture surrounding the injected fuel will be rich in gaseous fuel, causing higher pressure rise rate and peak pressure. The experimental observation was that at a fixed load with an increasing LPG flow rate, the maximum pressure increases until some pilot fuel substitution (about 60%) and then decreases. By increasing the diesel substitution beyond a particular limit result in abnormal combustion. Thus LPG flow rate has to be optimized for the healthy pressure rise and smooth combustion in dual fuel engines. The present study reveals that the peak pressure reached is maximum at 0.6 kg/hr of LPG flow rate.
4.2 Rate of pressure rise
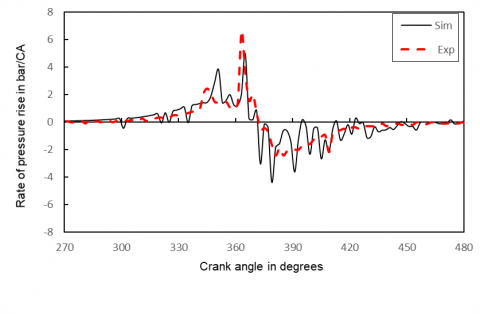
Figure 3 presents the simulated and experimental rate of pressure rise at 0.6 kg/hr LPG flow rate and 75% load. Simulated results have been shown by dark lines whereas experimental values are depicted by dotted lines. The pressure rise rate is less for 0.6 kg/hr, when compared to 0.8 kg/hr of LPG mass flow rate. With the increase in LPG flow rate for a given load, gaseous fuel and air mixture surrounding the injected fuel becomes rich in gaseous fuel, hence it burns more aggressively and beyond some limit, it will start knocking.
Figure 3. Rate pressure rise variation with ℃A at the LPG flow rate of 0.6 kg/hr and 75% Load
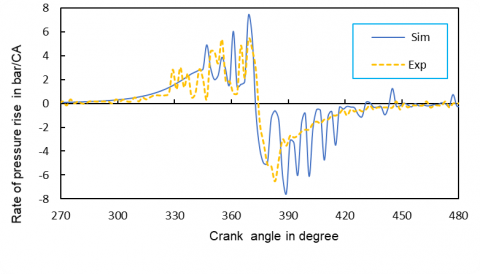
Comparison of Figures 3 & 4 reveals that the peak pressure attained will be delayed due to an increased delay period with a surge of inducted gaseous fuel. As the gaseous fuel proportion increases at any loading conditions, chemical and physical delay increases due to lower Cetane number of the gaseous fuel. It takes additional time in terms of ℃A for auto-ignition as the Cetane number decreases.
Figure 4. Rate pressure rise variation with ℃A at the LPG flow rate of 0.8 kg/hr and 75% Load
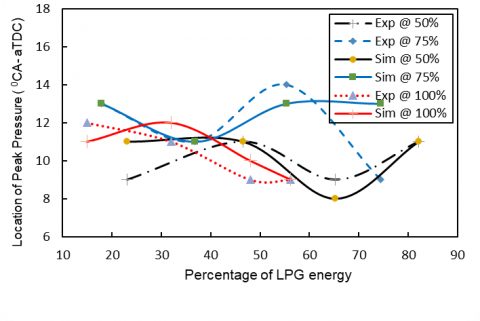
Figure 5 represents the position of peak pressure point under different loads as a function of the percentage of LPG energy. As indicated in the last section, here also simulated results are shown with dark lines and experimental variation is shown by dotted lines. At 75% of full load, as the percentage of LPG energy increases, the highest pressure point initially moves towards TDC. After a particular percentage of LPG energy, it starts to move away from TDC.
Figure 5. Variation of peak pressure point with percentage of LPG energy for different loads
With the increase in LPG energy, the delay period rises, an additional amount of fuel burns in the premixed combustion stage. After a certain percentage of liquid fuel replacement by LPG, active ignition was not sustained because of the substantial increase in the delay period.
4.3 Heat release rate
Total heat released is the sum of heat released during premixed condition and diffusion phase of combustion. The two influencing parts of the entire heat release have been analyzed separately.
4.3.1 Premixed stage
Figure 6 represents the heat release rate during premixed stage for 0.8 kg/hr LPG flow rate with dark lines representing the simulated and dotted representing the experimental conditions. The different loading percentages are shown by the various colors. For a fixed LPG flow rate with the increase in load, the diesel fuel injected increases which help in better entrainment of gaseous fuel and hence combustion. Consequently, it will result in a higher rate of heat release in the premixed stage of combustion.
Figure 6. Pre-mixed heat release rate variation with ℃A for 0.8 kg/hr of LPG flow rate
As the LPG flow rate increases at a given load, the quantity of diesel fuel injected deceases and results in poor entrainment of gaseous fuel. Hence, a lesser amount of LPG burns in the premixed stage and an overall reduction in heat release rate. Therefore, more amount of fuel is carried to the diffusion phase of combustion. This reduces the heat released at higher LPG flow rates. The simulated and experimental results show that LPG flow rate of 0.6 kg/hr at around 75% load conditions, engine performance is optimum.
4.3.2 Diffusion stage of combustion
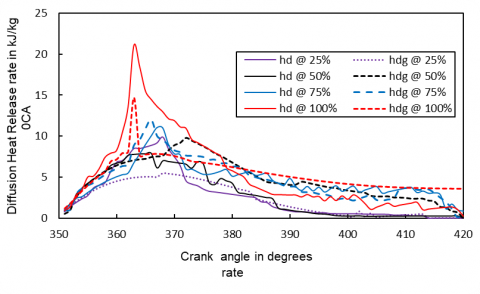
Variation of diffusion heat released with different loads for the LPG flow rate of 0.8 kg/hr, both simulation and experimental, is shown in Figure 7. The advancement of combustion initiated by the injected pilot fuel will be just like in SI engine at many spots. At low LPG flow rates, the rate of heat released during the diffusion stage of combustion is low. As the LPG flow rate and pilot fuel injection rate increases, the heat released in the diffusion phase also increases. The swirl is less at lower loads; however, as the engine load is increased, the swirl also increases. An increase in swirl enhances the mixing and hence heat released in the diffusion stage increases. For higher LPG flow rates, due to the higher quantity of gaseous fuel, initiation of combustion will be delayed, which releases most of the energy in the diffusion stage. Both the experimental and simulated results justify the same with slight deviations at higher loads.
Figure 7. Diffusion heat release rate variation with ℃A for 0.8 kg/hr LPG flow rate
4.4 Total heat release rate
Total heat release for 0.6 kg/hr of LPG flow rate and at different loading conditions are depicted in Figure 8 for both experimental and simulated conditions. For a given LPG flow rate, increase in engine load will increase the total heat released and peak heat release occurs nearer to TDC. As load increases, the quantity of diesel injected increases, resulting in better entrainment of the air and LPG mixture and reduced delay period. A reduced delay period initiates early combustion, and hence peak heat release will occur close to TDC ensuring higher engine output.
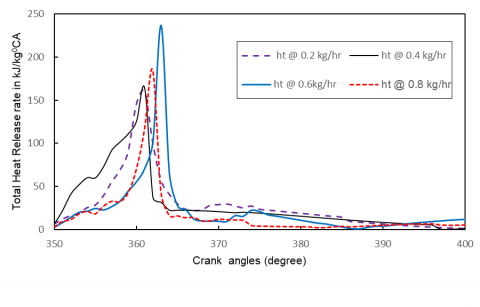
Figure 9 shows the total heat release for an engine loading of 75% under different LPG flow rates with each color representing the different LPG flow rates tested. As the LPG flow rate increases from 0.2 kg/hr to 0.8kg/hr, the heat release rate increases, and the peak heat release point shifts towards the right side. This clearly indicates that more amount of fuel burns during the diffusion phase of combustion. In the present study, it has been observed that 0.6 kg/hr is the optimum value for which the engine performance will be better with a higher heat release rate. The simulated results for total heat release at different operating conditions are compared with the experimental results, found good agreement between them. Thus, the validation results justify that, the use of the developed combustion model for dual fuel engines helps to predict the total heat release accurately.
Figure 8. Total heat release rate variation with ℃A for 0.6 kg/hr LPG flow rate
Figure 9. Total heat release rate variation with ℃A at 75% Load for different LPG flow rates
4.5 Cumulative heat release rate
The cumulative heat release for an LPG flow rate of 0.4 kg/hr is shown in Figure 10.
Figure 10. Variation of cumulative total heat release with ℃A for 0.4 kg/hr LPG flow rate
The plot depicts a sharp rise in heat release during starting, and afterward the rise in the heat release decreases. At higher loads, about 65-68% of the total heat is released during the first 12-15° crank rotation, but at lower loads, the value is slightly higher. Predicted results are very close to the results from the earlier literature [31, 32]. Hence, it can be concluded that the developed combustion model for the CI engine running under dual fuel mode using LPG-diesel combination can and predict the thermal performance parameters with reasonably good accuracy. This type of combustion model supports the extension of various innovative designs and optimization of various parameters for LPG-diesel combinations.
The developed two-zone combustion model for LPG –diesel dual fuel engine could predict combustion characteristics such as rate of pressure rise, heat release rate, attainment of peak pressure etc., with acceptable accuracy. The simulation outputs are validated with the experimental results carried out in dual fuel engine under identical conditions. Results can be summarized as follows:
Thus, the prediction model is useful for researchers in early predicting the combustion characteristics for the LPG-based dual fuel engine without conducting exhaustive experiments, which will save considerable resources.
|
LPG |
Liquified petroleum gas |
|
CA |
Crank angle (°) |
|
CNG |
Compressed natural gas |
|
BTE |
Brake thermal efficiency (%) |
|
BSFC |
Brake specific fuel consumption(kg/Kwh) |
|
TDC |
Top dead center |
|
P-θ |
Pressure –crank angle |
[1] Karim, G.A. (1983). The dual fuel engine of the compression ignition type-prospects, problems and solutions-a review. SAE Transactions, 92: 569-577.
[2] Galal, M.G., Aal, M.A., El Kady, M.A. (2002). A comparative study between diesel and dual-fuel engines: Performance and emissions. Combustion Science and Technology, 174(11-12): 241-256. https://doi.org/10.1080/713712964
[3] Ma, B., Yao, A., Yao, C., Wang, B., Gao, J., Chen, C., Wu, T. (2019). Experimental study on energy balance of different parameters in diesel methanol dual fuel engine. Applied Thermal Engineering, 159: 113954. https://doi.org/10.1016/j.applthermaleng.2019.113954
[4] Chen, H., Zhang, P., Liu, Y. (2018). Investigation on combustion and emission performance of a common rail diesel engine fueled with diesel-ethylene glycol dual fuel. Applied Thermal Engineering, 142: 43-55. https://doi.org/10.1016/j.applthermaleng.2018.06.073
[5] Sudhir, C.V., Desai, V., Suresh Kumar, Y., Mohanan, P. (2003). Studies on influence of injection timing and diesel replacement on LPG-diesel dual-fuel engine. In Internal Combustion Engine Division Fall Technical Conference, 41618: 161-166. https://doi.org/10.1115/ICEF2003-0719
[6] Castro, N., Toledo, M., Amador, G. (2019). An experimental investigation of the performance and emissions of a hydrogen-diesel dual fuel compression ignition internal combustion engine. Applied Thermal Engineering, 156: 660-667. https://doi.org/10.1016/j.applthermaleng.2019.04.078
[7] Ganesan, S., Ramesh, A. (2002). Experimental investigations on a LPG-diesel dual fuel engine. Journal of the Institution of Engineers(India), Part MC, Mechanical Engineering Division, 83(3): 105-111.
[8] Barbour, T.R., Crouse, M.E., Lestz, S.S. (1986). Gaseous fuel utilization in a light-duty diesel engine. SAE Transactions, 26-44.
[9] Papagiannakis, R.G., Hountalas, D.T. (2004). Combustion and exhaust emission characteristics of a dual fuel compression ignition engine operated with pilot diesel fuel and natural gas. Energy Conversion and Management, 45(18-19): 2971-2987. https://doi.org/10.1016/j.enconman.2004.01.013
[10] Poonia, M.P., Bhardwaj, A., Jethoo, A.S., Pandel, U. (2011). Experimental investigations on engine performance and exhaust emissions in an LPG diesel dual fuel engine. International Journal of Environmental Science and Development, 2(6): 418.
[11] Kumar, M.S., Ramesh, A., Nagalingam, B. (2003). Use of hydrogen to enhance the performance of a vegetable oil fuelled compression ignition engine. International Journal of Hydrogen Energy, 28(10): 1143-1154. https://doi.org/10.1016/S0360-3199(02)00234-3
[12] Sharma, M., Kaushal, R. (2020). Performance and emission analysis of a dual fuel variable compression ratio (VCR) CI engine utilizing producer gas derived from walnut shells. Energy, 192: 116725. https://doi.org/10.1016/j.energy.2019.116725
[13] Chintala, V., Subramanian, K.A. (2017). Experimental investigation of autoignition of hydrogen-air charge in a compression ignition engine under dual-fuel mode. Energy, 138: 197-209. https://doi.org/10.1016/j.energy.2017.07.068
[14] Sharma, A., Ansari, N.A., Pal, A., Singh, Y., Lalhriatpuia, S. (2019). Effect of biogas on the performance and emissions of diesel engine fuelled with biodiesel-ethanol blends through response surface methodology approach. Renewable Energy, 141: 657-668. https://doi.org/10.1016/j.renene.2019.04.031
[15] Jayachandran K., Manoharan N. (2000). Simulation of combustion processes in compression ignition engines. Proceedings of the XVI National Conference on IC Engine and Combustion, p. 429.
[16] da Cruz, A.P., Baritaud, T., Poinsot, T. (1999). Turbulent self-ignition and combustion modeling in diesel engines. SAE Transactions, 1654-1663.
[17] Liu, Y., Midkiff, K.C., Bell, S.R. (2004). Development of a multizone model for direct injection diesel combustion. International Journal of Engine Research, 5(1): 71-81.
[18] Thyagarajan, V., Babu, M.G. (1985). A combustion model for a dual fuel direct injection diesel engine. In Proceedings of COMODIA Symposium on Diagnostics and Modelling of Combustion in Reciprocating Engines, Tokyo, 607.
[19] Mbarawa, M., Milton, B.E., Casey, R.T. (2001). Experiments and modelling of natural gas combustion ignited by a pilot diesel fuel spray. International Journal of Thermal Sciences, 40(10): 927-936. https://doi.org/10.1016/S1290-0729(01)01279-0
[20] Mansour, C., Bounif, A., Aris, A., Gaillard, F. (2001). Gas–diesel (dual-fuel) modeling in diesel engine environment. International Journal of Thermal Sciences, 40(4): 409-424. https://doi.org/10.1016/S1290-0729(01)01223-6
[21] Karim, G.A., Liu, Z. (1992). A predictive model for knock in dual fuel engines (No. 921550). SAE Technical Paper. https://doi.org/10.4271/921550
[22] Ahmad, N., Babu, M.G., Ramesh, A. (2005). Experimental Investigations of different parameters affecting the performance of a CNG-diesel dual fuel engine. SAE Transactions, 1620-1629.
[23] Liu, S.H., L., Hwang, J.W., Park, J.K., Kim, M.H., Chae, J.O. (1999). Multizone model for DI Diesel engine combustion and emissions (No. 1999-01-2926). SAE Technical Paper. https://doi.org/10.4271/1999-01-2926
[24] Najafi, B., Akbarian, E., Lashkarpour, S.M., Aghbashlo, M., Ghaziaskar, H.S., Tabatabaei, M. (2019). Modeling of a dual fueled diesel engine operated by a novel fuel containing glycerol triacetate additive and biodiesel using artificial neural network tuned by genetic algorithm to reduce engine emissions. Energy, 168: 1128-1137. https://doi.org/10.1016/j.energy.2018.11.142
[25] Park, S., Cho, J., Park, J., Song, S. (2017). Numerical study of the performance and NOx emission of a diesel-methanol dual-fuel engine using multi-objective Pareto optimization. Energy, 124: 272-283. https://doi.org/10.1016/j.energy.2017.02.029
[26] Zhou, D., Yang, W., Zhao, F., Li, J. (2017). Dual-fuel RCCI engine combustion modeling with detailed chemistry considering flame propagation in partially premixed combustion. Applied Energy, 203: 164-176. https://doi.org/10.1016/j.apenergy.2017.06.021
[27] Dent, J.C., Mehta, P.S. (1981). Phenomenological combustion model for a quiescent chamber diesel engine. SAE Transactions, 3884-3902.
[28] Thyagarajan, V., Babu, M.G. (1985). A combustion model for a dual fuel direct injection diesel engine. In Proceedings of COMODIA Symposium on Diagnostics and Modelling of Combustion in Reciprocating Engines, Tokyo, 607. https://doi.org/10.4271/750468
[29] Olikara, C., Borman, G.L. (1975). A computer program for calculating properties of equilibrium combustion products with some applications to IC engines (No. 750468). SAE Technical Paper.
[30] Miyamoto, N., Chikahisa, T., Murayama, T., Sawyer, R. (1985). Description and analysis of diesel engine rate of combustion and performance using Wiebe's functions. SAE Transactions, 622-633.
[31] Liu, Z., Karim, G.A. (1997). Simulation of combustion processes in gas-fuelled diesel engines. Proceedings of the Institution of Mechanical Engineers, Part A: Journal of Power and Energy, 211(2): 159-169. https://doi.org/10.1243/0957650971537079
[32] Nemser, S., Stookey, D., Nelson, J. (2003). Diesel engine NOx reduction via nitrogen-enriched air. In American Filtration and Separation Society Meeting.