Yufei Song | Zhiguo Liu* | Shiwu Li | Qingyong Jin
© 2021 IIETA. This article is published by IIETA and is licensed under the CC BY 4.0 license (http://creativecommons.org/licenses/by/4.0/).
OPEN ACCESS
With the development of high-performance chips, the heat flux of Internet datacenter (IDC) is on the rise, and heat dissipation becomes a major bottleneck of IDC development. The cooling needs of the IDC room can hardly be met by the traditional method of air cooling. In recent years, immersion liquid cooling has attracted a growing attention, due to its excellent performance. This paper designs and optimizes an immersion liquid cooling system for IDC. Multiple numerical simulations were carried out to analyze the influence of the system parameters on heat dissipation, and improve the system efficiency using a dielectric coolant. Specifically, 20 graphics processing units (GPUs) and 2 central processing units (CPUs) were set up in each machine of the liquid cooling server. Then, the GPU and CPU temperature was examined under different opening positions on the server top plate, inlet coolant temperatures, and coolant flow speeds. The results show that a 30mm-wide, 430mm-long opening should be set at the upper part of the GPU array, 20mm away from the top plate. The cooling effect can be optimized at the inlet temperature of 30℃, and the coolant flow speed of 3m3/h.
internet datacenter (IDC), immersion liquid cooling, numerical simulation
The emergence of various high and new techniques, namely, big data, cloud computing, artificial intelligence (AI), and 5G, heralds the dawn of the new era of digitization. The rapid development of these techniques is inseparable from the strong support of Internet datacenter (IDC), an information center with high energy consumption. In the IDC, there are many energy consumers, including information equipment, cooling system, and power supply and distribution system. Among them, the leading consumer is the cooling system responsible for cooling electronic equipment. More than 38% of the total energy consumption of the IDC are attributable to the cooling system [1]. Each year, the cooling system consumes a lot of power, pushing up the operation and maintenance costs of the IDC. The high energy consumption has become a major obstacle of IDC development. IDC designers are faced with the challenging task of reducing energy consumption of the IDC, especially that of the cooling system.
Currently, air cooling is the dominant mode of IDC cooling system [2-4]. During the application, the cold air outdoor is introduced to naturally cool down the IDC. There are three types of air-cooling methods: direct natural cooling, indirect natural cooling, and evaporative cooling. Direct natural cooling directly uses outdoor cold air for cooling [1]. This technique has been successfully applied in many countries and regions. For example, Yahoo adopted direct natural cooling for its datacenter in New York, and achieved a power usage effectiveness (PUE) of 1.08.
Indirect natural cooling utilizes outdoor cold air with the aid of heat exchangers, so that the datacenter is not disturbed by the external environment. Evaporative cooling produces cold air by the principle of water evaporation. Any of these air-cooling techniques is limited by the small specific heat of the air, and the inefficient heat transfer through convection. The high air flow required by convection reduces the energy utilization. To overcome the limitation of air cooling, liquid cooling came into being. Liquid cooling was initially used in the aerospace to dissipate the heat of satellites and rocket engines.
With the growing density of computer chips and complexity of computing tasks, the heat load of information technology (IT) equipment rises steadily. The capacity of air cooling in IDC room quickly approaches its limit. Based on air cooling, the traditional air conditioning (AC) system can no longer effectively cool down the high-density IDC room. To solve the problem, the IDC industry turns to liquid cooling for help. More and more datacenters have employed liquid cooling techniques. Liquid cooling boasts obvious advantages over air cooling. Unlike the air, liquid tends to have a large specific heat capacity, a premise of high energy efficiency [5, 6].
Excessive temperature is a major cause of the failure of the sever and other electronic equipment of datacenters [7]. The allowable working temperature for chips is generally below 70℃. Once the ambient temperature surpasses this threshold, each 2℃ of temperature rise will reduce the chip reliability by 10% [8]. The efficiency and stability of the server and chips can be guaranteed through liquid cooling. Besides, liquid cooling, as an environmentally friendly technique, can also save energy, lower cost, and reduce noise [9].
Liquid cooling is not simply water cooling. For the IDC, any technique that dissipates the heat of equipment with liquid with high specific heat capacity as the transmission medium falls into the realm of liquid cooling. At present, liquid cooling can be deployed in three different modes: immersion, cold plate, and spraying. Immersion liquid cooling, a typical direct contact technique, immerses the hot electronic components in the cold medium (coolant), and takes away the heat by the circulating liquid flow. Since the components directly contact the coolant, immersion liquid cooling is more efficient and less noisy than the other two modes.
Levin et al. reviewed the design of reconfigurable computer system using liquid cooling, summarized the structure, location, and technical features of immersion cooling, examined the design of main technical solutions and their prototypes, and tested the next generation computing modules [10, 11]. Shah et al. [12] explored influence of mineral oil immersion cooling on equipment reliability and compatibility, and observed how mineral oil alters the mechanical and chemical properties of IT equipment materials, such as polyvinyl chloride, printed circuit board, and switching devices.
Eiland et al. operated a single server completely immersed in mineral oil, and changed the volumetric flow and oil inlet temperature [13, 14]. The results show that the maximum oil inlet temperature of 45℃ can be used for cooling. At this time, the coolant flow was 1.5 liters per minute (lpm), and the central processing unit (CPU) temperature was maintained at 74℃. It can be calculated that the PUE reached the minimum of 1.03. Wagner et al. [15] compared the cooling performance of three liquid cooling techniques, including single-phase cold plate, two-phase immersion cooling using 3M Novec 649, and single-phase immersion cooling using mineral oil. The comparison shows the single-phase cold plate consumed the most power and achieved the lowest thermal resistance (0.048k/W), followed in turn by two-phase immersion cooling using 3M Novec 649, and single-phase immersion cooling using mineral oil.
Overall, the current research on liquid cooling mainly focuses on testing specific coolants or comparing different immersion liquid cooling techniques. When it comes to IDC cooling, the application of liquid cooling faces three major challenges:
(1) The coolants of immersion liquid cooling are too expensive. For example, 3M’s fluoroethers (Novec7100, FC-3283, and FC-40) must be imported at high prices.
(2) The solution level varies significantly with immersion liquid cooling systems. In the two-phase immersion liquid cooling system, the fluorinated electronic liquid will escape easily after evaporating into gaseous state. To prevent the escape, the system must meet a high sealing standard. However, the cooling system cannot be sealed completely to prevent cylinder explosion. This calls for additional safety facilities.
(3) The liquid cooling scenarios are not considered fully in server design. The mainstream servers are designed for the traditional scheme of room refrigeration. Before applying immersion liquid cooling, it is necessary to customize the server structure carefully.
To solve the above problems, this paper designs and optimizes a single-phase immersion liquid cooling system for IDC. A special liquid coolant was prepared, and integrated with the cabinet into one machine. To improve the cooling performance of the system, numerical simulations were carried out to optimize the relevant parameters.
Immersion liquid cooling is technically capable of cooling datacenters with a high heat flux. But its application to these datacenters is bottlenecked by the high cost of coolant and heavy investment. This paper synthetizes special materials into a new coolant for immersion liquid cooling of the IDC room. The coolant boasts advantages like excellent oxidation resistance, ultra-high heat conduction efficiency, and low volatility.
In terms of physical features, the proposed coolant has three advantages over the existing coolants:
(1) Our coolant has higher specific heat capacity, better heat conduction performance, and higher efficiency than the existing coolants. The specific heat capacity of our coolant is about 2.3kJ/kg·K, while that of imported coolants (e.g., Novec 7100) is around 1.18kJ/kg·K.
(2) The density of our coolant is 804.3kg/m3 at 20℃, almost half of that (1,400kg/m3) of Novec 7100. Under the same volume, our coolant has lighter mass and less liquid input than imported coolants. The relatively low density brings a light weight, which reduces the cost of load-bearing reinforcement of the IDC room.
(3) The static compliance (CST) of our coolant is merely 9.62 at 40℃. The low CST, coupled with the ultra-high heat conduction efficiency, ensures that the coolant can dissipate heat quickly, enabling the datacenter to operate more efficiently.
There are many other strengths of our coolant: the price is one sixth of 3M’s fluoroethers; it does not volatilize at 40℃, releasing no volatile organic compound (VOC). The greenness of our coolant increases the probability of passing environmental protection evaluation, and reduces the investment of environmental protection devices during IDC room construction.
During immersion liquid cooling, the hot electronic components is immersed in the coolant, and their heat is transferred via convection. Then, the heat of the coolant is exported in the external refrigeration system [16-18].
Single-phase immersion liquid cooling is a technique that can effectively cool down high heat flux components in the IDC, thereby saving energy and protecting the environment. Therefore, this paper firstly adopts the single-phase coolant for immersion liquid cooling [19, 20]. The liquid is pumped to the heat exchanger to remove heat. The single-phase coolant neither change phase nor evaporate into the air. The single-phase immersion liquid cooling system is illustrated in Figure 1.
The cost of single-phase coolant is one order of magnitude lower than that of two-phase coolant. Since the single-phase coolant does not evaporate into the air, there is no need to seal up the cooling system to recapture the evaporated liquid. As a result, it is easy to uninstall and maintain the cooling system, or replace the server components to be cooled.
The following are the advantages of the single-phase immersion liquid cooling system:
(1) The liquid coolant can take away 3,000 times more heat than the same volume of the air.
(2) The cooling system transfers heat 25 times faster than the air.
(3) The cooling system produces a 10-15dBA smaller noise than the air-cooling system, while dissipating the same amount of heat.
(4) The cooling system saves more than 30% power than the air-cooling system.
(5) The cooling system supports 24/7 natural cooling.
Figure 1. Single-phase immersion liquid cooling system
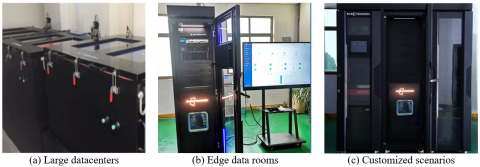
Figure 2. Integrated cabinets designed for different scenarios
(6) The cooling system reduces energy consumption by 90%, eliminating the need for compressor or other components.
(7) The cooling system can improve the cluster performance by 5%, and cool down the CPU temperature by 40-50℃.
The liquid coolant was integrated with the cabinet into one machine, such that the heat carrying liquid is in direct contact with the heating device. This integrated design increases the efficiency of heat exchange, and ensures the comprehensiveness of natural cooling. The PUE of the system was smaller than 1.05. Besides, the integration reduces the floor area occupied by the system. There is no need for decoration, flooring, and other cost-incurring items.
The system design fully integrates various subsystems, ranging from uninterrupted power supply (UPS), power distribution, fire protection, wiring, air flow suppression, to intelligent monitoring. All subsystems are managed generally through the monitoring system. The overall management helps to streamline the system, and simplify the process of design, procurement, and construction. In addition, the monitoring system supports both local and remote monitoring and management. Multiple outlets can be connected to the upper management platform, enabling unified supervision, and supporting diversified selections.
The immersion liquid cooling improves the energy efficiency of the whole machine, cuts down the operating cost, and lowers the total cost of ownership (TCO). Any equipment failure can be handled timely through one-step after service. Under the full immersion mode, the server has a uniform internal temperature field, which assures the reliability of the device.
To mitigate the leakage risk, the cooling liquid is insulated and green. Even if a leakage occurs, there will be no threat to the hardware and the external environment. In terms of noise control, liquid cooling can take away the heat from all components of the server, eliminating the need for internal fans. Thus, the noise of full load operation is reduced to less than 45dBA.
The above design significantly increases the power density of the server. The power density of a single cabinet can surpass 60kW. Figure 2 shows the integrated cabinets designed for different scenarios.
The numerical simulation was carried out using Ansys Fluent. The flow was considered as a three-dimensional (3D) steady-state flow. Apart from density, the fluid properties of the coolant were fixed, and the buoyancy effect was taken into account. For simplicity, several assumptions were put forward: the flow is a 3D steady-state incompressible turbulent flow; the thermal radiation is negligible; the heat dissipation induced by the viscous force of the fluid is negligible.
According to these assumptions and the laws of conservation of mass, momentum, and energy, the governing equations for the flow and heat transfer in the cabinet can be established as:
$\frac{\partial(\rho u)}{\partial x}+\frac{\partial(\rho v)}{\partial y}+\frac{\partial(\rho w)}{\partial z}=0$ (1)
where, ρ is density; u, v, and w are the speed in the x, y, and z directions, respectively.
Then, the momentum in the x direction can be expressed as:
$\begin{aligned}
\frac{\partial(\rho u u)}{\partial x} &+\frac{\partial(\rho u v)}{\partial y}+\frac{\partial(\rho u w)}{\partial z} \\
&=\frac{\partial p}{\partial x}+\mu\left(\frac{\partial^{2} u}{\partial x^{2}}+\frac{\partial^{2} u}{\partial y^{2}}+\frac{\partial^{2} u}{\partial z^{2}}\right)
\end{aligned}$ (2)
The momentum in the y direction can be expressed as:
$\begin{aligned}
\frac{\partial(\rho v u)}{\partial x} &+\frac{\partial(\rho v v)}{\partial y}+\frac{\partial(\rho v w)}{\partial z} \\
&=\frac{\partial p}{\partial y}+\mu\left(\frac{\partial^{2} v}{\partial x^{2}}+\frac{\partial^{2} v}{\partial y^{2}}+\frac{\partial^{2} v}{\partial z^{2}}\right)
\end{aligned}$ (3)
The momentum in the z direction can be expressed as:
$\begin{aligned}
\frac{\partial(\rho w u)}{\partial x} &+\frac{\partial(\rho w v)}{\partial y}+\frac{\partial(\rho w w)}{\partial z} \\
&=\frac{\partial p}{\partial z}+\mu\left(\frac{\partial^{2} w}{\partial x^{2}}+\frac{\partial^{2} w}{\partial y^{2}}+\frac{\partial^{2} w}{\partial z^{2}}\right)-\rho g
\end{aligned}$ (4)
where, u is the dynamic viscosity of the fluid; p is pressure; g is gravitational acceleration.
The energy equation of the coolant fluid can be expressed as:
$\begin{array}{r}
\rho C_{p}\left(u \frac{\partial T_{f}}{\partial x}+v \frac{\partial T_{f}}{\partial y}+w \frac{\partial T_{f}}{\partial z}\right) \\
=\lambda\left(\frac{\partial^{2} T_{f}}{\partial x^{2}}+\frac{\partial^{2} T_{f}}{\partial y^{2}}+\frac{\partial^{2} T_{f}}{\partial z^{2}}\right)
\end{array}$ (5)
where, Tf is the fluid temperature; λ is the thermal conductivity of the fluid; Cp is the specific heat capacity of the fluid.
The energy equation in solids can be expressed as:
$k\left(\frac{\partial^{2} T_{s}}{\partial x^{2}}+\frac{\partial^{2} T_{s}}{\partial y^{2}}+\frac{\partial^{2} T_{s}}{\partial z^{2}}\right)=0$ (6)
where, k is the thermal conductivity of the solids; Ts is the temperature of the solids.
The realizable k-epsilon (k-$\mathcal{E}$) model was selected as the turbulence model, because of the large Reynolds number (RE) of the inlet pipe, the turbulent state of the flow, and the complex flow field in the cabinet.
4.1 Cabinet meshing
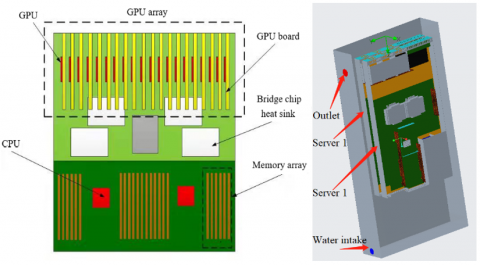
Figure 3. Distribution of components
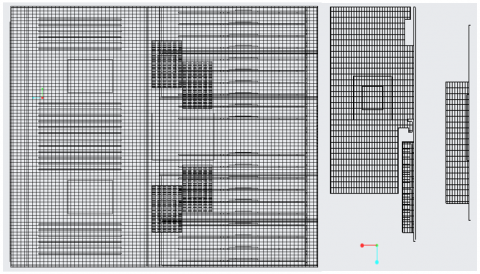
Figure 4. Mesh generation model
As shown in Figure 3, each machine of the liquid cooling server consists of 20 graphics processing units (GPUs) and 2 CPUs. Repeated tests show that the server can be deployed into the integrated cabinet.
The meshing was performed on Ansys ICME. Considering the complexity of the whole cabinet, the unstructured tetrahedral grids were selected for meshing. The grid density was increased in local places. Figure 4 shows the mesh generation model.
To simulate the fluid accurately, the grids of the server and some components were configured on Ansys ICME. The generated model has a total of 609,125 grids, including 407,718 fluid grids, 201,407 grids, and 177,935 fluid-solid interface grids. The dense grids ensure the data accuracy.
4.2 Influence of opening position on GPU temperature
The mean temperature of the GPU array was tested with the opening being 20mm, 40mm, 60mm, 80mm and 100mm away from the top plate of the server, respectively. As shown in Figure 5, the mean temperature of the GPU array was 44.7℃, 44.6℃, 44.7℃, 44.8℃, 44.9℃, and 45.1℃, respectively. As the distance from the opening to the top plate increased, the mean temperature of the GPU array gradually rose, a sign of the slow decline of heat dissipation effect. When the distance was 20mm, the mean temperature of the GPU array reached the minimum. Thus, the flow field of the GPU array at this position is the most reasonable. As a result, the server opening should be arranged at the upper part of the GPU array, 20mm from the top plate. The opening is 30mm wide and 430mm long.
Figure 5. Influence of opening position on GPU temperature
4.3 Influence of coolant settings on GPU temperature
(1) Influence of coolant temperature on GPU temperature
To demonstrate the influence of coolant temperature, GPU temperature was measured by two variables: the mean of GPU temperature, and the standard deviation of GPU temperature under the same working condition. The former reflects the cooling effect, and the latter mirrors the uniformity of GPU temperature distribution. The two variables are negatively correlated with each other.
(a) Mean
(b) Standard deviation
Figure 6. Influence of coolant temperature on GPU temperature
The inlet flow was set to 1m³/ h, and the inlet temperature was set to 30℃, 35℃, 40℃, 45℃, and 50℃ in turn. Then, a simulation was carried out to study the influence of the inlet temperature of the coolant over the temperature of the high heat flux components of the server. As shown in Figure 6, with the increase of the inlet temperature, both the mean and standard deviation of GPU temperatures exhibited an upward trend. As the inlet temperature rose from 30℃ to 50℃, the mean GPU temperature stood at 44.7℃, 49.6℃, 54.6℃, 59.6℃, and 64.6℃ respectively; the standard deviations were measured as 0.296, 0.303, 0.307, 0.3104, and 0.3101 respectively. The simulation data show that the GPU cooling effect was optimized at the inlet temperature of 30℃.
(2) Influence of coolant flow speed on GPU temperature
In the above simulation, the GPU temperature reached a dangerous range, when the inlet coolant temperature rose to 50℃. This inlet temperature was adopted, and the coolant flow speed at the inlet was increased to simulate the change of GPU temperature.
As shown in Figure 7, when the inlet flow changed from 1m3/h to 4m3/h, the mean GPU temperature stood at 64.6℃, 62.6℃, 61.7℃, and 61.0℃ respectively, and the standard deviations were measured at 0.310, 0.219, 0.213, and 0.229, respectively. Overall, the mean GPU temperature declined with the increase of flow, while the standard deviation minimized at the flow of 3m3/h, and slightly increased at the flow of 4m3/h. With the growth in the inlet coolant flow speed, the heat dissipation effect of GPUs improved, and the temperature difference of each GPU decreased. However, once the flow speed reached a certain level, the temperature became uniformly distributed, for the flow field is changed by the coolant flow speed.
(a) Mean
(b) Standard deviation
Figure 7. Influence of coolant flow speed on GPU temperature
4.4 Influence of coolant settings on CPU temperature
Figure 8. Influence of coolant temperature on CPU temperature
Figure 9. Influence of coolant flow speed on CPU temperature
The temperature of CPUs, as another major component with a high heat flux in the server, also deserves attention.
(1) Influence of coolant temperature on CPU temperature
Figure 8 shows the trend of CPU temperature with coolant temperature. As the inlet coolant temperature increased, the temperature of CPU-1 changed from 66.6℃, 70.3℃, 74.8℃, 78.9℃, to 84.3℃, and the temperature of CPU-2 changed from 58.6℃, 63.1℃, 67.3℃, 72.6℃, to 77.39℃.
The two CPUs had a temperature difference of about 8℃. This is because the inlet of the coolant is on the left of the immersion tank. Under the action of inertia, the fast-flowing coolant first reaches the rightmost side of the tank. Therefore, more coolants flow through CPU-2 on the right.
(2) Influence of coolant flow speed on CPU temperature
Figure 9 shows the temperature distribution of CPUs with growing coolant flow speed. It can be observed that the temperatures of both CPU-1 and CPU-2 gradually decreased, but at an increasingly slow speed. The temperature of CPU-1 dropped from 84.3℃ at the highest to 64.4℃, and the temperature of CPU-2 fell from 77.4℃ at the highest to 63.1℃. Owing to the increase of flow speed, the heat exchange effect is enhanced, causing the temperature difference between the CPUs to decline. However, when the flow speed grew from 3m3/h to 4m3/h, the temperature difference widened, for the fast flow speed changes the flow field.
Overall, the mean temperature of CPUs decreased with the increase of flow speed, but the decreasing rate slowed down. This means the impact of flow on CPU decreases gradually. In a certain range, a faster flow leads to a smaller standard deviation of CPU temperature, and a more uniform distribution of temperature across the CPUs. Yet, when the flow speed reaches a certain level, the flow field will be disrupted, causing the standard deviation to increase, and the temperature distribution to become less uniform.
This paper designs a server cabinet that integrates 20 GPUs and 2 CPUs. Several simulations were carried out to disclose how the opening position on server top plate affects the heat dissipation, how the inlet coolant temperature influences CPU and GPU temperature, and how coolant flow speed impacts CPU and GPU temperature. Based on the temperature distribution inside the server under various conditions, the liquid inlet and outlet of the coolant can be positioned, the opening of the top plate can be located, and the temperature and flow speed of the coolant can be optimized. In this way, the proposed integrated cooling system can achieve efficient and reliable operation.
[1] Cho, J., Lim, T., Kim, B.S. (2012). Viability of datacenter cooling systems for energy efficiency in temperate or subtropical regions: Case study. Energy and Buildings, 55: 189-197. https://doi.org/10.1016/j.enbuild.2012.08.012
[2] Chu, W.X., Wang, C.C. (2019). A review on airflow management in data centers. Applied Energy, 240: 84-119. https://doi.org/10.1016/j.apenergy.2019.02.041
[3] Cho, J., Yang, J., Park, W. (2014). Evaluation of air distribution system's airflow performance for cooling energy savings in high-density data centers. Energy and Buildings, 68: 270-279. https://doi.org/10.1016/j.enbuild.2013.09.013
[4] Chu, W.X., Hsu, C.S., Tsui, Y.Y., Wang, C.C. (2019). Experimental investigation on thermal management for small container data center. Journal of Building Engineering, 21: 317-327. https://doi.org/10.1016/j.jobe.2018.10.031
[5] Kheirabadi, A.C., Groulx, D. (2018). Experimental evaluation of a thermal contact liquid cooling system for server electronics. Applied Thermal Engineering, 129: 1010-1025. https://doi.org/10.1016/j.applthermaleng.2017.10.098
[6] Almoli, A., Thompson, A., Kapur, N., Summers, J., Thompson, H., Hannah, G. (2012). Computational fluid dynamic investigation of liquid rack cooling in data centres. Applied Energy, 89(1): 150-155. https://doi.org/10.1016/j.apenergy.2011.02.003
[7] Iwasaki, H., Ishizuka, M. (2000). Forced convection air cooling characteristics of plate fins for notebook personal computers. ITHERM 2000. The Seventh Intersociety Conference on Thermal and Thermomechanical Phenomena in Electronic Systems (Cat. No. 00CH37069), Las Vegas, NV, USA, pp. 21-26. https://doi.org/10.1109/ITHERM.2000.866165
[8] Haywood, A.M., Sherbeck, J., Phelan, P., Varsamopoulos, G., Gupta, S.K. (2015). The relationship among CPU utilization, temperature, and thermal power for waste heat utilization. Energy Conversion and Management, 95: 297-303. https://doi.org/10.1016/j.enconman.2015.01.088
[9] Lee, Y.J., Singh, P.K., Lee, P.S. (2015). Fluid flow and heat transfer investigations on enhanced microchannel heat sink using oblique fins with parametric study. International Journal of Heat and Mass Transfer, 81: 325-336. https://doi.org/10.1016/j.ijheatmasstransfer.2014.10.018
[10] Levin, I.I., Dordopulo, A.I., Doronchenko, Y.I., Raskladkin, M.K., Fedorov, A.M., Kalyaev, Z.V. (2016). Immersion liquid cooling FPGA-based reconfigurable computer system. IFAC-PapersOnLine, 49(25): 366-371. https://doi.org/10.1016/j.ifacol.2016.12.070
[11] Levin, I., Dordopulo, A., Fedorov, A., Doronchenko, Y. (2017). Design of advanced reconfigurable computer systems with liquid cooling. Russian Supercomputing Days, Moscow, Russia, pp. 442-455. https://doi.org/10.1007/978-3-319-71255-0_36
[12] Shah, J.M., Eiland, R., Siddarth, A., Agonafer, D. (2016). Effects of mineral oil immersion cooling on IT equipment reliability and reliability enhancements to data center operations. 2016 15th IEEE Intersociety Conference on Thermal and Thermomechanical Phenomena in Electronic Systems (ITherm), pp. 316-325. https://doi.org/10.1109/ITHERM.2016.7517566
[13] Eiland, R., Fernandes, J., Vallejo, M., Agonafer, D., Mulay, V. (2014). Flow Rate and inlet temperature considerations for direct immersion of a single server in mineral oil. Fourteenth Intersociety Conference on Thermal and Thermomechanical Phenomena in Electronic Systems (ITherm), Orlando, FL, USA, pp. 706-714. https://doi.org/10.1109/ITHERM.2014.6892350
[14] Eiland, R., Edward Fernandes, J., Vallejo, M., Siddarth, A., Agonafer, D., Mulay, V. (2017). Thermal performance and efficiency of a mineral oil immersed server over varied environmental operating conditions. Journal of Electronic Packaging, 139(4): 041005. https://doi.org/10.1115/1.4037526
[15] Wagner, G.R., Schaadt, J.R., Dixon, J., Chan, G., Maltz, W., Mostafavi, K., Copeland, D. (2016). Test results from the comparison of three liquid cooling methods for high-power processors. 2016 15th IEEE Intersociety Conference on Thermal and Thermomechanical Phenomena in Electronic Systems (ITherm), Las Vegas, NV, USA, pp. 619-624. https://doi.org/10.1109/ITHERM.2016.7517605
[16] Li, B., Cui, Z., Cao, Q., Shao, W. (2021). Increasing efficiency of a finned heat sink using orthogonal analysis. Energies, 14(3): 782. https://doi.org/10.3390/en14030782
[17] El Ghandouri, I., El Maakoul, A., Saadeddine, S., Meziane, M. (2020). Design and numerical investigations of natural convection heat transfer of a new rippling fin shape. Applied Thermal Engineering, 178: 115670. https://doi.org/10.1016/j.applthermaleng.2020.115670
[18] Shyu, J.C., Jheng, J.S. (2020). Heat transfer enhancement of plate-fin heat sinks with different types of winglet vortex generators. Energies, 13(19): 5219. https://doi.org/10.3390/en13195219
[19] Shaeri, M.R., Yaghoubi, M. (2009). Thermal enhancement from heat sinks by using perforated fins. Energy conversion and Management, 50(5): 1264-1270. https://doi.org/10.1016/j.enconman.2009.01.021
[20] Maji, A., Bhanja, D., Patowari, P.K. (2017). Numerical investigation on heat transfer enhancement of heat sink using perforated pin fins with inline and staggered arrangement. Applied Thermal Engineering, 125: 596-616. https://doi.org/10.1016/j.applthermaleng.2017.07.053