Omar Ouabouch* | Imad Ait Laasri | Mounir Kriraa | Mohamed Lamsaadi
© 2021 IIETA. This article is published by IIETA and is licensed under the CC BY 4.0 license (http://creativecommons.org/licenses/by/4.0/).
OPEN ACCESS
This study examines the three-dimensional heat transfer and flow characteristics of nanofluids in a parabolic trough solar collector under turbulent flow conditions, whereas a non-uniform focused heat flux was applied to the absorption pipe. CuO/water, Al2O3/water, TiO2/water, and SiO2/water are studied numerically. The dynamic and thermal fields are determined by the Reynolds number varying between 50000 ≤ Re ≤ 250000, while the volume concentration of nanofluids is the following: 3% CuO, 6% Al2O3, 4.82% SiO2 and 3.15% TiO2, the nanoparticle size of 30 nm by means of Finite Element Method (FEM). Effects of various parameters such as volume fraction of nanoparticles (φ), various Reynolds numbers and type of nanoparticle on thermo-hydraulic performance of the parabolic solar collector are studied. The average Nusselt number, heat transfer coefficient, average friction factor, pressure drop, temperature and velocity distribution are illustrated using four different types of nanofluids and four different volume fractions of nanoparticles with various Reynolds numbers. According to the final results, both TiO2 and CuO nanofluids have better performance in terms of thermal and hydraulic efficiency and evaluation economic performance compared with other nanofluids studied.
nanofluids, turbulent forced convection, solar parabolic trough collector, thermal-hydraulic performance, economic efficiency
Several environmental factors that impact energy production worldwide such as air pollution, global warming, climate change and water pollution [1]. Combustion of fossil fuels (oil and natural gas) are among the conventional energy sources that will be exhausted in a few decades and also generate high carbon dioxide emissions [2]. Therefore, renewable energy is one of the most attractive solutions for producing clean energy. Solar energy is one of the main sources of renewable energy. The parabolic trough collector (PTC) represents the highest concentration of solar energy with thermal oils up to 400℃. [3] these PTC are efficient up to 550℃ with molten salts [4]. Lately, a large number of studies on improving the thermal efficiency of PTC performance were released using nanofluids, inlets in receiver such as turbulator and fin. The use of nanofluids as working fluids is one of the techniques for improving thermal efficiency. The nanofluid, which was discovered in 1995 by Choi [5], is produced by introducing nanoparticles into the base fluid such us water, ethylene glycol, etc. It presents two advances compared to the base fluid: First, when mixing the nanofluid, nanoparticles with higher thermal conductivity should be used to obtain a nanofluid with higher thermal conductivity than the base fluid. Moreover, the nanoparticles improve the surface of the conventional fluid and allow it to have a higher thermal capacity [6]. Different studies have been conducted on the thermophysical properties of nanofluids. A short review presents recent studies on the thermophysical properties of nanofluids and the parameters that influence these properties [7]. Gupta et al. [8] provided a general study of the different thermophysical properties of nanofluids as well as the factors that influence on its properties. They resulted that nanoparticle concentration, shape, size and material, as well as the base fluid and temperature are the principal factors that affect these properties. Radiation is focused on the absorber in a non-uniform way, which explains why the bottom part is the hottest. Heat enhancement techniques attempt to make the temperature distribution more uniform by improving the heat transfer coefficient and making ways for heat to flow from the warmer absorber to the cooler center of the fluid being used. Lu et al. [9] defined a non-uniform thermal transfer system and studied the performance of a parabolic mirror receiver based on the energy ratios of the heat transfer fluid, the absorber tube, the glass envelope and the environment. Both the absorber tube and the glass envelope are divided within two areas for uneven distribution of solar radiation and surface temperature, and then a non-uniform heat transfer profile of the solar absorber is generated. The non-uniform model thermal receiver heat drop is a little higher than the uniform model, based on the computational results. Finally, the heat transfer characteristics of the solar receiver with parabolic mirrors is better calculated by non-uniform model, especially under solar irradiation conditions. Sokhansefat et al. [10] found that the larger ratio of concentration of Al2O3/synthetic oil nanoparticles in a PTC tube leads to an improved heat transfer coefficient, also at lower temperatures. Bellos et al. [11] investigated the use of Al2O3 and CuO nanoparticles dispersed on Syltherm 800 for different working conditions and agreed ratios. They showed that CuO particles provide 1.26% improvement in thermal performance and Al2O3 particles provide 1.13% improvement. Faizal et al. [12] investigated the contribution of four different water-based nanofluids, including CuO/water, SiO2/water, TiO2/water, and Al2O3/water, in reducing the size of solar collectors, and consequently the economic and environmental benefits. The result is that CuO/water nanofluids are the best choice for reducing the size of solar collectors. Mahian et al. [13] investigated the Nusselt number and thermal impacts from four types of nanofluids (CuO/H2O, Al2O3/H2O, TiO2/H2O and SiO2/H2O) with 4% volume fraction on the mini channel based solar collector. They found that Al2O3/water nanofluids have the highest heat transfer coefficient in the tubes, whereas the minimum value depends on SiO2/water nanofluids, the highest outlet temperature is taken by Cu/water nanofluids, they also found that the thermal effective conductivity of TiO2/water nanofluids is inferior to that of Al2O3/water nanofluids. Ghasemi and Ranjbar [14] studied the effect of concentration (φ = 3%) of Al2O3 and CuO nanoparticles in water for PTCs. The result is an enhancement of the thermal transfer factor of almost 28% for Al2O3 and 35% for CuO. The present study investigates the thermohydraulic performance of a parabolic trough receiver using various nanofluids (6% Al2O3, 4.82% SiO2, 3.15% TiO2 and 3% CuO) (Sigma Aldrich), the optimal material in terms of thermohydraulic and economic performance. This methodology is quite rare in the literature as we have seen from this literature review that many researchers are comparing each nanoparticle with its different concentration without taking into account the cost equivalent of this nanoparticle compared to other materials. Moreover, many studies are using uniform solar heat flux as well as non-concentrated solar sources. Thus, this study includes a novel economical approach which studies different nanofluids for parabolic trough concentrated solar power technology.
2.1 Geometrical and materials proprieties
Figure 1. Parabolic trough solar receiver
The physical model studied in this work is a parabolic trough solar collector presented in Figure 1. The working fluid flows through the absorber tube of the receiver which is affected by a non-uniform heat flux on the external surface. The receiver tube has a length of L = 4 m, an inner diameter dri = 66 mm with a thickness of 2 mm (t). The diameter of the spherical shapes of nanoparticles in this study is 30 nm. Table 1 presents the thermophysical properties of pure water and nanoparticles used in the study.
The following equations are taken to compute the thermophysical properties of the nanofluids:
The density [15]:
$\rho_{\mathrm{nf}}=(1-\varphi) \rho_{\mathrm{f}}+\varphi \rho_{\mathrm{s}}$ (1)
The specific heat [16]:
$\left(C_{p}\right)_{n f}=\frac{(1-\varphi)\left(\rho C_{p}\right)_{f}+\varphi\left(\rho C_{p}\right)_{s}}{\rho_{n f}}$ (2)
The dynamic viscosity [17]:
$\mu_{\mathrm{nf}}=\mu_{\mathrm{f}}\left(1+7.3 \varphi+123 \varphi^{2}\right)$ (3)
The thermal conductivity [18]:
$\mathrm{K}_{\mathrm{nf}}=0.25\left[(3 \varphi-1) \mathrm{K}_{\mathrm{s}}+(2-3 \varphi) \mathrm{K}_{\mathrm{s}}+\sqrt{\Delta}\right]$ (4)
where: $\Delta=\left[(3 \varphi-1) K_{s}+(2-3 \varphi) K_{f}\right]^{2}+8 K_{s} K_{f}$
Table 1. Thermo-physical properties of water and nanoparticles [19, 20]
|
Component |
Thermal conductivity k(W/m K) |
Specific heat Cp(J/kg K) |
Density ρ(kg/m3) |
|
Water (H2O) |
0.60 |
4182 |
1000 |
|
Alumina (Al2O3) |
40 |
773 |
3960 |
|
Copper Oxide (CuO) |
33 |
551 |
6000 |
|
Titanium dioxide (TiO2) |
8.4 |
692 |
4230 |
|
Silicon dioxide (SiO2) |
36 |
765 |
3970 |
2.2 The governing equations
The equations governing the flow of a fluid in a turbulent, three-dimensional and permanent regime, include the equations of continuity, conservation of momentum and energy corresponding to an equilibrium condition and are given by ref. [21].
Continuity equation:
$\nabla .(\rho V)=0$ (5)
Momentum equation:
$\nabla .(\rho V V)=-\nabla . P+\nabla .(\mu \nabla V)$ (6)
Energy equation:
$\nabla .\left(\rho V C_{p} T\right)=\nabla .(K \nabla T)$ (7)
2.3 Boundaries conditions
The collector system is assumed to be symmetrical with respect to its vertical axis. Consequently, only half of the absorber tube of the collector was considered for numerical modelling. Based on this, the following boundary conditions are applied in the model:
1. For the receiver, symmetry boundary conditions are applied;
2. At the inlet, a uniform velocity is used: (u = Uin: uniform velocity inlet based on Reynolds number),
Tin = 300 K, at L = 0) (8)
3. The non-slip condition is imposed on the walls.
$\mathrm{u}=0$ at $\mathrm{r}=\frac{\mathrm{d}_{\mathrm{ri}}}{2}$ (9)
4. A uniform heat flux is applied to the external surface of the pipe: the higher half of the receiver boundary is subject to: q" = Ig = 825 w/m2, where Ig is global radiation; and the lower half of the receiver boundary is subject to: q" = Ib. Cr, geometric, where Ib is beam radiation and Cr,geometric is geometric concentration ratio of the collector.
With $\mathrm{I}_{\mathrm{b}}=600 \mathrm{w} / \mathrm{m}^{2}$, and $\mathrm{C}_{\mathrm{r}, \text { geometric }}=20$ (10)
5. At the outlet of the receiver, the pressure is equal to the atmospheric pressure:
P = Patm = 0 (11)
This generally models the pressure difference between the entrance and the outlet, while setting the pressure of the outlet to 0 Pa. While keeping the entrance boundary condition only as a velocity (Uin). We then have to solve through Navier-Stokes equations the pressure field from outlet to inlet, so that we can capture and measure the pressure drop. This makes the reason for setting up a zero pressure boundary condition at the outlet to serve as only a reference which results in the entrance pressure having a value of the actual pressure drop required to make a fluid flow inside the receiver.
2.4 Performances dimensionless parameters
The heat transfer coefficient of the receiver is calculated by the following formula:
$h=\frac{q^{\prime \prime}}{\left(T_{w i}-T_{r e f}\right)}$ (12)
The average Nusselt number is calculated by:
$\mathrm{N}_{\mathrm{u}}=\frac{\mathrm{h} \times \mathrm{d}_{\mathrm{ri}}}{\mathrm{k}_{\mathrm{f}}}$ (13)
The Reynolds number is written as:
$\mathrm{R}_{\mathrm{e}}=\frac{\rho \times \mathrm{U} \times \mathrm{d}_{\mathrm{ri}}}{\mu_{\mathrm{f}}}$ (14)
The Number of Prandtl is written as:
$P_{r}=\frac{\mu_{f}}{\rho_{f} \times \alpha_{f}}$ (15)
The friction factor coefficient is calculated by:
$\mathrm{f}=\frac{2 \times \Delta \mathrm{P} \times \mathrm{d}_{\mathrm{ri}}}{\mathrm{L} \times \rho \times \mathrm{U}_{\mathrm{in}}^{2}}$ (16)
$\Delta \mathrm{P}=\mathrm{P}_{\mathrm{av}, \text { inlet }}-\mathrm{P}_{\mathrm{av}, \text { outlet }}$ (17)
The thermal efficiency is calculated as follows:
$\eta_{\text {th }}=\frac{\mathrm{Q}_{\mathrm{u}}}{\mathrm{Q}_{\mathrm{s}}}$ (18)
$\mathrm{Q}_{\mathrm{u}}=\dot{m} . \mathrm{C}_{\mathrm{p}}.\left(\mathrm{T}_{\mathrm{out}}-\mathrm{T}_{\mathrm{in}}\right)$ (19)
$\mathrm{Q}_{\mathrm{s}}=\mathrm{A}_{\mathrm{a}} \cdot \mathrm{I}_{\mathrm{b}}$ (20)
This study investigates the fluid flow and thermal heat transfer in a parabolic trough collector under a three-dimensional turbulent steady-state regime with a single-phase approach [22]. COMSOL Multiphysics was used to analyze the governing equations (5)-(7) to predict the velocity, temperature and pressure domains. The governing equations are converted to algebraic equations using the (FEM) scheme.
3.1 Verification of grid independence
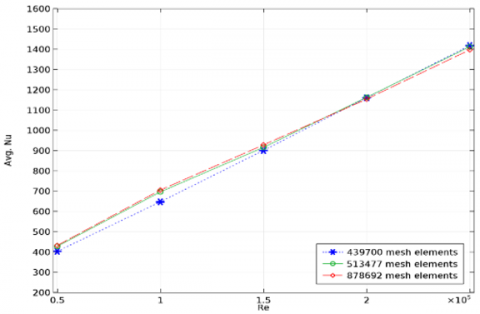
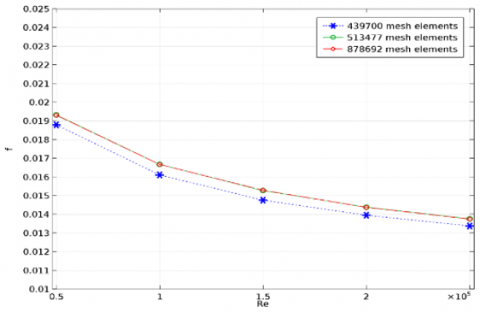
The tetrahedral mesh structure is used in this paper, as shown in Figure 2. Three different quantities of mesh elements were used to occupy the computational domain: (439700, 513477, and 878692) were implemented and compared in terms of velocities and pressures to ensure a mesh-independent solution. The average Nusselt number and friction factor were estimated for the three grids and a comparison of the results is presented. The compared results (Figure 3 and Figure 4) show that the 513477 mesh grid is considered adequate for the present study.
Figure 2. View of the generated grid of the studied system
Figure 3. Independence test for the average Nusselt number of the grid
Figure 4. Independence test for Friction factor of the grid
3.2 Validation
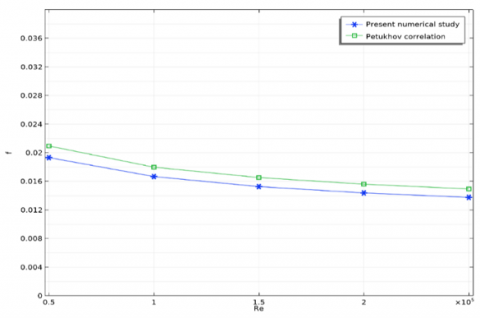
The model is verified in Figures 5 and 6 by comparing the present numerical results for the average Nusselt number and Friction factor of pure water flowing in the collector receiving tube with the experimental Petukhov correlations. For a fully turbulent flow, the Petukhov correlation in circular tube is defined by ref. [23].
Figure 5. Validation of the mean Nusselt number in the current model with correlations in the literature
Figure 6. Validation of the Friction factor in the current model with correlations in the literature
The current numerical results are in reasonable agreement with the Petukhov equation and there is a maximum of 12% and 8% deviation, respectively, for the Nusselt number and Friction factor correlations [23]:
The Nusselt number is given as:
$\mathrm{N}_{\mathrm{u}}=\frac{\left(\frac{\mathrm{f}}{8}\right) \mathrm{R}_{\mathrm{e}} \mathrm{P}_{\mathrm{r}}}{1.07+12.7\left(\frac{\mathrm{f}}{8}\right)^{0.5}\left(\mathrm{P}_{\mathrm{r}}^{\frac{2}{3}}-1\right)}$ (21)
The Friction factor is given as follows:
$\mathrm{f}=\left(0.79 \times \mathrm{L}_{\mathrm{n}} \times \mathrm{R}_{\mathrm{e}}-1.64\right)^{-2}$ (22)
4.1 Thermal transfer performance
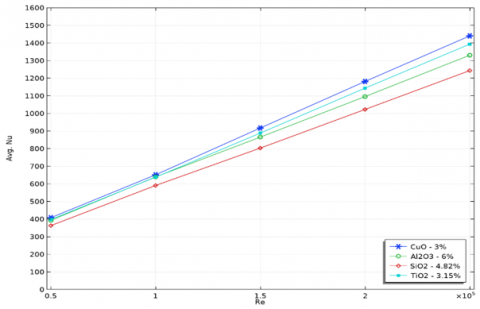
Figure 7, shows the average Nusselt number which represents the ratio of convective to conductive heat transfer. We can clearly see that for a nanofluid enhanced with 3% CuO, the equivalently priced nanoparticles are 6% Al2O3, 4.82% SiO2 and 3.15% TiO2, which shows in the results that even when using nanoparticles with high thermal conductivity the performance aren’t that greatly improved because we should take into account the uniformity of these particles and their impact on the fluid flow and friction. It was detected that the thermal performance increase can be reduced if we use high concentration of nanoparticles even at high thermal conductivity. This phenomenon is generally caused by the increase of the friction factor which then suppresses and reduces the velocity and pressure inside the receiver leading to a reduced overall heat transfer coefficient. The nanofluid enhanced with 4.82% SiO2 showed the least performance, while the nanofluid enhanced with 3% CuO showed the highest performance increase by 13.62%. Still, the nanofluid enhanced with 6% Al2O3 has also shown a performance increase of 7.66% compared to SiO2. Moreover, the use of TiO2 at even lower percentages showed high performance increase of 10.39% than SiO2 even though TiO2 has low thermal conductivity compared to the other nanoparticles.
Figure 7. Average Nusselt number for different nanofluids with Reynolds number
4.2 Receiver hydraulic performance
To deeply investigate the receiver’s hydraulic performance, we have chosen to evaluate the fluid friction factor as well as the pressure drop. In Figure 8, the fluid friction factor is shown, which indicates the pressure and velocity drops inside a pipe due to the interaction between the fluid, nanoparticles and pipe. We can see that the nanofluid with the highest fluid friction is the one enhanced with 6% Al2O3. This is due to the high nanoparticle concentration in this fluid. Still, the nanofluid enhanced with 3.15% TiO2 showed the least fluid friction even though it has a slightly higher nanoparticle concentration that CuO. This is due to the higher density of CuO, which shows that the density of nanoparticles also has a significant role in the hydraulic efficiency of the receiver. Furthermore, we have evaluated the fluid friction increase when compared to TiO2 as it has the lowest fluid friction for all the different Reynolds numbers. The results show an increase in fluid friction of 14.45%, 3.81% and 1.45% for Al2O3, CuO and SiO2 respectively. Figure 9 shows the pressure drop inside the pipe for each configuration. The nanofluid enhanced with TiO2 still shows the lowest pressure drop making it an attractive choice for enhancing the thermal performance of the receiver without dropping too much pressure. It was found that the pressure drop was increase by 13.76%, 3.63% and 1.38% for Al2O3, CuO and SiO2 respectively.
Figure 8. Friction factor for different nanofluids and Reynolds number
Figure 9. Pressure drop with Reynolds number for various nanofluids
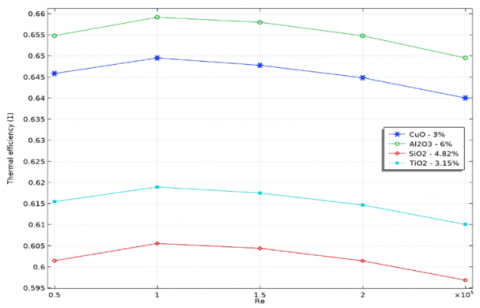
4.3 Thermal efficiency and outlet temperature
It is most important to investigate the PTC thermal efficiency using various nanofluids. Figure 10, shows the heat efficiency for each nanofluid at various Reynolds numbers. It was revealed that thermal efficiency starts increasing for all different configurations until it reached a Reynolds number of 100000, then it started decreasing for all the different nanofluids. It was concluded that the use of high conductive nanoparticles like Al2O3 and CuO is very good choice, however, from an economic stand point the use of TiO2 could be very promising. Nevertheless, the environmental impact of using TiO2 still needs further research. For the average thermal efficiency increased in each nanofluid, it was found that an increase of 8.85%, 7.25% and 2.22% is reached for Al2O3, CuO and TiO2 respectively.
Figure 10. Variations of thermal efficiency with Reynolds number for various nanofluids
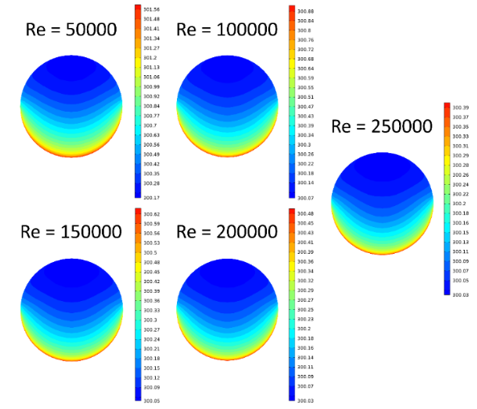
Figure 11. Temperatures contours for TiO2-water nanofluid (φ = 3.15%) for various Reynolds numbers
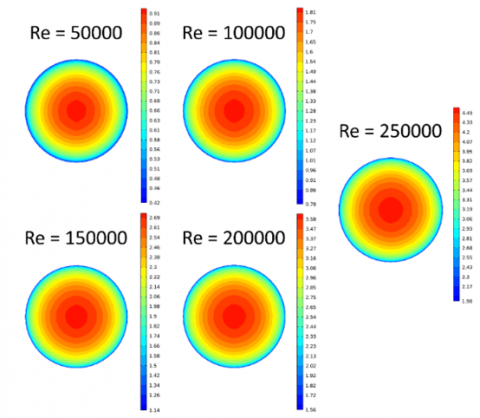
It is equally important to evaluate the outlet temperature, especially for TiO2 as it has shown the least fluid friction and pressure drop, so in order to valorise its use in PTCs. We must directly assess its outlet temperature distribution as well as velocity. In Figure 11, we can see that the temperature distribution has a very stratified form, because the receiver of the PTC only receives the direct normal irradiation from the bottom side, leaving the top side of the receiver only exposed to the global radiation. The temperature distribution is relatively the same for all Reynolds numbers. However, the maximum temperature reached at the outlet is decreasing, still the stratified temperature distribution doesn’t change much but their values change a lot. Moreover, the same behaviour persists in Figure 12, which shows the velocity distribution at the outlet of the receiver. We can that in this case the values of the velocities are increasing with the number of Reynolds, however, the velocity distribution is the same. For both cases, we can conclude that the velocities are higher when the Reynolds numbers are high and the temperature distribution is low at higher Reynolds numbers. This is caused by the increased velocities at high Reynolds numbers as the nanofluid doesn’t have much time to absorb the solar energy from the concentrated solar source, thus it has low temperature at the outlet.
Figure 12. Velocity contours for TiO2-water nanofluid ($\varphi$= 3.15%) for various Reynolds numbers
This paper investigated the thermal-hydraulic and economic efficiency of flow and heat transfer under turbulent regime of different emergent materials in a base fluid(water) inside a parabolic trough solar collector’s receiver. Moreover, different nanoparticles were studied to enhance the thermal and keep the hydraulic performance as good as possible. Al2O3, CuO, TiO2 and SiO2 were chosen in a manner that each nanofluid has a different concentration of these nanoparticles, so that we can maintain the same price, this was adopted to provide a reasonable comparison from an economic standpoint. So, the main conclusion that we were able to achieve in this study, are the following:
|
PTC |
Parabolic trough collector |
|
L |
Receiver length, m |
|
dri |
Absorber tube inner diameter, mm |
|
dro |
Absorber tube outer diameter, mm |
|
Cr, geometric |
Geometric concentration ratio |
|
(t) |
Thickness, mm |
|
r |
Radius, mm |
|
CP |
Specific heat, J. kg-1. K-1 |
|
Re |
Reynolds number (-) |
|
Pr |
Prandtl number (-) |
|
Tin |
Inlet average temperature |
|
Tout |
Outlet average temperature |
|
K |
Thermal conductivity, W.m-1. K-1 |
|
T |
Temperature, K |
|
V |
Velocity field, (m.s-1) |
|
Uin |
Average inlet velocity, (m.s-1) |
|
P |
Pressure, (Pa) |
|
Nu |
Nusselt number (-) |
|
f |
Friction factor (-) |
|
$\dot{m}$ |
Mass flow rate, kg.s-1 |
|
q″ |
Heat flux, W.m-2 |
|
Ig |
Global radiation, W.m-2 |
|
Ib |
Beam radiation, W.m-2 |
|
Twi |
Temperature of the inner wall of the receiver, K |
|
Tref |
Average temperature of the inlet and outlet, K |
|
ηth |
Thermal efficiency (-) |
|
Qu |
Useful energy delivered, W |
|
Qs |
Solar energy at the collector's outlet, W |
|
$\mathrm{A}_{\mathrm{a}}$ |
Collector aperture, m2 |
|
h |
Heat transfer coefficient, W. m-2. K-1 |
|
g |
Mass flux, kg. s-1.m-2 |
|
Greek symbols |
|
|
ρ |
Density, kg.m-3 |
|
φ |
solid volume fraction |
|
µ |
dynamic viscosity, kg. m-1.s-1 |
|
Subscripts |
|
|
s |
nanoparticle |
|
f |
fluid (pure water) |
|
nf |
nanofluid |
[1] Loni, R., Kasaeian, A.B., Asli-Ardeh, E.A., Ghobadian, B., Le Roux, W.G. (2016). Performance study of a solar-assisted organic Rankine cycle using a dish-mounted rectangular-cavity tubular solar receiver. Applied Thermal Engineering, 108: 1298-1309. https://doi.org/10.1016/j.applthermaleng.2016.08.014
[2] Wang, K., He, Y.L., Qiu, Y., Zhang, Y. (2016). A novel integrated simulation approach couples MCRT and Gebhart methods to simulate solar radiation transfer in a solar power tower system with a cavity receiver. Renew. Energy, 89: 93-107. https://doi.org/10.1016/j.renene.2015.11.069
[3] Razmmand, F., Mehdipour, R., Mousavi, S.M. (2019). A numerical investigation on the effect of nanofluids on heat transfer of the solar parabolic trough collectors. Appl. Therm. Eng., 152: 624-633. https://doi.org/10.1016/j.applthermaleng.2019.02.118
[4] Bonanos, A.M., Georgiou, M.C., Stokos, K.G., Papanicolas, C.N. (2019). Engineering aspects and thermal performance of molten salt transfer lines in solar power applications. Appl. Therm. Eng., 154: 294-301. https://doi.org/10.1016/j.applthermaleng.2019.03.091
[5] Choi, S.U.S., Eastman, J.A. (1995). Enhancing thermal conductivity of fluids with nanoparticles. Am. Soc. Mech. Eng. Fluids Eng. Div. FED, 231: 99-105.
[6] Xuan, Y., Li, Q. (2000). Heat transfer enhancement of nanofluids. Int. J. Heat Fluid Flow, 21(1): 58-64. https://doi.org/10.1016/S0142-727X(99)00067-3
[7] Ouabouch, O., Kriraa, M., Lamsaadi, M. (2020). A survey on thermo physical properties of nanofluids. Glob. J. Adv. Eng. Technol. Sci., 7(8): 25-31. https://doi.org/10.5281/zenodo.4017395
[8] Gupta, M., Singh, V., Kumar, R., Said, Z. (2017). A review on thermophysical properties of nanofluids and heat transfer applications. Renewable and Sustainable Energy Reviews, 74: 638-670. https://doi.org/10.1016/j.rser.2017.02.073
[9] Lu, J.F., Ding, J., Yang, J.P., Yang, X.X. (2013). Nonuniform heat transfer model and performance of parabolic trough solar receiver. Energy, 59: 666-675. https://doi.org/10.1016/j.energy.2013.07.052
[10] Sokhansefat, T., Kasaeian, A.B., Kowsary, F. (2014). Heat transfer enhancement in parabolic trough collector tube using Al2O3/synthetic oil nanofluid. Renew. Sustain. Energy Rev., 33: 636-644. https://doi.org/10.1016/j.rser.2014.02.028
[11] Bellos, E., Tzivanidis, C. (2017). Parametric investigation of nanofluids utilization in parabolic trough collectors. Therm. Sci. Eng. Prog., 2: 71-79. https://doi.org/10.1016/j.tsep.2017.05.001
[12] Faizal, M., Saidur, R., Mekhilef, S., Alim, M.A. (2013). Energy, economic and environmental analysis of metal oxides nanofluid for flat-plate solar collector. Energy Convers. Manag., 76: 162-168. https://doi.org/10.1016/j.enconman.2013.07.038
[13] Mahian, O., Kianifar, A., Sahin, A.Z., Wongwises, S. (2014). Performance analysis of a minichannel-based solar collector using different nanofluids. Energy Convers. Manag., 88: 129-138. https://doi.org/10.1016/j.enconman.2014.08.021
[14] Ghasemi, S.E., Ranjbar, A.A. (2016). Thermal performance analysis of solar parabolic trough collector using nanofluid as working fluid: A CFD modelling study. Journal of Molecular Liquids, 222: 159-166. https://doi.org/10.1016/j.molliq.2016.06.091
[15] Khanafer, K., Vafai, K. (2011). A critical synthesis of thermophysical characteristics of nanofluids. Int. J. Heat Mass Transf., 54(19-20): 4410-4428. https://doi.org/10.1016/j.ijheatmasstransfer.2011.04.048
[16] Xuan, Y.M., Roetzel, M. (2000). Conceptions for heat transfer correlation of nanofluids. Int. J. Heat Mass Transf., 43(19): 3701-3707. https://doi.org/10.1016/S0017-9310(99)00369-5
[17] El Bécaye Maïga, S., Palm, S.J., Nguyen, C.T., Roy, G., Galanis, N. (2005). Heat transfer enhancement by using nanofluids in forced convection flows. Int. J. Heat Fluid Flow, 26(4): 530-546. https://doi.org/10.1016/j.ijheatfluidflow.2005.02.004
[18] Bruggeman, D.A.G. (1935). Berechnung verschiedener physikalischer konstanten von heterogenen Substanzen. I. Dielektrizitätskonstanten und Leitfähigkeiten der Mischkörper aus isotropen Substanzen. Ann. Phys., 416(7): 636-664. https://doi.org/10.1002/andp.19354160705
[19] Kamyar, A., Saidur, R., Hasanuzzaman, M. (2012). Application of Computational Fluid Dynamics (CFD) for nanofluids. Int. J. Heat Mass Transf., 55(15-16): 4104-4115. https://doi.org/10.1016/j.ijheatmasstransfer.2012.03.052
[20] Namburu, P.K., Kulkarni, D.P., Dandekar, A., Das, D.K. (2007). Experimental investigation of viscosity and specific heat of silicon dioxide nanofluids. Micro Nano Lett., 2(3): 67-71. https://doi.org/10.1049/mnl:20070037
[21] Yuan, S.W. (1967). Foundations of Fluid Mechanics. Prentice-Hall, New York, USA.
[22] Mahian, O., Kolsi, L., Aman, M., et al. (2019). Recent advances in modeling and simulation of nanofluid flows—Part II: Applications. Physics Reports, 791: 1-59. https://doi.org/10.1016/j.physrep.2018.11.003
[23] Petukhov, B.S. (1970). Heat transfer and friction in turbulent pipe flow with variable physical properties. Adv. Heat Transf., 6: 503-564. https://doi.org/10.1016/S0065-2717(08)70153-9