Suwimon Saneewong Na Ayuttaya | Phadungsak Rattanadecho*
© 2021 IIETA. This article is published by IIETA and is licensed under the CC BY 4.0 license (http://creativecommons.org/licenses/by/4.0/).
OPEN ACCESS
In this numerical study based on the concept of electrokinetic flow, a vertical flow model has been developed for the implementation of blood flow transport. Electrical voltage and time were varied in a range of 0 – 20 kV, and 0 – 10 s, respectively. In the vertical upward flow model, blood flows through a porous fat deposit while presenting the electric field, flow pattern, pressure field, vorticity field and the temperature field, both with and without electrokinetic flow. The results show that blood flow moves upward within the vertical flow model but electric field is not appeared in case of absent the electrokinetic flow. With the electrokinetic flow, the electric field is more concentrated when a higher electrical voltage is applied and the electrical voltage is not dependent on time, but the electric field increases when the electrical voltage is increased. The flow pattern, pressure field, vorticity field and temperature field are not in the same pattern as the electric field but they are induced by the electric field. In addition, the electric value, velocity, pressure and vorticity increase with increasing electrical voltage and the temperature increases with increasing electrical voltage and time. Finally, electrokinetic flow can induce the temperature within a porous fat deposit so that the heating zone is enhanced.
blood flow transport, porous fat depot, electrokinetic flow, vertical flow model
Heart disease is caused by damage to all or part of the heart, damage to the coronary arteries, or a poor supply of nutrients and oxygen to the organ [1, 2]. Coronary heart disease describes a range of conditions that can affect your heart. Diseases under the heart disease umbrella include blood vessel diseases such as coronary artery disease; heart rhythm problems (arrhythmias); and heart defects you're born with (congenital heart defects), among others. Some types of heart disease, such as hypertrophic cardiomyopathy, are genetic. These, alongside congenital heart defects, can occur before a person is even born [3, 4]. There are two main lines of heart disease treatment, the patient can attempt to treat the heart condition using medications. If these do not have the desired effect, surgical options are available to help correct the issue. Heart surgery is an intensive option from which it can take a long time to recover. However, it can be effective in treating blockages and heart problems for which medications may not be effective, especially in advanced stages of heart disease. The most common surgeries include angioplasty, in which a balloon catheter is inserted to widen narrowed blood vessels that might be restricting blood flow to the heart [5-8]. Electrokinetic flow, or electro-fluid-dynamics, is the study of the dynamics of electrically charged fluid. It is the study of the motion of ionized particles and their interactions within an electric field and the surrounding fluid [9-11]. From previous research, Ayuttaya [12] has divided the four main groups of electrokinetic flow applications by their mechanism characteristics. The first group is the mechanism of increased flow, this is used for pumping and biomechanics applications. The second group is the mechanism of injection flow, it is used for droplets, electrospray, and microfluidics. The third group is the mechanism of induced flow, it is used for an electrostatic precipitator and actuator. The fourth group is the mechanism of a mixing process, this is used for boiling and condensation, heat and mass transfer, as a heat exchanger, and in the drying process. The mechanism of increased flow (the first group) was investigated for pumping [13-15] and biomechanics therapy [16-19] using electrokinetic flow. From previous studies, some researchers have contributed to the development of biomechanics therapy subject to electrokinetic flow. Vladislav et al. [16] studied capillary electrophoresis on microchips and other capillary techniques such as isoelectric focusing, isotachophoresis, free-flow electrophoresis, and micellar electrokinetic chromatography. The material and technologies used to prepare microchips, microchip designs, channel geometries, sample manipulation and derivatization, detection, and applications of capillary electrophoresis to microchips were discussed. Progress in the separation of nucleic acids and proteins were particularly emphasized. Hesam et al. [19] studied the impact of sphingosine kinase inhibitor-loaded nanoparticles on the bioelectrical and biomechanical properties of cancer cells. From the results, the cells treated with sphingosine kinase inhibitors (SphKIs) were shown to have significantly higher impedance magnitudes at all four frequencies. SphKIs were monitored to respond to dynamic cellular biophysical properties. The bioelectrical parameters extracted using this model also revealed that highly aggressive breast cancer cells treated with SphKIs shifted electrically towards that of a less malignant phenotype; SphKI-treated cells exhibited an increase in cell-channel interface resistance and a significant decrease in specific membrane capacitance.
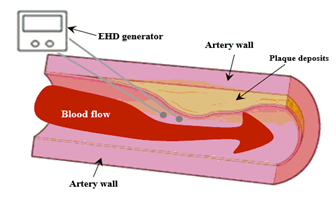
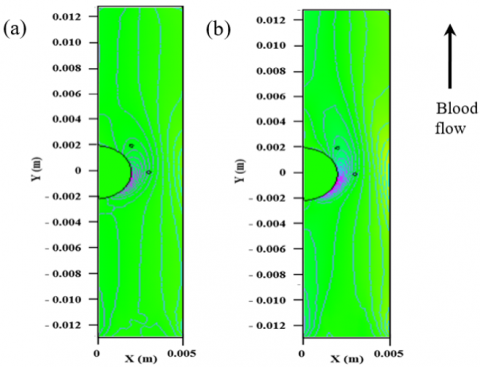
The main mechanism of electrokinetic flow involves a phenomenon related to the direct conversion of electrical energy into kinetic energy. The term ‘electrokinetic flow’ may be considered synonymous with the rather elaborate electrostrictive hydrodynamics (EHD). Unfortunately, to date, there is no systematic investigation of the therapy for heart disease. For coronary artery disease, the coronary arteries can become diseased or damaged, usually because of plaque deposits that contain cholesterol. The most common result is that not enough oxygen reaches the heart muscle due to stenosis of the coronary artery, as shown in Figure 1. The heart chambers become dilated as a result of heart muscle weakness and cannot pump blood properly. Figure 1 (a) shows plaque deposits stuck to the artery wall in the coronary arteries so that narrowing of the vessel appears. With the EHD idea, the flow is increased by using pressure increasing equipment on the coronary artery. As shown in Figure 1 (b), an EHD pump or EHD generator is preliminarily used for therapy on the narrowed blood vessel. An electric discharge is created from the EHD generator, which is generated within the coronary arteries. The EHD generator is a means of biomechanics therapy that uses electrokinetic flow, it increases the flow mechanism and the pressure of the blood flow.
(a)
(b)
Figure 1. The stenosis corona heart (a) the narrowing of blood vessels from plaque deposits (b) the blood flow after using EHD pump therapy
Figure 2. The physical model geometry and boundary conditions of the stenosis corona heart
Blood flow after using EHD pump therapy is described in the physical geometry model with the boundary conditions of coronary artery stenosis as shown in Figure 2. The blood flow is transported in a left to right direction. The two boundary conditions are composed of the electrostatic model and the flow field model. It represents the plaque deposits that are stuck to the artery wall and set apart from the boundary conditions. For the electrostatic model, the boundary conditions of all outer sides were considered to have zero charge symmetry (n⋅D=0). The electrode and ground are considered the electrical voltage $\left(V=V_{0}\right)$ and ground $(V=0)$ boundary conditions, respectively. For the flow field model, the inlet velocity boundary conditions are assumed to be uniform. The outlet boundary condition of the blood flow is considered with no viscous stress $\left(\eta\left(\nabla \vec{u}+(\nabla \vec{u})^{T} \cdot n=0, \vec{P}=\vec{P}_{0}\right)\right.$ and the energy equation is as follows: $\left(\rho C_{p}\left[\frac{\partial T}{\partial t}+\vec{u} \nabla T\right]=k\left(\nabla^{2} T\right)\right)$. The artery walls are applied at no slip $(\vec{u}=0)$. This is the standard and default boundary condition for a stationary solid wall.
The problem definition is showed in Figure 3. For the implementation of the blood flow transport, the physical model, the model approach, the problem definition, the boundary condition, and the calculation procedure are systematically investigated for the concept of an electrokinetic flow.
Figure 3. Problem definition (a) physical model geometry, (b) boundary condition
2.1 Physical model
Dietary factors often affect coronary heart disease, but a detailed analysis of the evidence shows that the relationship is more complex than the current hypothesis of plaque deposits suggests [20]. This model studies a portion of the human vascular system and plaque deposits (fat deposits) on the artery wall. The coronary artery is assumed to be in a vertical flow model. The vertical flow model is comprised of three main parts, the first part is the electrostatic model, the second part is the flow field model and the third part is the temperature model. The setting is considered both in its subdomain and boundary setting and the option with constant is defined by the classical and thermophysical properties of blood and fat within the vertical flow model. In addition, the electric field appears by the electric force and is affected by the flow field, resulting in the enhancement of heat transfer [21]. The electrokinetic flow is induced by the flow field, pressure field, and vorticity, but it is not influenced by the human vascular system. Because the electrokinetic flow is not changing the properties of blood and fat, such a high electric field conducts high shear flow resulting in the enhancement of fluid flow and heat transfer. In this case, since the skin is a thin-walled structure, the internal shear stresses in the skin can be represented as shear flow. Figure 3 (a) shows the physical model geometry of the vertical flow model. The dimensions of the vertical flow model are 5 mm (0.005 m (wide) x 25 mm (0.025 m) (high)). The porous fat depot is assumed to be in a semicircular shape and the radius of the fat deposit is 2 mm (0.002 m). The center of the semicircular shape of the porous fat deposit is fixed (at 0, 0) and it is sticking to the left of the vertical flow model. In order to study blood flow transportation within the vertical flow model under electrokinetic flow, the electrode and ground is in a very small circle and the diameter is 0.005 mm. The position of the single electrode and the single ground is always fixed (at 0.003, 0) and (0.002, 0.002), respectively. The initial blood flow (vi, P0) was recorded by Ko et al. [22] and it flows in a bottom to top direction. In this study, electrical voltage (V0) and time (t) is varied in a range of 0 – 20 kV, and 0 – 10 s, respectively. The blood is a non-Newtonian fluid and its viscosity changes depending on how much stress is placed on it. The classical and thermophysical properties of blood (b) and fat (f) within the vertical flow model are shown in Table 1 [23, 24].
Table 1. Classical and thermophysical properties of blood and fat within the vertical flow model
|
Properties |
Blood (b) [23] |
Fat (f) [24] |
|
Thermal conductivity (k; W/m.K) |
0.497 |
0.22 |
|
Density (ρ; kg/m3) |
1,030 |
916 |
|
Specific heat capacity ($C_{P}$; J/K) |
3,600 |
2,300 |
|
Relative permittivity ($\varepsilon_{r}$; F/m) |
43.00 |
5.97 |
|
Electric conductivity (σ; S/m) |
1.69 |
0.09 |
|
Porosity (ϕ) |
0 |
0.17 |
2.2 Model approach and problem definition
Numerical modeling based on the concept of an electrokinetic flow has been developed for the implementation of the blood flow transport through a porous fat depot within the vertical flow model.
2.2.1 Analysis of electric field in a vertical flow model
This study is based on the dielectric property is constant and the effect of the magnetic field is negligible. The electric field distribution is computed by using Maxwell’s equations (Eqns. (1), (2), (3) and (4)) listed as below:
$\nabla \cdot \varepsilon \overset{\scriptscriptstyle\rightharpoonup}{E}=q$ (1)
$\overset{\scriptscriptstyle\rightharpoonup}{E}=-\nabla V$ (2)
$\nabla \cdot J+\frac{\partial q}{\partial t}=0$ (3)
$J=q\overset{\scriptscriptstyle\rightharpoonup}{v}+(\overset{\scriptscriptstyle\rightharpoonup}{v}\cdot \nabla )(\varepsilon \overset{\scriptscriptstyle\rightharpoonup}{E})-b\nabla q$ (4)
where, E is electric field intensity, ε is dielectric permittivity, V is electrical voltage, J is current density, t is time, b is ion mobility and v are vertical blood flow velocity. Space charge density (q) is described by Griffiths [25] and it is a concept in which excess electric charge is treated as a continuum of charge distributed over a region of space. The governing equation for computing the electric force per unit volume (electrophoretic force, fE) performing on fluid flow can be expressed by
${{\overset{\scriptscriptstyle\rightharpoonup}{f}}_{E}}=q\overset{\scriptscriptstyle\rightharpoonup}{E}-\frac{1}{2}{{\overset{\scriptscriptstyle\rightharpoonup}{E}}^{2}}\nabla \varepsilon +\frac{1}{2}\nabla \left[ {{{\overset{\scriptscriptstyle\rightharpoonup}{E}}}^{2}}{{\left[ \frac{\partial \varepsilon }{\partial \rho } \right]}_{T}}\rho \right]$ (5)
where, ρ is the density of fluid and T is uniform temperature. From the right-hand side of Eq. (5), three terms are the electrophoretic, the dielectrophoretic, and the electrostrictive forces, respectively. In the first term, the electrophoretic force results from the net uncharged within the fluid or ions injected from the electrodes and it results from the net charged fluid or ions injected from the electrodes. Electric field distribution is emitted from the electrode and induces to the ground. The second term, the dielectrophoretic force is a consequence of inhomogeneity in the permittivity of the dielectric fluid due to the non-uniform electric field, temperature gradients, and phase differences. The last term, the electrostrictive force is caused by non-homogeneous electric field strength and the variation in dielectric constant with temperature and density. This electric field stores energy. The dielectric constant, also commonly known as the relative permittivity. Dielectric properties include dielectric constant and dissipation factor, in which the dielectric constant is usually used to describe the dielectric characterization of the material. From assumption, the dielectric properties are constant and homogeneity [21]. Therefore, the second and third terms on the right- hand side of Eq. (5) are negligible.
2.2.2 Analysis of blood field in a vertical flow model
From the flow field model, this study is based on the incompressible fluid and the fluid physical properties are assumed to be constant and the effect of buoyancy and emission or absorption of radiant energy is negligible. The continuity and Navier–Stokes equations which coupled with electrophoretic force equation are considered from Eqns. (6) and (7), respectively. They are expressed by:
$\frac{\partial \rho }{\partial t}+\nabla \cdot (\rho \overset{\scriptscriptstyle\rightharpoonup}{v})=0$ (6)
$\rho \,\left[ \frac{\partial \overset{\scriptscriptstyle\rightharpoonup}{v}}{\partial t}+(\overset{\scriptscriptstyle\rightharpoonup}{v}\cdot \nabla )\overset{\scriptscriptstyle\rightharpoonup}{v} \right]=-\nabla \overset{\scriptscriptstyle\rightharpoonup}{P}+\mu {{\nabla }^{2}}\overset{\scriptscriptstyle\rightharpoonup}{v}+{{\overset{\scriptscriptstyle\rightharpoonup}{f}}_{E}}-\rho g$ (7)
where, P is pressure, g is gravity and m is viscosity.
2.2.3 Analysis of heat transfer
From the temperature field model, the effect of the phase change can be neglected and the thermal properties of the fluid are considered to be constant. The first part is the heat transfer analysis in the flow and the second part is the heat transfer analysis in the porous fat depot.
(1) Analysis of heat transfer in a vertical flow model
In the vertical flow, the temperature distribution is calculated by energy equation as shown in Eq. (8):
$\rho {{C}_{p}}\left[ \frac{\partial T}{\partial t}+\overset{\scriptscriptstyle\rightharpoonup}{v}\nabla T \right]=k\left( {{\nabla }^{2}}T \right),$ (8)
where, $C_{p}$ is the specific heat capacity and k is thermal conductivity.
(2) Analysis of heat transfer in a porous fat depot
The energy equation assumes that the temperature of fat (f) and blood (b) phases are identical as given by Wessapan and Rattanadecho [26]. The governing equations describing the heat transfer within the porous fat depot are calculated from Eqns. (9) – (11):
$\begin{align} & {{\left( \rho {{C}_{p}} \right)}_{eff}}\frac{\partial T}{\partial t}+{{\left( \rho {{C}_{p}} \right)}_{b}}\left( u\frac{\partial T}{\partial x}+v\frac{\partial T}{\partial y} \right) \\ & ={{k}_{eff}}\left( \frac{{{\partial }^{2}}T}{\partial {{x}^{2}}}+\frac{{{\partial }^{2}}T}{\partial {{y}^{2}}} \right) \\\end{align}$ (9)
${{\left( \rho {{C}_{p}} \right)}_{eff}}=(1-\phi ){{(\rho {{C}_{p}})}_{f}}+\phi \,{{(\rho {{C}_{p}})}_{b}}$ (10)
and effective thermal conductivity ($k_{e f f}$) in a porous medium.
${{k}_{eff}}=(1-\phi ){{\kappa }_{f}}+\phi \,{{\kappa }_{b}}$ (11)
where, $\varphi $ is porosity, $\kappa_{f}$ and $\kappa_{b}$ permeability of fat and blood, respectively.
2.3 Boundary condition
A boundary condition of the vertical flow model based on the concept of an electrokinetic flow model has been developed for the implementation of the blood flow transport through a porous fat depot, as shown in Figure 3 (b).
The boundary and initial condition of the electric field are based on the following:
(1) All of the outer sides, the boundary conditions are considered as zero charge symmetry,
$n\cdot D=0$ (12)
where, n is unit normal vector and D is electric flux density. The boundary conditions are considered as zero charge symmetry means no displacement field can penetrate the boundary and that the electric potential is discontinuous across the boundary.
(2) Electrode and ground are considered as electrical voltage and ground boundary conditions, respectively.
$V={{V}_{0}}$, at electrode position (13)
$V=0$, at ground position (14)
(3) The electrical voltage at the tip of the electrode (${{V}_{0}}$) is varied from 0 – 20 kV.
The boundary condition of the flow field is based on the following:
(1) The inlet velocity and the inlet pressure boundary conditions are assumed to be uniform and they flow from the bottom to top direction of the vertical flow model. It is defined as:
$\overset{\scriptscriptstyle\rightharpoonup}{v}={{\overset{\scriptscriptstyle\rightharpoonup}{v}}_{i}}$, at upward velocity (15)
$\overset{\scriptscriptstyle\rightharpoonup}{P}={{\overset{\scriptscriptstyle\rightharpoonup}{P}}_{0}}$, at upward pressure (16)
The initial blood flow (vi, P0) is entered from Ko et al. [22] and it flows from bottom to top.
(2) At the outlet boundary condition, the pressure of the blood flow is considered with no viscous stress. This boundary condition specifies vanishing viscous stress along with a Dirichlet condition on the pressure is defined as:
$\eta (\nabla \overset{\scriptscriptstyle\rightharpoonup}{v}+{{(\nabla \overset{\scriptscriptstyle\rightharpoonup}{v})}^{T}}\cdot n=0$, $\,\overset{\scriptscriptstyle\rightharpoonup}{P}\,=\,{{\overset{\scriptscriptstyle\rightharpoonup}{P}}_{0}}$ at outlet pressure (17)
where, $\eta $ is kinematics viscosity and T is matrix transpose.
(3) The left and the right boundary conditions of the artery walls (vertical flow model) are applied at no slip. This is the standard and default boundary condition for a stationary solid wall. The condition prescribed:
$\overset{\scriptscriptstyle\rightharpoonup}{v}=0$, at flow wall (18)
The boundary condition of the temperature field in the vertical flow is based on the following:
(1) The left and the right boundary conditions are applied at the insulation wall which is kept at a constant temperature and the condition prescribed:
$\frac{\partial T}{\partial n}=0$ (19)
(2) The inlet and outlet temperature boundary condition are shown in from Eqns. (20) and (21), respectively which defined as:
$T={{T}_{i}}$ (20)
$-n\cdot (-k\nabla T+\rho {{c}_{p}}\overset{\scriptscriptstyle\rightharpoonup}{v}\nabla T)=0$ (21)
where, $h_{c}$ is convective heat transfer. $T, T_{\alpha}$ and $\nabla T$ are temperature, ambient temperature_and temperature gradient, respectively. The uniform initial temperature of blood $\left(T_{b}\left(t_{i}\right)\right)$ is $310 \mathrm{~K}$ [23].
(3) The uniform initial temperature of the fat depot.
$\left(T_{f}\left(t_{i}\right)\right)$ is 25℃ (298 K) [24]. The semicircle shape of the porous fat depot is sticking to the left of the vertical flow model. It is evident that a generalized conjugate approach to the combined heat and fluid flow process. The interface of fat depot and blood are solved by Eq. (21) and it is defined as:
$-n_{u}^{{}}\cdot (-{{k}_{u}}\nabla {{T}_{u}}+{{\rho }_{u}}{{c}_{p,u}}{{\overset{\scriptscriptstyle\rightharpoonup}{v}}_{u}}{{T}_{u}})$ (22)
$-{{n}_{d}}\cdot (-{{k}_{d}}\nabla {{T}_{d}}+{{\rho }_{d}}{{c}_{p,d}}{{\overset{\scriptscriptstyle\rightharpoonup}{v}}_{d}}{{T}_{d}})=0$
where, n is normal unit vector. The upper and the lower interfaces are designated by subscript u and d, respectively.
Due to the complicated interactions among the electric, flow, and temperature fields on the blood flow transport under electrokinetic flow through the porous fat depot. The semicircle shape of the fat depot is sticking to the left of the vertical flow model so the conjugate problem of the fat depot and the blood flow is essential to simulate all of these fields systematically. Therefore, in order to provide information on the interactions of the electric, flow, and temperature fields adequately. Based on the literature reviews [27, 28], the heat transfer between a body and fluid flow is a conjugate problem. But there are few studies on the electrokinetic flow technique with the conjugate approach. In this study, the vertical flow model is used to simulate the electrokinetic flow that occurred by electric force and heat transfer in a specified domain. The electrical voltage and the time which influences the blood flow transport are varied. For the vertical flow model, the electric field, the flow pattern, the pressure field, the vorticity field, and the temperature field with and without the electrokinetic flow are explored under the electrokinetic flow through the porous fat depot.
2.4 Calculation procedure
In this numerical study, the computational scheme is assembled with finite element analysis. A coupled nonlinear set of governing equations, as well as the initial and boundary conditions, are solved using an axisymmetric finite element method (FEM) [29-31]. The finite element method (FEM) is a widely used method for numerically solving differential equations arising in engineering and mathematical modeling. To solve a problem, the FEM subdivides a large system into smaller units, and is then implemented by the construction of a mesh of the object. Finite element modeling is a representation of geometry in terms of a finite number of elements and their connection points, known as nodes. These are the building blocks of a numerical representation of the model. The FEM then uses variational methods from the calculus of variations to approximate a solution by minimizing any associated error functions. The vertical flow model using a collocation method is used to analyze the transient problems and compute blood flow transport under the electrokinetic flow model. FEM is used for solving problems of engineering and mathematical models, and FEM formulation of a boundary value problem eventually results in a system of algebraic equations. FEM then uses variational methods from the calculus of variations to approximate a solution by minimizing any associated error functions. The idea is to choose a finite-dimensional space of candidate solutions and a number of points in the domain, and then select the solution that satisfies the given equation at the collocation points. In order to obtain a good approximation, a fine mesh is specified in the sensitive areas and the axially symmetric model is discretized using a triangular element. The Lagrange quadratic is then used to approximate the electric field, flow field and blood flows across each element for implementation of the blood flow transport. A convergence test is carried out to identify the suitable number of elements required, and the relationship between velocity change as a percentage and the different number of elements is investigated. This convergence test leads to a mesh with approximately 8,000 elements, where the error is less than 0.1%. This means that the accuracy of the result will not gain much benefit from a higher number of elements. Yet only computer memory resources and time will be consumed. It is reasonable to assume that, at this number of elements, the accuracy of the simulation result is independent of the number of elements. In this research area, the concept of biomechanics therapy by electrokinetic flow is systematically studied. This research rests on the assumption that the artery is attached to the skin or a thin layer of skin, and is behind the multidisciplinary researches so that it can be used as implementation guidance for special designs in the biomechanics of heart disease therapy under the electrokinetic flow model.
Blood flow transport under electrokinetic flow through a porous fat deposit in a vertical flow model was systematically proposed. Numerical modeling was combined with an electrostatic model, a flow field model, and a temperature model. In this numerical study, the vertical flow model was symmetrically investigated because many researchers have already numerically studied the horizontal flow model. There are few studies on the vertical flow model due to the complexity of the numerical model. In this numerical study based on the concept of an electrokinetic flow, the electrical voltage and time were varied in a range of 0-20 kV, and 0-10 s, respectively. From previous studies [21], the maximum electric field was increased by increasing the electrical voltage. A graph of the maximum electric field of EHD shows a variable straight line indicating the electrical voltage. The uniform initial temperature of blood ($T_{b}\left(t_{i}\right)$) is 310 K [23] and the uniform initial temperature of the porous fat deposit ($T_{f}\left(t_{i}\right)$) is 25℃ (298 K) [24]. From the numerical study, the first part shows verification of the model for the numerical flow visualization. After that, the blood flow transporting within the vertical flow model was compared with the electric field, flow pattern, pressure field, vorticity field and the temperature field, both with and without the electrokinetic flow. The last numerical result shows an analysis of the blood flow transport in various electrical voltages and time. The vertical flow model within the porous fat deposit was then compared with and without electrokinetic flow.
3.1 Verification of the model
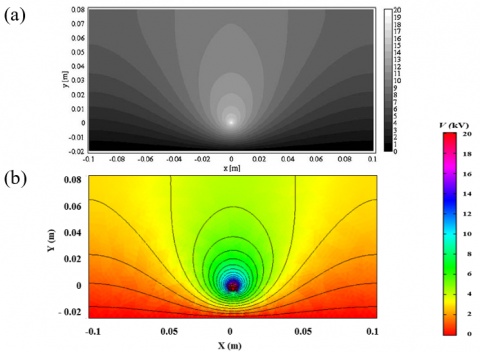
To verify the accuracy of computational fluid dynamics (CFD), the present study was validated against the resulting data of previous studies. The present study was solved using FEM. The voltage distribution and horizontal velocity (u) was 0.5 m/s, and the electrical voltage (V) was 20 kV, as shown in Figure 4. From Figure 4 (a), voltage distribution from the previous study by Ahmedou et al. was studied [32]. The voltage was very high at the discharge electrode and decreased quickly with distance. This typical field demonstrates that the main gradients were close to the discharge electrode. The present study (Figure 4 (b)) is compared in the same condition as from Ahmedou et al. [32]. It can be seen that a similar trend of the voltage distribution has appeared in both cases.
Figure 4. Voltage distribution with V = 20 kV(a) previous study by Ahmedou et al. [32] (b) present study
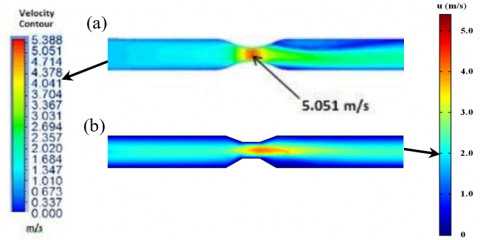
Figure 5. Numerical flow visualization of flow pattern on blood flow within the horizontal 2D model with the time 0.4 s (a) by Koksungnoen et al. [33] (b) by present study
The flow pattern in blood flow in the coronary artery with a time of 0.4 s. is shown in Figure 5. The blood flow is laid at the horizontal axis and the diameter of the coronary artery is 2 mm. In this study, blood flow transport within the horizontal 2D model is compared to the numerical flow visualization of the flow pattern from the previous study of Koksungnoen et al. [33] (Figure 5 (a)), while the present study is presented from FEM (Figure 5 (b)). It can be seen that the blood flow moves from the left to the right and the highest velocity occurs at the center of the horizontal 2D model, which is caused by changing the cross-sectional area into a constricted blood vessel. The numerical flow visualization shows good agreement between the previous study and the present study. In addition, the coronary artery is very small, so the flow visualization of the blood flow has not been experimentally investigated. Verification of the model can instead be compared by using other cases of the numerical model.
3.2 Comparison of blood flow transport without electrokinetic flow within the vertical flow model
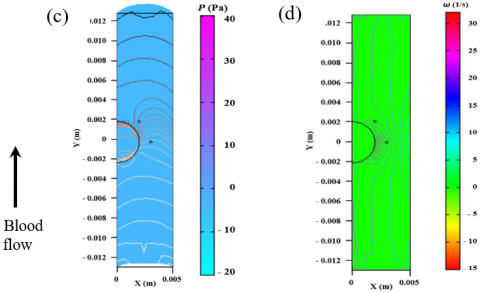
With absent electrokinetic flow, blood flow transport within the vertical flow model is shown in Figure 6. For all cases, the blood flow moves upward through the vertical flow model. In Figure 6 (a), the electric field has not appeared because the electrical voltage was not included in the blood flow. For the vertical flow model, the flow pattern moves from the bottom to the top and the blood flow avoids the semicircle shape (porous fat deposit), as shown in Figure 6 (b). The flow pattern is the way in which blood moves through the vertical flow model and a zero-velocity field (Stagnant zone or dead zone) appears within the porous fat deposit. In fluid dynamics, the developing flow becomes a fully developed flow, where flow characteristics no longer change with increased distance along the pipe. A pressure field is a two-component vector force field, which describes the covariant way the dynamic pressure of individual particles and pressure emerges in systems with a number of closely interacting particles. Vorticity is a pseudovector field that describes the local spinning motion of a continuum near some point. The pressure field and the vorticity field are shown in Figures 6 (c) and 6 (d), respectively. The pressure field and the vorticity field of the blood flow within the vertical flow model indicates turbulence around the interface of the porous fat deposit and the blood flow zone. The blood flow accelerates when passing the narrow zone, so the pressure field is moving rapidly.
Figure 6. Blood flow within the vertical flow model in various values: (a) electric field (b) flow pattern (c) pressure field (d) vorticity with absent electrokinetic flow
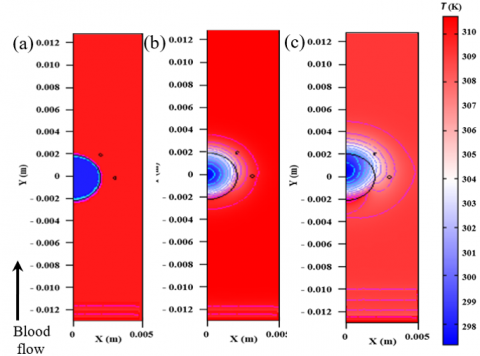
The temperature field of the blood flow within the vertical flow model is shown in Figure 7. For the initial time (Figure 7 (a)), the temperature within vertical flow model and fat deposit are 310 K ($T_{b}\left(t_{i}\right)$) and 298 K ($T_{f}\left(t_{i}\right)$). As time progresses (Figure 7 (b)), the temperature within the vertical flow model is almost constant but the temperature within the porous fat deposit rapidly increases with increasing time. In addition, the blood flow is moved to the top so that the temperature of the bottom zone within the porous fat deposit is higher than at the top zone due to heat being transferred from the blood flow to the porous fat deposit. In the final time period (Figure 7 (c)), the temperature of the bottom zone within the porous fat deposit is close to the temperature within the vertical flow model (temperature of blood). The temperature of the top zone within the porous fat deposit is transferred to the vertical flow model, so the temperature within the vertical flow model is slightly reduced.
Figure 7. Temperature field of blood flow within the vertical flow model in various time: (a) t = 0 s (Initial time) (b) t = 5 s (c) t = 10 s (Final time)
From the above results, the flow pattern, pressure field and vorticity field are different patterns and they are dependent on time. The temperature within the porous fat deposit increases with time and the interface of the fat deposit and blood is more disturbed than at other areas within the vertical flow model due to the conjugate problem effect.
3.3 Comparison of blood flow transport with electrokinetic flow within the vertical flow model
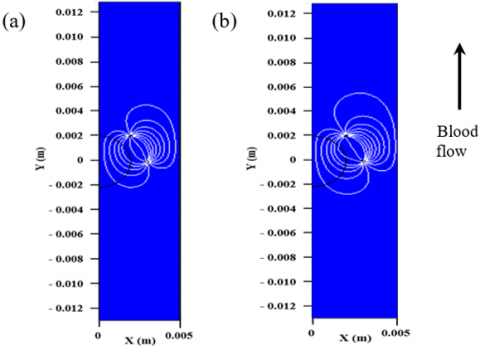
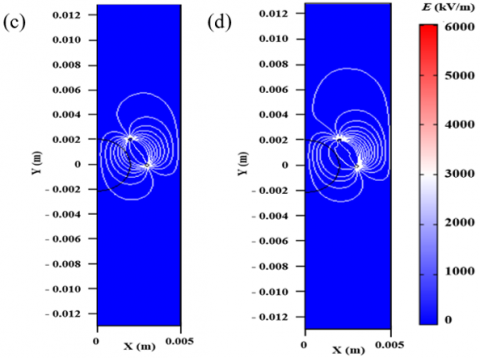
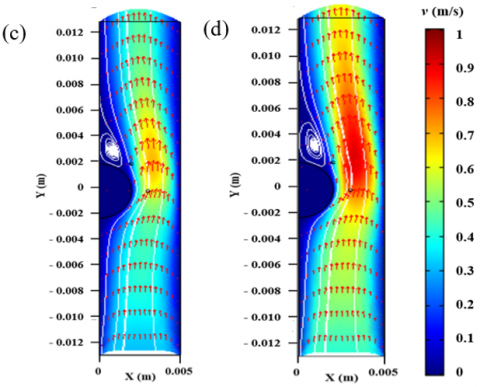
With electrokinetic flow, the electrical voltage is varied in order to consider the electric field, flow pattern, pressure field, vorticity field and temperature field of blood flow transport within vertical flow model. The electric field line in various electrical voltages is shown in Figure 8. When electrical voltage is applied, electric field moves outwardly from the tip of electrode to ground and it is concentrated at both electrode and the ground area. The electric field line in the case of high electrical voltage (V0 = 20 kV) (Figure 8 (d)) is more concentrated than in the case of low electrical voltage (V0 = 5 kV) (Figure 8 (a)). It can be seen that the electric field is more concentrated when a higher electrical voltage is applied and the characteristic of electric field is the same pattern in each case, as shown in (Figure 8 (a-d)). These electric field lines can be used as representative of fluid motion driven by electrophoretic force or electric force so it can change flow visualization. The flow pattern with a deformed shape, streamline and arrow plot is compared in various electrical voltages, as shown in Figure 9. The flow pattern is not same pattern of the electric field but it is induced by the electric field. Within vertical flow model, the flow pattern is moved from bottom to top and the blood flow is avoided by porous fat depot (semicircle shape), as shown in Figure 9 (a-d). In all cases, stagnant zone appears within porous fat depot and the stagnant zone appears at left of blood flow behind fat depot, and blood flow is slowly moved. The stagnant zone in case of high electrical voltage (V0 = 20 kV) (Figure 9 (d)) is lower than in case of low electrical voltage (V0 = 5 kV) (Figure 9 (a)). The high electrical voltage can reduce t stagnant zone within the vertical flow model so blood flow is increased at the destination.
Figure 8. Electric field within the vertical flow model under electrokinetic flow in various electrical voltage (V0): (V0 = 5 kV (b) V0 = 10 kV (c) V0 = 15 kV (d) V0 = 20 kV with electric field line
Figure 9. Flow pattern of blood flow under electrokinetic flow within the vertical flow model (a) V0 = 5 kV (b) V0 = 10 kV (c) V0 = 15 kV (d) V0 = 20 kV with deformed shape, streamline and arrow plot
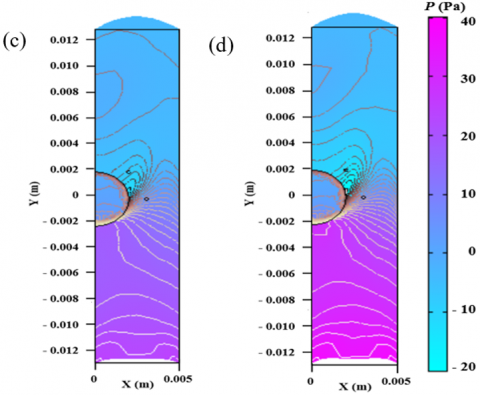
Figure 10. Pressure field of blood flow under electrokinetic flow within the vertical flow model (a) V0 = 5 kV (b) V0= 10 kV (c) V0= 15 kV (d) V0= 20 kV with deformed shape and contour line
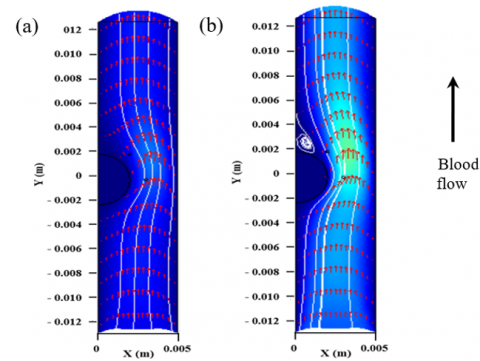
The highest velocity has occurred at the narrow zone and the pressure field with a deformed shape and contour line is compared in various electrical voltages, as shown in Figure 10. The pressure outlet boundary condition defines no viscous stress (Eq. (17)). The pressure field within the vertical flow model is influenced by the electric field. The pressure field is moved from tbottom to top but the left of pressure is lower than right when it passes the semicircle zone, as shown in Figure 10 (a-d). The pressure field in case of low electrical voltage (V0= 5 kV) (Figure 10 (a)) is lower than in case of high electrical voltage (V0= 20 kV) (Figure 10 (d)). Due to high electrokinetic flow intensity influences disturbance resulting from the pressure, the field is more concentrated. The vorticity field with a contour line is compared in various electrical voltages, as shown in Figure 11. The vorticity field within vertical flow model is influenced by electric field and it is turbulence behind porous fat depot, as shown in Figure 11 (a-d). The vorticity field in case of high electrical voltage (V0 = 20 kV) (Figure 11 (d)) is more turbulent than in case of low electrical voltage (V0 = 5 kV) (Figure 11 (a) due to vorticity field is more concentrated when high electrical voltage. The vorticity field of blood flow within vertical flow model is turbulence around interface of the fat depot and blood zone. The blood flow is accelerated when passing the narrow zone so vorticity field is moving rapidly.
Figure 11. Vorticity field of blood flow under electrokinetic flow within the vertical flow model (a) V0 = 5 kV (b) V0 = 10 kV (c) V0= 15 kV (d) V0 = 20 kV with contour line
The temperature field with an arrow plot and contour line is compared in various electrical voltages, as shown in Figure 12. In all cases, the temperature within the vertical flow model is still 310 K and the temperature is disturbed by electrokinetic flow around porous fat depot area. Figure 12 (a - d) is fixed V0= 10 kV and temperature field of blood flow under electrokinetic flow in various time (t). The temperature within porous fat depot is increased by increasing times and time is varied from 2 to 8 s by increments of 2 s. When time progresses, heat from blood flow transfers within porous fat depot so temperature within the porous fat depot is increased. Increasing the times much more speed up the temperature of porous fat depot. Based on complexity of interface problem, heat transfer and blood flowing past it is a conjugate transport phenomenon. The heat transfer between porous fat depot and a fluid flowing past it is a conjugate problem because heat transfer inside body is governed by elliptical Laplace equation or by parabolic differential equation, while heat transfer inside fluid is governed by elliptical Navier-Stokes equation or by parabolic boundary layer equation. The solution to such a problem gives temperature and heat flux distributions on interface, and there is no need for a heat transfer coefficient. The inlet blood flow is defined from bottom to top direction, so temperature is not steady all of porous fat depots so heating zone in bottom zone of fat depot is higher than top zone. In addition, temperature field of blood flow under electrokinetic flow in various electrical voltage (V0) is increased by increments of 5 kV and time is fixed at 10 s (final time), as shown in Figure 12 (e - h). Within porous fat depot, heating zone in bottom zone is higher than top zone and temperature in case of high electrical voltage (V0 = 20 kV) (Figure 12 (h)) is more turbulence than in case of low electrical voltage (V0 = 5 kV) (Figure 12 (e)). The temperature field of V0= 5, 10, 15, and 20 kV are showed in Figure 12 (e - h), respectively. It can be seen that electrokinetic flow can generate heating zone within porous fat depot.
Figure 12. Temperature field of blood flow under electrokinetic flow within the vertical flow model with arrow plot and contour line (a) t = 2 s in V0 = 10 kV (b) t = 4 s in V0 = 10 kV (c) t = 6 s in V0 = 10 kV (d) t = 8 s in V0 = 10 kV (e) V0= 5 kV in final time (f) V0= 10 kV in final time (g) V0= 15 kV in final time (h) V0 = 20 kV in final time
From above results, comparison between Figure 6 (a) and Figure 8, electric field has appeared and it is moved from electrode to ground when the electrical voltage is applied. The electric field can pass through from vertical flow model to porous fat depot due to conjugate approach. The electric field intensity is not affected by interface between blood flow and fat depot. The flow pattern is moved from bottom to top and blood flow is avoided by semicircle shape (porous fat depot). The stagnant zone appeared at left of the blood flow behind fat depot and blood flow is slowly moved. When an electric force is applied (Figure 9), the stagnant zone is more reduced than in case of no electrical voltage (Figure 6 (b)). The high acceleration has appeared at narrow zone when high electric field intensity. The interface area between blood flow and porous fat depot is considered for pressure field. In case of no electric field, pressure field is different from in case of the electric field, as shown in Figure 6 (c) and Figure 10. The pressure field is disturbed and swirled in case of electric field but in case of no electric field, pressure field is moved pass through to downstream. It can be seen that electric field can trap the fluid flow and interface area is turbulent by electrokinetic. The vorticity field in the case of electric field and no electric field are similar trends, as shown in Figure 6 (d) and 11. The vorticity field is disturbed interface area between blood flow and fat depot. The strength of vorticity field is increased with electric field increasing.
The temperature within porous fat depot is increased by increasing times and electrical voltage, as shown in Figure 7 and 12. The temperature of top zone within porous fat depot is transferred to vertical flow model so temperature within the vertical flow model is slightly reduced. It can be seen that the blood flow is moved upward through vertical flow model and it is avoided the narrow semicircle shape (porous fat depot). The electric field is increased with electrical voltage increasing. The flow pattern, pressure field, vorticity field, and temperature field are not the same pattern as electric field but they are induced by electric field. The electrokinetic flow can more induce the flow pattern, pressure field, vorticity field, and temperature field than no electric field so porous fat depot is disturbed within vertical flow model.
3.4 Analysis of blood flow transport with electrokinetic flow within the vertical flow model
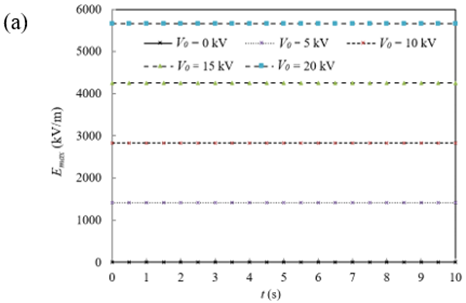
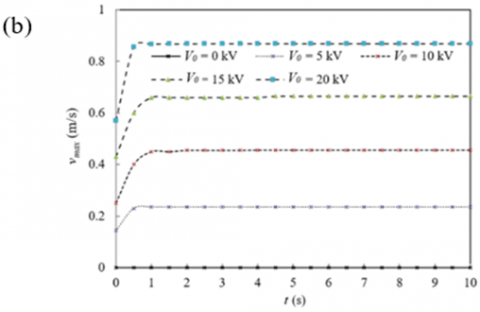
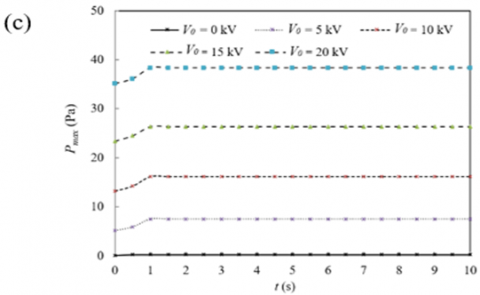
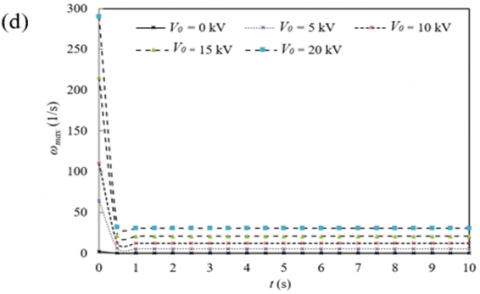
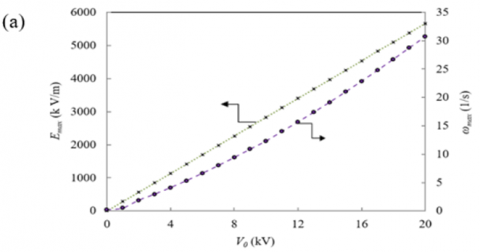
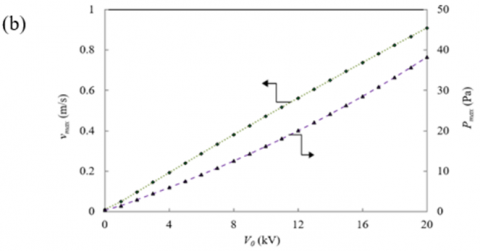
The electrokinetic flow within vertical flow model is analyzed at max values in each case. The electrical voltage is varied from 0 – 20 kV by increments of 5 kV and time (t) is varied from 0 – 10 s by increments of 0.5 s. Figure 13 shows the development of electrokinetic flow at maximum electric value (Emax), maximum velocity (vmax), maximum pressure (Pmax), maximum vorticity (ωmax), maximum temperature (Tmax) of blood flow transport. The maximum of all values is increased with electrical voltage increasing. The maximum electric value (Emax) does not depend on time, as shown in Figure 13 (a). At initial time (t = 0 s), maximum velocity (vmax) is low and it is clearly increased with time increasing, as shown in Figure 13 (b). After that, maximum velocity is constant until final time (t = 10 s). For Figure 13 (c), the maximum pressure (Pmax) is low at initial time (t = 0 s) and it is rapidly increased with time increasing. After progress (t = 1 s) until final time (t = 10 s), the maximum pressure is constant. The vorticity has a high value in initial time (t = 0 s) and it is rapidly decreased after initial time (t = 0.5 s), as shown in Figure 13 (d). After that, the vorticity is constant until final time (t = 10 s). The normal human body temperature (normothermia, euthermia) is typical temperature range found in humans. The normal human body temperature range is typically stated as 97.7 – 99.5°F (309.5 – 310.5 K). Body temperature is kept in normal range by thermoregulation, in which adjustment of temperature is triggered by central nervous system. Blood temperature is usually around 98.6℉ (310 K). From Figure 13 (e), the maximum temperature (Tmax) is increased with time increasing. When initial time (t = 0 s), temperature of initial blood is 310 K and initial temperature of of porous fat depot is 298 K. In case of no electric field, the initial force is little influence with heat transfer and heat transfer from porous fat depot cannot pass through interface zone between blood and fat depot. So, the maximum temperature has appeared within blood flow. With applied high voltage (V0 = 5 – 20 kV), the maximum temperature has appeared within porous fat depot. When time progresses, heat within porous fat depot is transferred to vertical blood flow so temperature within porous fat depot is rapidly increased. After that, heat transfer becomes lower when temperature of porous fat depot closest to temperature of blood. It can be seen that electrical voltages increasing much more speed up surface temperature of depot to close to temperature of blood. In all cases, maximum values have appeared at V0 = 20 kV and t = 10 s. Figure 14 shows relationship of maximum values in various electrical voltage from 0 to 20 kV by increments of 1. The maximum electric value (Emax) has appeared at the tip of electrode and maximum vorticity (ωmax) has appeared at interface of fat depot and blood zone. A variable straight line for maximum electric value and electrical voltage (Emax$\propto$V0) and maximum vorticity is proportional to square of electrical voltage (ωmax$\propto$V02), as shown in Figure 14 (a). The maximum velocity (vmax) has appeared at narrow zone of vertical flow model and maximum pressure (Pmax) has appeared between electrode and ground zone. A variable straight line for the maximum velocity and electrical voltage (vmax $\propto$V0) and the maximum pressure is proportional to the square of electrical voltage (Pmax $\propto$V02), as shown in Figure 14 (b).
Figure 13. Development of blood flow under electrokinetic flow within the vertical flow model at the maximum value with various times when V0 = 0, 5, 10, 15 and 20 kV (a) Electric value (b) Velocity (c) Pressure (d) Vorticity (e) Temperature
Figure 14. Consider the blood flow under electrokinetic flow within the vertical flow model in various electrical voltage when V0= 20 kV and t = 10 s (a) Comparison between maximum electric value and maximum vorticity (b) Comparison between maximum velocity and maximum pressure
Figure 15. Consider velocity profile of blood flow in various electrical voltage along X-axis of vertical flow model
The velocity profile of blood flow in various electrical voltage is considered along the X-axis of the vertical flow model, as shown in Figure 15. The electrical voltage is varied from 0 to 20 kV by increments of 5 and the coordinate between (0, 0) and (0.005, 0) is the straight line of velocity. From the straight line of coordinates (0, 0) and (0, 0.002 m), the zero velocity has appeared because this position is a porous fat depot. A porous medium or a porous material is a material containing pores (voids). The skeletal material is usually solid and the skeletal portion of the material is often called "matrix" or "frame". The pores are typically filled with a fluid (liquid or gas). In this study, the skeletal is t fat and pores have filled the blood. At V0= 0 kV, the low-velocity profile of the blood flow has appeared all along with the crossflow. A parabolic pattern has appeared and its direction is towards the downstream when applied high voltage. It can be seen from the Figure that the influences of the electrokinetic flows as well as electric field distort the velocity profile so the parabolic pattern is not symmetrical.
With respect to applied high voltage, high electrical voltage (V0 = 20 kV) can induce more space charge density to ground than low electrical voltage (V0 = 5 kV) resulting in the higher velocity of blood flow transport. The maximum parabolic pattern of velocity is increased with electrical voltage increasing. It can be seen that the blood flow transport under electrokinetic flow can increase the maximum values (Emax, vmax, ωmax, Pmax) in various electrical voltage and times so it can influence the temperature within blood flow and within porous fat depot.
3.5 Analysis of blood flow transport within the porous fat depot with and without electrokinetic flow
From above results, electrokinetic flow is composed of electric field and flow field and it can accelerate the blood flow transportation. The flow pattern within fat depot is disturbed by electrokinetic flow around the fat depot area so high velocity within the fat depot is increased. The flow pattern within fat depot is increased with electric field increasing, as shown in Figure 16. The fat depot is porous medium and it is composed of blood and fat. The fluid flow within fat depot is induced from the flow pattern within vertical flow model. In case of without electrokinetic flow, fluid flow from Figure 16 (a) is affected by flow pattern from Figure 6 (b). The blood flow within vertical flow model is slowly moved, resulting in occurrence of laminar flow is appeared within porous fat depot. With electrokinetic flow, fluid flow within porous fat depot is increased with electrical voltage increasing. The fluid flow from Figure 16 (b - e) is affected by flow pattern from Figure 9 (a - d), respectively. The maximum velocity has appeared at bottom zone of porous fat depot due to inlet velocity is moved from bottom (upstream) to top (downstream). From conjugated approach effect, fluid flow can move out from fat depot through blood flow. The fluid flow moves out at the right zone of fat depot because it is close to the electrode and ground area so electrokinetic flow can induce the fluid flow within porous fat depot.
Figure 16. Fluid flow within the porous fat depot under electrokinetic flow with various electrical voltage (a) V0= 0 kV (b) V0= 5 kV (c) V0= 10 kV (d) V0 = 15 kV (e) V0 = 20 kV with streamline and arrow plot
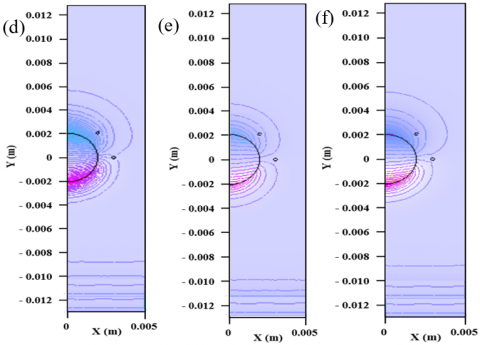
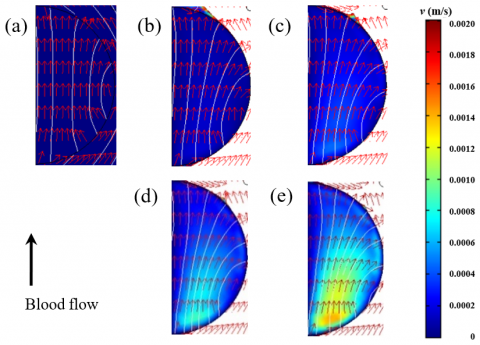
Figure 17. Temperature field within the porous fat depot under electrokinetic flow with various times and electrical voltage with arrow plot and contour line (a) t = 2 s in V0 = 20 kV (b) t = 4 s in V0 = 20 kV (c) t = 6 s in V0 = 20 kV (d) t = 8 s in V0 = 20 kV (e) V0= 0 kV in final time (f) V0= 5 kV in final time (g) V0= 10 kV in final time (h) V0 = 15 kV in final time (i) V0 = 20 kV in final time
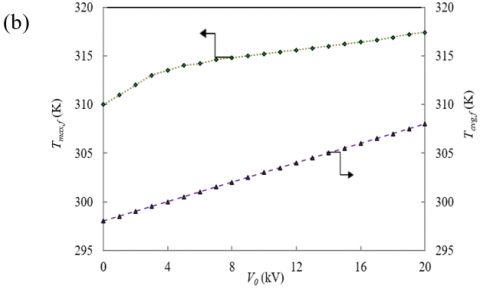
The initial temperature within vertical flow model and within porous fat depot is 310 K and 298 K, respectively. Under electrokinetic flow, the blood flow transport within vertical flow can increase heat transfer within fat depot. The temperature within fat depot is disturbed by electrokinetic flow around fat depot area. The fluid flow within porous fat depot is moved, resulting in the occurrence of heat transfer within porous fat depot. Furthermore, increasing times speed up the temperature of porous fat depot. The temperature field within porous fat depot under electrokinetic flow with various times and electrical voltage is shown in Figure 17. The temperature within porous fat depot is increased by increasing the times and electrical voltage is fixed at 20 kV, as shown in Figure 17 (a - d). The temperature field is affected by fluid flow within porous fat depot under electrokinetic flow. The fluid flow within porous fat depot is increased with electrical voltage increasing, resulting the heat transfer within porous fat depot is increased. At final time (t = 10 s), the temperature field from Figure 17 (e - i) is affected by fluid flow from Figure 16 (a - e), respectively. Figure 18 shows relationship of maximum value (maximum velocity (vmax,f), maximum temperature (Tmax,f), average values (average velocity (vavg,f) and average temperature (Tavg,f)) in various electrical voltage from 0 to 20 kV by increments of 1. The maximum velocity (vmax,f) and maximum temperature (Tmax,f) has appeared at e bottom zone of porous fat depot. An average is a single number taken as representative of a list of numbers and average values (average velocity (vavg,f) and average temperature (Tavg,f)) refers to arithmetic mean, the sum of numbers divided by how many numbers are being averaged. The maximum value (maximum velocity (vmax,f) and average values (average velocity (vavg,f) are proportional to square of electrical voltage or vmax,f $\propto$vavg,f $\propto$V02, as shown in Figure 18 (a). Due to velocity within porous fat depot is supported under electrokinetic flow within vertical flow so velocity within porous fat depot is clearly increased with electrical voltage increasing. For t = 10 s, temperature within porous fat depot is supported by velocity within porous fat depot so maximum temperature (Tmax,f) and average temperature (Tavg,f) are gradually increased with electrical voltage increasing. By specific heat capacity of porous fat depot, variations of maximum temperature (Tmax,f) is treated by parabolic function and average temperature (Tavg,f) are a variable straight line (Tavg,f $\propto$V0), as shown in Figure 18 (b).
Coronary heart disease involves the reduction of blood flow to heart muscle due to plaque in corona heart. The plaque deposits are stick at artery wall so the velocity and pressure of blood flow are low. But pressure is the main factor for fluid-driven. Fats that circulate in blood are called lipids. Cholesterol and triglycerides are both lipids, but high levels of cholesterol can increase your risk of heart disease. With high cholesterol, fatty deposits can develop in blood vessels. Eventually, these deposits grow, making it difficult for enough blood to flow through arteries. This research shows electric field, flow field, pressure field, vorticity field, and temperature field in blood flow transport through porous fat depot under electrokinetic flow model. The aim objective of this research is to increase the blood flow transport within vertical flow model. As explained before, electric field is applied by electrical voltage. The flow pattern, pressure field, vorticity field, and temperature field of blood flow transport are influenced by electric field. In all cases, blood flow transport is moved from bottom to top through the vertical flow model. The electric field can be used as representative of fluid motion driven by electrophoretic force so electrophoretic force can change the flow pattern, pressure field, vorticity field, and temperature field. The electric value, velocity, pressure, vorticity are increased with electrical voltage increasing and they are independent with time but temperature is dependent on time. The temperature within porous fat depot is increased with electrical voltage and time increasing. Within vertical flow model, a variable straight line for maximum electric value (Emax), maximum velocity (vmax) and electrical voltage (V0) (Emax$\propto$vmax$\propto$V0). The maximum vorticity (ωmax) and maximum pressure (Pmax) is proportional to the square of electrical voltage (V02) or ωmax$\propto$Pmax$\propto$V02). Within porous fat depot, maximum velocity (vmax,f) and average values (average velocity (vavg,f) are proportional to square of electrical voltage or vmax,f$\propto$vavg,f $\propto$V02. Finally, influence of blood flow transport under electrokinetic flow can induce the heating zone within porous fat depot. The heating zone is used to heat up the fat depot resulting in the fat depot is unstable. The fat depot is an obstacle to blood flow. The electrokinetic flow can implement to increase the convective heat transfer. It can be seen that idea behind this research can be used as implementation guidance for special design in the future for damage to the fat depot from the coronary artery.
Figure 18. Consider blood flow under electrokinetic flow the porous fat depot in various electrical voltage (a) Comparison between maximum velocity and average velocity (b) Comparison between maximum temperature and average temperature in final time (t = 10 s)
The numerical results were carried out to study the influences of blood flow transport in a vertical flow model under electrokinetic flow. This research rests on the assumption that the artery is attached to the skin or a thin layer of the skin, and the following are the conclusions of this research:
1. The electric field is more concentrated when a higher electrical voltage is applied. The flow pattern, pressure field, vorticity field and temperature field are induced by the electric field. The electric value, velocity, pressure and vorticity all increase with increasing electrical voltage and the temperature increases with increasing electrical voltage and time.
2. Electrokinetic flow can induce the temperature within the blood flow and within the porous fat deposit, so the heating zone is enhanced.
From the mechanism of increased flow, electrokinetic flow has been investigated for biomechanical therapy. It can implement flow transportation in blood vessel dilation under electrokinetic flow. The idea behind this multidisciplinary research can be used as implementation guidance for special designs of biomechanical heart disease therapy in the future.
This study was supported by Thailand Science Research and Innovation Fundamental Fund (Project No. :66082) and the Program Management Unit for Human Resources & Institutional Development, Research and Innovation, NXPO (grant number B05F630092).
|
b |
ion mobility $\left(m^{2} / \mathrm{V} . \mathrm{s}\right)$ |
|
$C_{p}$ |
specific heat capacity (J/K) |
|
D |
electric flux density $\left(\mathrm{C} / \mathrm{m}^{2}\right)$ |
|
E |
electric field intensity $(\mathrm{V} / \mathrm{m})$ |
|
$f_{E}$ |
electrophoretic force $\left(\mathrm{C} / \mathrm{m}^{2} \cdot \mathrm{s}\right)$ |
|
$g$ |
gravity $\left(\mathrm{m} / \mathrm{s}^{2}\right)$ |
|
$h_{c}$ |
convective heat transfer $\left(\mathrm{W} / \mathrm{m}^{2} \cdot \mathrm{K}\right)$ |
|
$J$ |
current density $\left(\mathrm{A} / \mathrm{m}^{2}\right)$ |
|
$k$ |
thermal conductivity (W/m.K) |
|
$n$ |
unit normal vector |
|
$P$ |
pressure $\left(\mathrm{N} / \mathrm{m}^{2}\right)$ |
|
$q$ |
space charge density $\left(\mathrm{C} / \mathrm{m}^{3}\right)$ |
|
$T$ |
temperature (K) |
|
$T_{\alpha}$ |
ambient temperature (K) |
|
$\nabla \mathrm{T}$ |
temperature gradient (K) |
|
$t$ |
time (s) |
|
$u$ |
horizontal velocity (m/s) |
|
$v$ |
vertical velocity (m/s) |
|
$V$ |
electrical voltage (V) |
|
$\mathrm{X}, \mathrm{Y}$ |
axis |
|
Greek symbols |
|
|
$\varepsilon$ |
dielectric permittivity (F/m) |
|
$\varepsilon_{T}$ |
relative permittivity (F/m) |
|
$\eta$ |
kinematics viscosity $\left(m^{2} / \mathrm{s}\right)$ |
|
$\mu$ |
viscosity $(\mathrm{kg} / \mathrm{m} . \mathrm{s})$ |
|
$\rho$ |
density $\left(\mathrm{kg} / \mathrm{m}^{3}\right)$ |
|
$\varphi$ |
porosity (-) |
|
$\kappa$ |
permeability $\left(m^{2}\right)$ |
|
$\sigma$ |
electric conductivity (s/m) |
|
Subscripts |
|
|
b |
blood |
|
d |
lower |
|
eff |
effective |
|
f |
fat |
|
i |
initial |
|
u |
upper |
|
0 |
tip of electrode, initial |
|
Superscript |
|
|
T |
matrix transpose |
[1] Donald, M., Martin, G., Alexa, F.B., Daniel, L. (1999). Lifetime risk of developing coronary heart disease. The Lancet, 353(9147): 89-92. https://doi.org/10.1016/S0140-6736(98)10279-9
[2] Xuan, X. (2008). Joule heating in electrokinetic flow. Electrophoresis, 29(1): 33-43. https://doi.org/10.1002/elps.200700302
[3] Benoit, G.B. (2008). The developmental genetics of congenital heart disease. Nature, 451: 943-948. https://doi.org/10.1038/nature06801
[4] Malvè, M., García, A., Ohayon, J., Martínez, M.A. (2012). Unsteady blood flow and mass transfer of a human left coronary artery bifurcation: FSI vs. CFD. International Journal of Heat and Mass Transfer, 39: 745-751. https://doi.org/10.1016/j.icheatmasstransfer.2012.04.009
[5] Lett, H.S., Blumenthal, J.A., Babyak, M.A., Strauman, T.J., Robins, C., Sherwood, A. (2005). Social support and coronary heart disease: Epidemiologic evidence and implications for treatment. Psychosomatic Medicine 67(6): 869-878.
[6] Kai, C.W., Helmut, D. (2010). Cell therapy for the treatment of coronary heart disease: A critical appraisal. Nature Reviews Cardiology, 7: 204-215.
[7] Fillmore, N., Mori, J., Lopaschuk, G.D. (2014). Mitochondrial fatty acid oxidation alterations in heart failure. Ischaemic Heart Disease and Diabetic Cardiomyopathy, British Journal of Pharmacology, 171: 2080-2090. https://doi.org/10.1111/bph.12475
[8] Paul, M., Robert, M.C., Samuel, G., Daniel, W.J., Sandra, J.T., Jackson, T.W., Paul, K.W. (2018). Potential U.S. population impact of the 2017 ACC/AHA high blood pressure guideline. Journal of the American College of Cardiology, 71(2): 109-118. https://doi.org/10.1161/CIRCULATIONAHA.117.032582
[9] Su, C.Q., Wang, W.S., Liu, X., Deng, Y.D. (2014). Simulation and experimental study on thermal optimization of the heat exchanger for automotive exhaust-based thermoelectric generators. Case Studies in Thermal Engineering, 4: 85-91. https://doi.org/10.1016/j.csite.2014.06.002
[10] Jiewen D., Hongwei, Q., Jianqing, Lin., Guoxin, Y., Qin, D. (2016). Analysis of the movement characteristics of corona winds during needle-plate discharge. International Journal of Heat and Technology, 34(4): 574-580. https://doi.org/10.18280/ijht.340404
[11] Ayuttaya, S.S.N. (2020). Influence of the jet air flow with inclined plate under corona discharge. Science & Technology Asia, 25(2): 47-62.
[12] Ayuttaya, S.S.N. (2017). A review of electrohydrodynamics application (based on the mechanism characteristic). CRMA Journal, 15: 37-59.
[13] Heris, S.Z., Nassan, T.H., Noie, S.H., Sardarabadi, H., Sardarabadi, M. (2013). Laminar convective heat transfer of Al2O3/water nanofluid through square cross-sectional duct. International Journal of Heat and Fluid Flow, 44: 375-382. https://doi.org/10.1016/j.ijheatfluidflow.2013.07.006
[14] Yilma, T.B., Sheam-Chyun, L., Feng, C.L. (2017). Flow characteristics of a two-stage EHD gas pump in a circular pipe. IEEE Transactions on Industry Applications, 53(3): 2461-2470. https://doi.org/10.1109/TIA.2017.2674616
[15] Ermakov, A., Salakhov, R., Khismatullin, R., Idiatullin, B. (2021). Development and research of the adaptive cooling system with an electric pump. International Journal of Heat and Technology, 39(2): 574-580.
[16] Vladislav, D., Shorong, L., Steven, J. (2000). Capillary electrophoresis on microchip. Electrophoresis, 21(1): 41054.
[17] Ning, B., Zhan, Y., Lu, C. (2008). Microfluidic electroporative flow cytometry for studying single-cell biomechanics. Analytical Chemistry, 80: 7714-7719. https://doi.org/10.1021/ac801060t
[18] Betsy, V.H., Darryl, G.T., Yasin, Y.D. (2009). A three-dimensional biomechanical evaluation of quadriceps and hamstrings function using electrical stimulation. IEEE Transactions on Neural Systems and Rehabilitation Engineering, 17(2): 167-175.
[19] Hesam, B., Vaishnavi, S., Zhao, Z., Frank, G., Elizabeth, C., Jeannine, S.S., Webster, L.S., Chenming, Z., Masoud, A. (2016). The impact of sphingosine kinase inhibitor-loaded nanoparticles on bioelectrical and biomechanical properties of cancer cells. Lap on a Chip, 16: 188-198.
[20] Ulbrich, T.L.V., Southgate, D.A.T. (1991). Coronary heart disease: Seven dietary factors. The Lancet, 338(8773): 985-992. https://doi.org/10.1016/0140-6736(91)91846-M
[21] Saneewong Na Ayuttaya, S., Chaktranond, C., Rattanadecho, P. (2013). Numerical analysis of electricforce influence on heat transfer in a channel flow (theory based on saturated porous medium approach). International Journal of Heat and Mass Transfer, 64: 361-374. https://doi.org/10.1016/j.ijheatmasstransfer.2013.04.010
[22] Ko, T.H., Ting, K., Yeh, H.C. (2007). Numerical investigation on flow fields in partially stenosed artery with complete bypass graft: An in vitro study. International Communications in Heat and Mass Transfer, 34(6): 713-727. https://doi.org/10.1016/j.icheatmasstransfer.2007.03.010
[23] Wessapan, T., Srisawatdhisukul, S., Rattanadecho, P. (2011). Numerical analysis of specific absorption rate and heat transfer in the human body exposed to leakage microwave power at 915 MHz and 2450 MHz. ASME Journal of Fluids Engineering, 133: 051101-1–051101-13.
[24] Keangin, P., Vafai, K., Rattanadecho, P. (2013). Electromagnetic field effects on biological materials. International Journal of Heat and Mass Transfer, 65: 389-399.
[25] Griffiths, D.J. (1999). Introduction to Electrohydrodynamics. Prentice Hall International, Inc. New Jersey, 54.
[26] Wessapan, T., Rattanadecho, P. (2020). Acoustic streaming effect on flow and heat transfer in porous tissue during exposure to focused ultrasound. Case Studies in Thermal Engineering, 21: 100670. https://doi.org/10.1016/j.csite.2020.100670
[27] Hsiao, K.L. (2016). Stagnation electrical MHD nanofluid mixed convection with slip boundary on a stretching sheet. Applied Thermal Engineering, 98(5): 850-861.
[28] Ishrat, Z., Md, A.A. (2018). Effect of conjugate heat transfer on flow of nanofluid in a rectangular enclosure. International Journal of Heat and Technology, 36(2): 397-405. https://doi.org/10.18280/ijht.360203
[29] Feulvarch, E., Bergheau, J.M. (2007). An implicit fixed-grid method for the finite-element analysis of heat transfer involving phase changes. Numerical Heat Transfer, Part B: Fundamentals, 51(6): 585-610.
[30] Sair, S., Oushabu, A., Kammouni, A., Tanane, O., Abboud, Y., Oudrhiri, F., Laachachi, A., E.Bouari, A. (2017). Effect of surface modification on morphological, mechanical and thermal conductivity of hemp fiber: Characterization of the interface of hemp –polyurethane composite. Case Studies in Thermal Engineering, 10: 550-559. https://doi.org/10.1016/j.csite.2017.10.012
[31] Jinao, Z., Sunita, C. (2019). Real-time computation of bio-heat transfer in the fast explicit dynamics finite element algorithm (FED-FEM) framework. Numerical Heat Transfer, Part B: Fundamentals, 75(4): 217-238.
[32] Ahmedou, S.O., Rouaud, O., Havet, M. (2009). Assessment of the electrohydrodynamic drying process. Food Bioprocess Technol, 2: 240-247. https://doi.org/10.1007/s11947-008-0078-6
[33] Koksungnoen, S., Rattanadecho, P., Wongchadakul, P. (2018). 3D numerical model of blood flow in the coronary artery bypass graft during no pulse and pulse situations: Effects of an anastomotic angle and characteristics of fluid. Journal of Mechanical Science and Technology, 32(9): 4545-4552. https://doi.org/10.1007/s12206-018-0851-z