Yanhong Tang* | Xiangyang Deng
© 2021 IIETA. This article is published by IIETA and is licensed under the CC BY 4.0 license (http://creativecommons.org/licenses/by/4.0/).
OPEN ACCESS
The global warming and soaring energy consumption have motivated many scholars and policymakers to pursue energy conservation and environmental improvement. As a renewable cleaning energy, geothermal resources have been actively developed in recent years. Taking six geothermal projects in Hunan, China as examples, this paper determines the input and output indices for each project. The input indices cover both economic and environmental dimensions. Then, the authors deeply explored how much geothermal resource quantity, single-well yield, total investment, and annual cost investment influence dynamic investment recovery period, coal reduction of summer operation, coal reduction of winter operation, environmental protection and energy saving, standard coal reduction, and emission reduction. The results show that total investment, single-well yield, and total investment have significant effects on economic indices, while geothermal resource quantity, single-well yield, and total investment have significant effects on environmental indices.
geothermal resources, economy and environment, correlation analysis
As the globe gets warmer in recent years, more and more people become aware of environmental and energy problems. As a renewable cleaning energy, geothermal resources have achieved unprecedented development. The ground source heat pump (GSHP) is now widely recognized as an effective technique to use shallow geothermal energy for air conditioning.
The performance of a geothermal project could be affected by various factors of the local region, such as climate, geology, and geothermal condition. To design effective GSHP systems, many scholars have studied how different factors affects system performance [1, 2]. Some discovered that the seasonal variation in ambient temperature often leads to the imbalance between cooling and heating loads of buildings [3]. When the GSHP system is implemented in buildings with a large cooling load in hot regions, more energy is injected into the ground than the energy absorbed from the ground each year. The energy accumulated in the ground will push up surface temperature, and, with the elapse of time, dampen system performance.
Zhang et al. [3] researched five GSHP systems for residential buildings in hot summer and cold winter regions, and looked at the changes of the coefficient of performance (COP) and energy efficiency ratio (EER) of the heat pumps. Casasso et al. [4] evaluated the hallow geothermal potential of Cerkno with a climate-based method, and discovered that the COP of the GSHP system has a strong correlation with the annual mean temperature and the number of heating days.
The evaluation of geothermal potential is critical to the planning and installation of GSHP systems. By the geothermal technology of the application, shallow geothermal resources can be divided into closed loop and open loop systems [5]. Relying on geographic information system (GIS), Viesi et al. [6] assessed and plotted the shallow geothermal potential in mountains and valleys. The geothermal potential of the GSHP system depends on temperature and water availability [7].
In practical applications, the thermal performance of the GSHP system is susceptible to the heat transfer process, which is highly sensitive to the surrounding conditions (e.g., hydrogeology, geology, and geothermal condition) [8]. This opinion is agreed by many scholars [9-11]. Luo et al. [12] evaluated three different GSHP systems in Wuhan, and demonstrated that the field conditions determine the potential of these systems.
Focusing on the external factors of geothermal projects, the above studies show that the performance of the geothermal system depends on climate, geology, and geothermal condition. However, few scholars have studied the economic and environmental factors affected by geothermal projects, starting from the projects themselves [13-15].
Therefore, this paper intends to measure how geothermal projects affect economy and environment. For this purpose, six geothermal projects were selected from Hunan Province, which boasts a huge reserve of geothermal resources. Recent years has seen this province launching a series of geothermal development projects. To realize the sustainable development of renewable resources, it is critical to explore how to effectively utilize the geothermal resources in Hunan.
The remaining parts of this paper are arranged as follows: Part 2 summarizes the distribution and utilization of geothermal resources in Hunan; Part 3 introduces the input and output indices of the six geothermal projects; Section 4 discusses how much geothermal resource quantity, single-well yield, total investment, and annual cost investment influence dynamic investment recovery period, coal reduction of summer operation, coal reduction of winter operation, environmental protection and energy saving, standard coal reduction, and emission reduction; Section 5 offers suggestions on the effective development of geothermal resources in Hunan.
Hunan Province has a wealth of geothermal resources, and thus an immense potential of geothermal development. Survey data show that geothermal resources are distributed across the 14 prefectures of the province. The annual exploitable amount of shallow geothermal resources alone is equivalent to 149.9128 million tons of standard coal (TCE), that of medium-deep geothermal resources (hydrothermal type) is equivalent to 352,700 TCE, and that of deep geothermal resources (hot dry rock) is equivalent to 237 million TCE.
Currently, the shallow geothermal resources of Hunan are the most suitable for mass development and utilization. The medium-deep geothermal resources have a small potential and a high difficulty in development. The deep geothermal resources are still being surveyed. The time is not yet ripe for developing deep geothermal resources.
The abundant shallow geothermal resources are distributed widely across Hunan. The huge reserve and high utilization ratio make the resources very suitable for development and utilization. The shallow geothermal resources can be divided into four systems:
(1) Groundwater GSHP system
According to survey data, Changsha, Yueyang, Changde, Zhuzhou, and Yiyang are the only five prefectures in Hunan suitable for developing groundwater GSHP systems. It is estimated that the groundwater GSHP systems in the five prefectures can yield 517.18×10¹⁴J of heat each year, i.e., 2.9449 million TCE.
(2) Buried pipe GSHP system
Most of Hunan is fit for developing buried pipe GSHP systems. It is estimated that buried pipe GSHP systems across the 14 prefectures of Hunan can yield an annual amount of 24,204.31×1014J, equivalent to 137.8221 million TCE.
(3) Surface water source heat pump (WSHP) system
Hunan is rich in water resources. The countless rivers, lakes, and reservoirs bring a huge potential of cooling and heating. It is estimated that surface WSHP systems across the 14 prefectures of Hunan can yield 947.19×10¹⁴J of heat annually, about 5.3934 million TCE.
(4) Sewage WSHP system
Survey data show that, each year, 141.28×10¹⁴ of heat can be utilized from the sewage discharged by the 14 prefectures of Hunan, that is, 804,500 TCE.
So far, Hunan has built 198 shallow geothermal projects, which provide cooling/heating to 2.9554 million km2 of buildings. Among them, 191 GHSP projects serve 2.8105 million km2 of buildings, and 7 WSHP projects serve 144,900 km2 of buildings. Every year, shallow geothermal projects help Hunan to save 4,128.18 kWh of electricity, reduce coal consumption by 14,448.60 TCE, cut down carbon emissions by 3,7979.62 tons, lower sulfur dioxide emissions by 331.486 tons, slash nitrogen oxide emissions by 284.86 tons, and decrease dust emissions by 138.30 tons. The shallow geothermal resources are mainly utilized for cooling and heating buildings, and rarely used for other purposes.
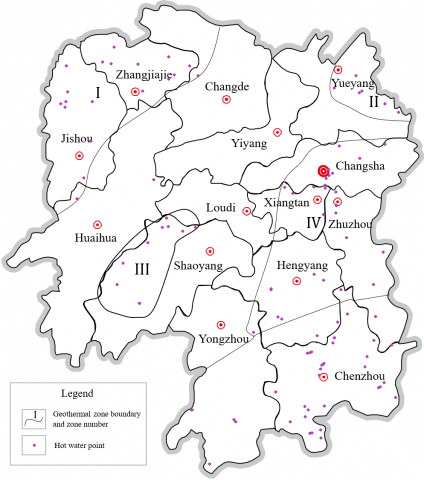
Figure 1. Underground hot water zones of Hunan
This paper collects the data related to six geothermal projects in Hunan. As shown in Table 1, the input indices include geothermal resource quantity (104m3/a), single-well yield (m3/d), total investment (10,000 yuan) (mainly including survey cost, geological assessment report cost, geothermal heat pump cost, purchase cost of equipment for machine room, purchase and installation cost of distribution and control equipment for machine room, purchase cost of other equipment, outdoor engineering consumable cost, outdoor engineering construction cost, pump room construction cost, etc.), and annual cost investment (10,000 yuan) (mainly including purchasing cost of raw materials and accessories, depreciation cost, wage and welfare cost, electricity bill, maintenance cost, mineral resource tax, other management costs, etc.). The output indices include dynamic investment recovery period (year), coal reduction of summer operation (ton/year), coal reduction of winter operation (ton/year), environmental protection and energy saving (10,000 yuan), standard coal reduction (ton/year), and emission reduction (ton/year).
Table 1. Input and output indices of the six geothermal projects in Hunan
|
Index |
|
Project 1 |
Project 2 |
Project 3 |
Project 4 |
Project 5 |
Project 6 |
|
Input index |
Geothermal resource quantity |
51.77 |
56.38 |
101.2 |
62.82 |
49.52 |
60.25 |
|
Single-well yield |
2,488 |
1,795 |
3,651 |
1,700 |
2,579 |
1,648 |
|
|
Total investment |
17,832 |
10,298 |
18,523 |
7,725 |
12,550 |
15,820 |
|
|
Annual cost investment |
7,254 |
5,961 |
4,682 |
3,881 |
4,006 |
4,823 |
|
|
Output index (economy) |
Dynamic investment recovery period |
5.08 |
4.58 |
5.21 |
4.59 |
4.62 |
5.01 |
|
Coal reduction of summer operation |
170 |
110 |
255 |
79.18 |
140.76 |
130.88 |
|
|
Coal reduction of winter operation |
165 |
96.24 |
262 |
94.6 |
40.43 |
111.93 |
|
|
Output index (environment) |
Environmental protection and energy saving |
680 |
524 |
798 |
425 |
410 |
582 |
|
Standard coal reduction |
520 |
370.24 |
1,160.1 |
11.78 |
290.19 |
420.81 |
|
|
Emission reduction |
1,300 |
861.11 |
900.25 |
29.46 |
470.96 |
1,070.03 |
The collected data were subjected to correlation analysis on SPSS Statistics 24. The data analysis focuses on how much geothermal resource quantity, single-well yield, total investment, and annual cost investment influence dynamic investment recovery period, coal reduction of summer operation, coal reduction of winter operation, environmental protection and energy saving, standard coal reduction, and emission reduction. For the lack of space, this part only presents the analysis results on the degrees of influence of geothermal resource quantity, single-well yield, total investment, and annual cost investment over dynamic investment recovery period, as well as those of geothermal resource quantity, single-well yield, total investment, and annual cost investment over emission reduction.
4.1 Correlation analysis on dynamic investment recovery period
Based on SPSS Statistics 24, the authors analyzed the correlation between geothermal resource quantity and dynamic investment recovery period. As shown in Table 2, the Pearson correlation coefficient between the two variables was 0.580, which is below the threshold (0.75) for significant influence. Therefore, geothermal resource quantity does not significantly affect dynamic investment recovery period.
The authors further analyzed the correlation between single-well yield and dynamic investment recovery period. As shown in Table 3, the Pearson correlation coefficient between the two variables was 0.598, indicating that single-well yield does not significantly affect dynamic investment recovery period.
Next, the authors analyzed the correlation between total investment and dynamic investment recovery period. As shown in Table 4, the Pearson correlation coefficient between the two variables was 0.941, suggesting that total investment has a significant impact on dynamic investment recovery period.
The authors went on to analyze the correlation between annual cost investment and dynamic investment recovery period. As shown in Table 5, the Pearson correlation coefficient between the two variables was 0.348, i.e., annual cost investment does not significantly affect dynamic investment recovery period.
Table 2. Results on the correlation between geothermal resource quantity and dynamic investment recovery period
|
Correlations |
|||
|
|
Geothermal resource quantity |
Dynamic investment recovery period |
|
|
Geothermal resource quantity |
Pearson correlation |
1 |
.580 |
|
Sig. (2-tailed) |
|
.227 |
|
|
Sum of squares and cross-products |
1,815.895 |
15.670 |
|
|
Covariance |
363.179 |
3.134 |
|
|
N |
6 |
6 |
|
|
Dynamic investment recovery period |
Pearson correlation |
.580 |
1 |
|
Sig. (2-tailed) |
.227 |
|
|
|
Sum of squares and cross-products |
15.670 |
.401 |
|
|
Covariance |
3.134 |
.080 |
|
|
N |
6 |
6 |
|
Table 3. Results on the correlation between single-well yield and dynamic investment recovery period
|
Correlations |
|||
|
|
Dynamic investment recovery period |
Single-well yield |
|
|
Dynamic investment recovery period |
Pearson correlation |
1 |
.598 |
|
Sig. (2-tailed) |
|
.210 |
|
|
Sum of squares and cross-products |
.401 |
653.562 |
|
|
Covariance |
.080 |
130.712 |
|
|
N |
6 |
6 |
|
|
Single-well yield |
Pearson correlation |
.598 |
1 |
|
Sig. (2-tailed) |
.210 |
|
|
|
Sum of squares and cross-products |
653.562 |
2,977,894.833 |
|
|
Covariance |
130.712 |
595,578.967 |
|
|
N |
6 |
6 |
|
Table 4. Results on the correlation between total investment and dynamic investment recovery period
|
Correlations |
|||
|
|
Dynamic investment recovery period |
Total investment |
|
|
Dynamic investment recovery period |
Pearson correlation |
1 |
.941** |
|
Sig. (2-tailed) |
|
.005 |
|
|
Sum of squares and cross-products |
.401 |
5,763.293 |
|
|
Covariance |
.080 |
1,152.659 |
|
|
N |
6 |
6 |
|
|
Total investment |
Pearson correlation |
.941** |
1 |
|
Sig. (2-tailed) |
.005 |
|
|
|
Sum of squares and cross-products |
5,763.293 |
93,375,831.330 |
|
|
Covariance |
1,152.659 |
18,675,166.270 |
|
|
N |
6 |
6 |
|
|
**. Correlation is significant at the 0.01 level (2-tailed). |
|||
Table 5. Results on the correlation between annual cost investment and dynamic investment recovery period
|
Correlations |
|||
|
|
Dynamic investment recovery period |
Annual cost investment |
|
|
Dynamic investment recovery period |
Pearson correlation |
1 |
.348 |
|
Sig. (2-tailed) |
|
.498 |
|
|
Sum of squares and cross-products |
.401 |
636.722 |
|
|
Covariance |
.080 |
127.344 |
|
|
N |
6 |
6 |
|
|
Annual cost investment |
Pearson correlation |
.348 |
1 |
|
Sig. (2-tailed) |
.498 |
|
|
|
Sum of squares and cross-products |
636.722 |
8,315,278.833 |
|
|
Covariance |
127.344 |
1,663,055.767 |
|
|
N |
6 |
6 |
|
4.2 Correlation analysis on emission reduction
Based on SPSS Statistics 24, the authors analyzed the correlation between geothermal resource quantity and emission reduction. As shown in Table 6, the Pearson correlation coefficient between the two variables was 0.040, which is below the threshold (0.75) for significant influence. Therefore, geothermal resource quantity does not significantly affect emission reduction.
The authors further analyzed the correlation between single-well yield and emission reduction. As shown in Table 7, the Pearson correlation coefficient between the two variables was 0.225, indicating that single-well yield does not significantly affect emission reduction.
Next, the authors analyzed the correlation between total investment and emission reduction. As shown in Table 8, the Pearson correlation coefficient between the two variables was 0.805, suggesting that total investment has a significant impact on emission reduction.
The authors went on to analyze the correlation between annual cost investment and emission reduction. As shown in Table 9, the Pearson correlation coefficient between the two variables was 0.789, i.e., annual cost investment has a significant effect on emission reduction.
For the lack of space, the correlation analysis on other economic and environmental indices are not presented here. Table 10 sums up the correlation coefficients between geothermal resource quantity, single-well yield, total investment, and annual cost investment, and dynamic investment recovery period, coal reduction of summer operation, coal reduction of winter operation, environmental protection and energy saving, standard coal reduction, and emission reduction.
Table 6. Results on the correlation between geothermal resource quantity and emission reduction
|
Correlations |
|||
|
|
Emission reduction |
Geothermal resource quantity |
|
|
Emission reduction |
Pearson correlation |
1 |
.040 |
|
Sig. (2-tailed) |
|
.939 |
|
|
Sum of squares and cross-products |
1,033,985.263 |
1,752.020 |
|
|
Covariance |
206,797.053 |
350.404 |
|
|
N |
6 |
6 |
|
|
Geothermal resource quantity |
Pearson correlation |
.040 |
1 |
|
Sig. (2-tailed) |
.939 |
|
|
|
Sum of squares and cross-products |
1,752.020 |
1,815.895 |
|
|
Covariance |
350.404 |
363.179 |
|
|
N |
6 |
6 |
|
Table 7. Results on the correlation between single-well yield and emission reduction
|
Correlations |
|||
|
|
Emission reduction |
Single-well yield |
|
|
Emission reduction |
Pearson correlation |
1 |
.225 |
|
Sig. (2-tailed) |
|
.668 |
|
|
Sum of squares and cross-products |
1,033,985.263 |
394,749.412 |
|
|
Covariance |
206,797.053 |
78,949.882 |
|
|
N |
6 |
6 |
|
|
Single-well yield |
Pearson correlation |
.225 |
1 |
|
Sig. (2-tailed) |
.668 |
|
|
|
Sum of squares and cross-products |
394,749.412 |
2,977,894.833 |
|
|
Covariance |
78,949.882 |
595,578.967 |
|
|
N |
6 |
6 |
|
Table 8. Results on the correlation between total investment and emission reduction
|
Correlations |
|||
|
|
Emission reduction |
Total investment |
|
|
Emission reduction |
Pearson correlation |
1 |
.805 |
|
Sig. (2-tailed) |
|
.053 |
|
|
Sum of squares and cross-products |
1,033,985.263 |
7,911,806.983 |
|
|
Covariance |
206,797.053 |
1,582,361.397 |
|
|
N |
6 |
6 |
|
|
Total investment |
Pearson correlation |
.805 |
1 |
|
Sig. (2-tailed) |
.053 |
|
|
|
Sum of squares and cross-products |
7,911,806.983 |
93,375,831.330 |
|
|
Covariance |
1,582,361.397 |
18,675,166.270 |
|
|
N |
6 |
6 |
|
Table 9. Results on the correlation between annual cost investment and emission reduction
|
Correlations |
|||
|
|
Emission reduction |
Annual cost investment |
|
|
Emission reduction |
Pearson correlation |
1 |
.789 |
|
Sig. (2-tailed) |
|
.062 |
|
|
Sum of squares and cross-products |
1,033,985.263 |
2,312,367.142 |
|
|
Covariance |
206,797.053 |
462,473.428 |
|
|
N |
6 |
6 |
|
|
Annual cost investment |
Pearson correlation |
.789 |
1 |
|
Sig. (2-tailed) |
.062 |
|
|
|
Sum of squares and cross-products |
2,312,367.142 |
8,315,278.833 |
|
|
Covariance |
462,473.428 |
1,663,055.767 |
|
|
N |
6 |
6 |
|
Table 10. Correlation coefficients between geothermal resource development and economic and environmental indices
|
|
Dynamic investment recovery period |
Coal reduction of summer operation |
Coal reduction of winter operation |
Environmental protection and energy saving |
Standard coal reduction |
Emission reduction |
|
Geothermal resource quantity |
0.580 |
0.734 |
0.841 |
0.693 |
0.799 |
0.040 |
|
Single-well yield |
0.598 |
0.931 |
0.710 |
0.666 |
0.846 |
0.225 |
|
Total investment |
0.941 |
0.803 |
0.708 |
0.858 |
0.812 |
0.805 |
|
Annual cost investment |
0.348 |
0.170 |
0.278 |
0.465 |
0.203 |
0.789 |
Starting from the basic attributes of geothermal projects, this paper explores how much the four dimensions of such projects, namely, geothermal resource quantity, single-well yield, total investment, and annual cost investment, affect the economy (dynamic investment recovery period, coal reduction of summer operation, and coal reduction of winter operation) and environment (environmental protection and energy saving, standard coal reduction, and emission reduction).
The results show that total investment has a significant impact on dynamic investment recovery period (correlation coefficient: 0.941); single-well yield and total investment have a relatively significant impact on coal reduction of summer operation (correlation coefficient: 0.931 vs. 0.803); geothermal resource quantity has a significant impact on coal reduction of winter operation (correlation coefficient: 0.841); total investment has a relatively significant impact on environmental protection and energy saving (correlation coefficient: 0.858); geothermal resource quantity, single-well yield, and total investment have a relatively significant impact on standard coal reduction (correlation coefficient: 0.799 vs. 0.846 vs. 0.812); total investment and annual cost investment have a relatively significant impact on emission reduction (correlation coefficient: 0.805 vs. 0789).
If the geothermal project developer wants to recover the investment cost soon, it must focus on the control of total investment; if the developer wants to save coal, it should try to improve geothermal resource quantity and single-well yield, both of which have a significant coal-saving effect.
Our analysis results also indicate that total investment significantly affects environmental protection and energy saving, and emission reduction. The main reason lies in the scale effect of geothermal resource projects, which mostly have a large total investment. Such projects also promote environmental protection and energy saving, and emission reduction. Considering the single utilization of geothermal resources in Hunan, the relevant departments are suggested to concentrate their technical strength to study the comprehensive utilization of geothermal resources, and carry out tests to explore new development schemes for such resources.
[1] Zarrella, A., Pasquier, P. (2015). Effect of axial heat transfer and atmospheric conditions on the energy performance of GSHP systems: A simulation-based analysis. Applied Thermal Engineering, 78: 591-604. https://doi.org/10.1016/j.applthermaleng.2014.11.067
[2] Luo, J., Rohn, J., Xiang, W., Bertermann, D., Blum, P. (2016). A review of ground investigations for ground source heat pump (GSHP) systems. Energy and Buildings, 117: 160-175. https://doi.org/10.1016/j.enbuild.2016.02.038
[3] Zhang, S., Zhang, L., Wei, H., Jing, J., Zhou, X., Zhang, X. (2016). Field testing and performance analyses of ground source heat pump systems for residential applications in Hot Summer and Cold Winter area in China. Energy and Buildings, 133: 615-627. https://doi.org/10.1016/j.enbuild.2016.09.069
[4] Casasso, A., Pestotnik, S., Rajver, D., Jež, J., Prestor, J., Sethi, R. (2017). Assessment and mapping of the closed-loop shallow geothermal potential in Cerkno (Slovenia). Energy Procedia, 125: 335-344. https://doi.org/10.1016/j.egypro.2017.08.210
[5] Somogyi, V., Sebestyén, V., Nagy, G. (2017). Scientific achievements and regulation of shallow geothermal systems in six European countries–A review. Renewable and Sustainable Energy Reviews, 68: 934-952. https://doi.org/10.1016/j.rser.2016.02.014
[6] Viesi, D., Galgaro, A., Visintainer, P., Crema, L. (2018). GIS-supported evaluation and mapping of the geo-exchange potential for vertical closed-loop systems in an Alpine valley, the case study of Adige Valley (Italy). Geothermics, 71: 70-87. https://doi.org/10.1016/j.geothermics.2017.08.008
[7] Fabbri, P., Pola, M., Piccinini, L., Zampieri, D., Roghel, A., Dalla Libera, N. (2017). Monitoring, utilization and sustainable development of a low-temperature geothermal resource: A case study of the Euganean Geothermal Field (NE, Italy). Geothermics, 70: 281-294. https://doi.org/10.1016/j.geothermics.2017.07.002
[8] Vélez, M.I., Blessent, D., Córdoba, S., López-Sánchez, J., Raymond, J., Parra-Palacio, E. (2018). Geothermal potential assessment of the Nevado del Ruiz volcano based on rock thermal conductivity measurements and numerical modeling of heat transfer. Journal of South American Earth Sciences, 81: 153-164. https://doi.org/10.1016/j.jsames.2017.11.011
[9] Viesi, D., Galgaro, A., Visintainer, P., Crema, L. (2018). GIS-supported evaluation and mapping of the geo-exchange potential for vertical closed-loop systems in an Alpine valley, the case study of Adige Valley (Italy). Geothermics, 71: 70-87. https://doi.org/10.1016/j.geothermics.2017.08.008
[10] Noorollahi, Y., Arjenaki, H.G., Ghasempour, R. (2017). Thermo-economic modeling and GIS-based spatial data analysis of ground source heat pump systems for regional shallow geothermal mapping. Renewable and Sustainable Energy Reviews, 72: 648-660. https://doi.org/10.1016/j.rser.2017.01.099
[11] Banks, J., Harris, N. B. (2018). Geothermal potential of Foreland Basins: A case study from the Western Canadian Sedimentary Basin. Geothermics, 76: 74-92. https://doi.org/10.1016/j.geothermics.2018.06.004
[12] Luo, J., Luo, Z., Xie, J., Xia, D., Huang, W., Shao, H., Xiang, W., Rohn, J. (2018). Investigation of shallow geothermal potentials for different types of ground source heat pump systems (GSHP) of Wuhan city in China. Renewable Energy, 118: 230-244. https://doi.org/10.1016/j.renene.2017.11.017
[13] Xi, J., Li, Y., Liu, M., Wang, R.Z. (2017). Study on the thermal effect of the ground heat exchanger of GSHP in the eastern China area. Energy, 141: 56-65. https://doi.org/10.1016/j.energy.2017.09.060
[14] Yang, R., Li, X., Wu, W., Xiong, Z., Cao, L., Yu, X. (2012). Assessment of application potential of shallow geothermal energy in Suzhou City. Renewable Energy Resources, 30(8): 74-77.
[15] Zhang, Z., Gao, J., Fan, X., Lan, Y., Zhao, M. (2017). Response of ecosystem services to socioeconomic development in the Yangtze River Basin, China. Ecological Indicators, 72: 481-493. https://doi.org/10.1016/j.ecolind.2016.08.035