I Made Rajendra | I Nyoman Suprapta Winaya* | Ainul Ghurri | I Ketut Gede Wirawan
© 2021 IIETA. This article is published by IIETA and is licensed under the CC BY 4.0 license (http://creativecommons.org/licenses/by/4.0/).
OPEN ACCESS
The purpose of bed material in the pyrolysis process is to reduce the need for heat energy. In this study, three kinds of sands were observed as bed material, namely iron oxide, zeolite, and ZSM-5 in the slow fixed bed pyrolysis of sunan candlenut oilcake (SCO). To evaluate the activation energy, pyrolytic kinetics were carried out using the iso-conversional method with the KAS, OFW, and Friedman models. They involved calculating the data from the thermogravimetric analysis (TGA) test at heating rates of 5, 10, 20 and 40 K/min. Furthermore, the results showed that SCO had a high volatile content of 82.80%, alongside a calorific value of 26.93 MJ/kg. The calculation results showed that the activation energy of SCO was 169.140 kJ/mol which decreased 1.45% in the KAS model, and 1.92% in the OFW model with the addition of ZSM-5 bed material. Therefore, the use of ZSM-5 bed material in the pyrolysis process reduces the activation energy.
sunan candlenut, slow fixed bed pyrolysis, bed materials, kinetic iso-conversional, activation energy
Sunan candlenut (Reutealis Trisperma Airy Shaw) is known as an abandoned poisonous seed. However, these seeds contain oil that has the potential to replace fossil fuels. This potential has started to be noticed by many researchers and has been included in Indonesia's national energy policy to support development efforts from the research stage to the processing business [1, 2]. The goal is to make sunan candlenut an alternative to palm oil, which is the main raw material for biodiesel. In contrast to oil palm which requires land with good tropical environmental conditions, sunan candlenut tends to adapt easily to marginal lands. These include extreme dry land and rocky, acid dry soils to sandy soils. Currently, there are million hectares of dry land in Indonesia with the potential to develop this plant. Sunan candlenut cultivation does not require deforestation like oil palm which threatens the ecosystem, especially since the demand for biofuels is increasing.
Sunan candlenut seeds contain above 45-50% crude oil which can be processed into biodiesel through a press and esterification-transesterification process. This process leaves a residue in the form of dregs which still contains 12.9% crude oil [3]. Oil in the waste can still be used as raw material for biodiesel through thermochemical conversions, such as pyrolysis, gasification, and combustion [4]. Pyrolysis is the choice of several researchers as a biomass conversion method, as this is the best way to utilize agricultural and forest waste including mahua seeds [5], Algae [6], nyamplung seeds [7], and castor seeds [8]. Furthermore, through pyrolysis, biomass molecules are broken down into lighter molecules such as gas, bio-oil, and biochar, with bio-oil upgraded into fuel for diesel engines [9]. There are two main types of pyrolysis, namely slow and fast, which are differentiated by residence time, heating rate, and operating temperature range [10]. Slow pyrolysis occurs at a rate of 0.1–1℃/s, a long residence time, and a temperature range of 400–600℃. Fast pyrolysis produces high liquids through rapid heating rates of 10 to> 1000℃/s, short residence times, temperatures of 400–650°C alongside rapid steam cooling [11].
The conversion of lignocellulosic biomass through pyrolysis technology still has many challenges, as bio-oil has a high viscosity, high oxygen content, and temperature instability. Therefore, a catalyst is required to improve the quality of pyrolysis vapor [12]. The yield and selectivity of catalytic pyrolysis depends on the type of catalyst, ratio of biomass amount to the catalyst, pyrolysis temperature, and residence time [13]. The type of catalyst usually refers to sand which has properties based on pore size, specific surface area, surface packing, and pore size distribution. Furthermore, some researchers report that natural zeolite catalysts increase the quantity and quality of bio-oil products [14, 15]. Another catalyst that has been widely studied is the molecular sieved zeolite such as ZSM-5 which significantly increases the non-condensed gas fraction [16, 17]. Another potential catalyst material is iron oxide, as it is abundantly available in Indonesia. Several researchers have observed its ability as a catalyst and concluded that iron oxide has a positive effect [18, 19].
The use of a catalyst in pyrolysis is carried out through the following methods (1) the catalyst is mixed into the raw material; (2) the catalyst is placed in the pyrolysis reactor and allows direct contact between vapor with the catalyst; (3) the catalyst is placed in a secondary reactor located downstream of the primary reactor (pyrolizer). The first two methods are called in-situ, while the last one is ex-situ, and each has a different effect [20-22]. The effect of catalysts will be distinct for different biomass because pyrolysis products depend on the suitability of the catalyst. Therefore, finding a suitable catalyst for optimization of the pyrolysis process is an alternative way to reduce overall energy consumption [23].
The transformation of biomass into products is highly dependent on the kinetic rate of the pyrolysis reaction. It is proven that an accurate kinetic model is required to design a proper pyrolysis process [24]. Thermogravimetric analysis (TGA) is a technique commonly used to obtain simple, precise information in studying kinetic events and energy consumption during pyrolysis [25]. Among the many existing procedures, there are three commonly used and widely known methods for evaluating kinetic parameters. These three are based on the constant heating rate for kinetic analysis and activation energy using thermogravimetric data into the Arrhenius formula. They include the Kissinger-Akahira-Sunose (KAS) method, Flynn-Wall-Ozawa (FWO), and Friedman.
This study aims to analyze the kinetic reaction and activation energy using three kind methods in the pyrolysis fixed bed of sunan candlenut oilcake using iron oxide, zeolite, and ZSM-5 as bed material or catalyst.
2.1 Materials
The sample tested in this study was sunan candlenut oilcake (SCO) which is a waste product of the manufacturing process of sunan candlenut biodiesel obtained from Garut plantations, Indonesia. There, the peeled candlenut is pressed hydraulically with a pressure of 146 kN to obtain crude oil before esterification, and the waste is the dregs used in this study. The cake contains non-uniform moisture; therefore, it must be dried in an electric oven at a temperature of 110℃ for 3 hours to reduce and uniform the moisture content. To obtain a uniform grain size, the oilcake was sieved at mesh size 35. Furthermore, the samples were analyzed using the proximate test to determine the moisture, volatile matter, fixed carbon, and ash content using TGA 701 Leco. The analysis method refers to ASTM D7582 MVA-biomass. To determine the content of C, H, N, and O, ultimate testing was carried out using the Leco Elementary CHN add-on type 628. The estimated data from the test results are shown in Table 1.
Table 1. Proximate and ultimate analysis and predicted values HHV of SCO
|
Proximate analysis (wt %) * |
Ultimate analysis (wt %) |
||
|
Moisture |
3.23 |
C |
59.10 |
|
Volatile matter (VM) |
82.80 |
H |
8.33 |
|
Fixed carbon (FC) |
10.24 |
N |
2.72 |
|
Ash |
3.73 |
S |
0.32 |
|
|
|
O (by diff.) |
25.80 |
|
|
|
HHV (MJ/kg) |
26.93 |
* dry weight basis
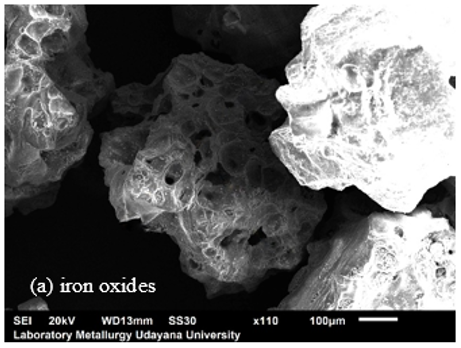
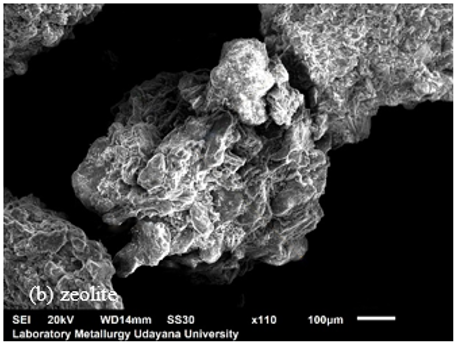
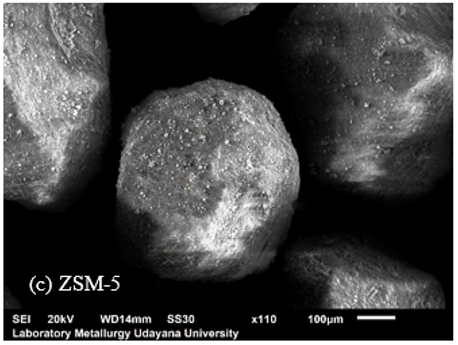
Sand samples as bed materials consisting of ZSM-5 were obtained from Zibo Yinghe Chemical Co., Ltd, China, while natural zeolites were obtained from mining companies in West Java, Indonesia. Furthermore, iron oxide was obtained from sand mining at the foot of Mount Batur, Bali, Indonesia. The three kinds of sands were sieved to obtain a homogeneous size with a mesh size of 35. Afterwards, they were activated at a temperature of 400℃ for 6 hours in the furnace. Pore characteristics were observed by surface area analysis (SAA) testing and SEM (Scanning electron microscope).
2.2 Thermogravimetric Analysis (TGA)
The pyrolysis test was carried out using a thermogravimetric analyzer TGA-701 Leco (temperature measurement precision of ± 2℃, and microbalance sensitivity of 0.0001 g), under a continuous Nitrogen gas flow at 10 mL/min. The test sample consisted of SCO without a mixture of bed material, and was mixed with the composition of SCO versus bed material set at 1:5 similar ratios used in previous studies [20, 26-28]. Furthermore, the sample mixture was stirred evenly to obtain a homogeneous composition. All samples were heated at dynamic operating temperatures, from room temperature (30℃) to 950℃ in variations of heating rates 5, 10, 20, and 40 K/min.
2.3 Kinetic study
Biomass pyrolysis will show a different picture which is dependent on variations in the chemical composition of biomass materials [29]. Biomass pyrolysis is generally a complex process, and it is difficult to ascertain a precise kinetic model to describe the thermal degradation mechanism. However, some of the existing kinetic models are quite effective. These include the free-model kinetic based on the iso-conversional method mainly used to obtain and evaluate activation energy, which is a function of the rate of conversion of chemical reactions.
The basic kinetic equation commonly used in all kinetic studies is formulated as:
$\frac{d \alpha}{d t}=k(T) f(\alpha)$ (1)
where, k is a constant rate and f(α) is the reaction model, where the function depends on the actual reaction mechanism. Eq. (1) states the conversion rate, dα/dt, at constant temperature as a function of loss of reactant concentration and constant rate. In this study, the conversion rate (α) was determined by the formula:
$\alpha=\frac{m_{o}-m}{m_{o}-m_{f}}$ (2)
where, m0 and mf are the initial and final mass values, respectively. while m is the instantaneous mass. The constant rate (k) is generally expressed by the Arrhenius equation:
$k(T)=A \exp \left(-\frac{E_{a}}{R T}\right)$ (3)
where, Ea is the activation energy (kJ/mol), R is the universal gas constant (8.314 J/K.mol), A is the pre-exponential factor (min-1), and T is the absolute temperature (K). By entering Eq. (3) in (1), the formula is obtained:
$\frac{d \alpha}{d t}=A \exp \left(-\frac{E_{a}}{R T}\right) f(\alpha)$ (4)
In the pyrolysis process using TGA which is carried out dynamically, temperature is a function of time which increases at a constant heating rate (β), where $\beta=\frac{d T}{d t}$ and if put into Eq. (4) then the formula is obtained:
$\frac{d \alpha}{d T}=\left(\frac{A}{\beta}\right) \exp \left(-\frac{E_{a}}{R T}\right) f(\alpha)$ (5)
Eqns. (4) and (5) are the basic formulations of the analysis method used to calculate the kinetic parameters based on the TGA database.
The most common model-free methods used to evaluate and explain the kinetics in pyrolysis are Kissinger-Akahira-Sunose (KAS), Flynn-Wall-Ozawa (FWO), and Friedman. These methods are recommended by many researchers [24, 29-32] because very suitable for low and medium conversion rate although may misestimate the activation energy and pre-exponential factor for cellulose, hemicellulose and lignin [33]. The KAS method plots ln (β/T2) against 1/T for a series of experiments with different heating rates, therefore a slope is obtained which is the value -Ea/R. By calculating the conversion range from 0 to 1, the activation energy during the conversion can be calculated. The iso-conversional FWO is an integral method for determining the -Ea/R value of the slope of the curve plotting log β to 1/T at a certain conversion rate. Meanwhile, the Friedman method plots ln (dα/dt) against 1/T. The three methods used in this study are summarized in Table 2.
Table 2. Kinetic methods used to evaluate the activation energy in this study
|
Method |
Formulation |
Plot |
Ref. |
|
Kissinger-Akahira-Sunose (KAS) |
ln (β/T2) = ln [AEa/Rg(α)]-Ea/RT |
ln (β/T2) on 1/T |
[34] |
|
Flynn-Wall-Ozawa (FWO) |
log β = log [AEa/Rg(α)]-2.315-0.4567Ea/RT |
log β on 1/T |
[35] |
|
Friedman |
ln (dα/dt) = ln [Af(α)]-Ea/RT |
ln (dα/dt) on 1/T |
[36] |
3.1 Characteristics of biomass and bed materials
As shown in Table 1, the characteristics based on the results of proximate and ultimate analysis and the calorific value of energy show that SCO has a very high volatile content of 82.80%. This means that the potential to convert it into bio-oil through pyrolysis is very high, as well as its use as a fuel in combustion and gasification. Based on the fixed ash and carbon content of less than 15%, the heat barrier to the bed material is reduced. When compared with the proximate and ultimate analysis of palm oil, the test results by Abd Aziz [37] where the values of moisture, volatile, fixed carbon and ash were 6-8%, 72-75%, 14-16%, and 2-5%, the volatile content of SCO is higher. Furthermore, compared with the C, H, N, O, and S content of palm oil, respectively 45-50%, 5%, 0.5%, 43-48%, and 0.4%, it is observed that the carbon and hydrogen content in SCO are higher. Carbon and hydrogen elements are constituents of CH4 and CnHm compounds which are fuels. Based on the HHV value, palm oil (EFB) was 17.79 MJ/kg [38] while SCO was higher at a value of 26.98 MJ/kg.
The characteristics of the bed material based on the SAA test results are shown in Table 3 and pore surface features based on the SEM test can be seen in Figure 1. It is observed that the largest pore area is owned by ZSM-5, followed by iron oxide and zeolite. However, it is contrary to the size of the pore diameter where the largest is owned by zeolite, followed by iron oxide and ZSM-5. It can be termed ZSM-5 has many micropores, while zeolite and iron oxide are mesopore-sized.
Table 3. Pore characteristics of bed materials
|
Parameters |
iron oxide |
zeolite |
ZSM-5 |
|
Surface Area (BET) (m2/g) |
22.527 |
19.497 |
368.912 |
|
Volume (cc/g) |
0.612 |
0.105 |
0.552 |
|
Average pore rad (Å) |
54.31 |
107.3 |
29.93 |
Figure 1. SEM images
3.2 Thermal decomposition characteristics
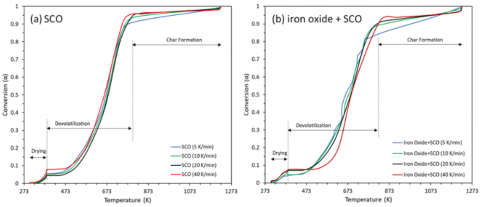
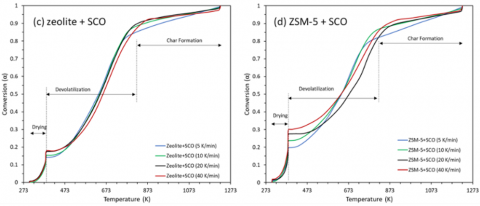
Changes in the conversion of SCO with different bed materials were studied using DTG in the temperature range of 25–950℃, with heating rates of 5, 10, 20, and 40 K/min accompanied by the flow of inert Nitrogen gas. The length time for each stage process was based on ASTM D7582 MVA-biomass. Figure 1(a) shows the conversion changes of SCO without bed material, (b) iron oxide bed material, (c) zeolite, and (d) ZSM-5. The four graphs show the same stages of change, where the pyrolysis of SCO experienced three gradual changes. These changes were experienced by each biomass [29]. The stages can be described as follows; (i) the drying process was carried out at temperatures between 100-110℃, (ii) pyrolytic cracking occurred at temperatures of 110 to 550℃, and (iii) endothermic decomposition of the remaining lignin occurred at temperatures above 550℃. The second stage consisted of two simultaneous exothermic processes, namely the decomposition on the main components of hemicellulose, cellulose, and lignin, as well as the formation of volatile fractions in large amounts.
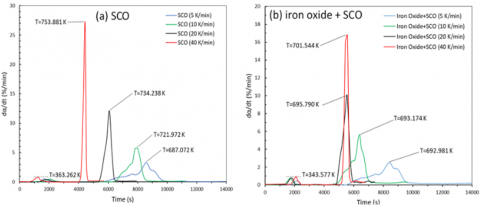
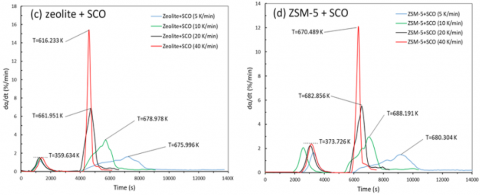
In Figure 2, the difference in heating rate for each bed material showed the same trend. The percentage change rate began from the highest to the lowest, specifically 40, 20, 10, and 5 K/min. An increase in the heating rate improved the maximum level of decomposition [39]. Based on the percentage conversion rate for a heating rate of 40 K/min, the three bed materials showed different peak values. SCO pyrolysis without bed material experienced the highest degradation, namely 26.87% at a temperature of 753.881 K, while iron oxide was 16.71% at a temperature of 701.544 K, and zeolite and ZSM-5 respectively 15.43% at 616.233K, and 12.04% at 670.489 K. Therefore, SCO without bed material underwent decomposition with the highest percentage of peaks followed by iron oxide, zeolite and the lowest which was ZSM-5. According to the average peak temperature at all heating rates for each treatment, the pyrolysis of SCO without bed material occurred at a temperature of 724.921 K, iron oxide at 695.782 K, zeolite at 658.290 K, and ZSM-5 at 680.640 K. This signified that the addition of bed material causes the peak temperature to be lower than without the material, but it affects the duration of the pyrolysis process.
Comparing the three uses of bed material at a heating rate of 5 K/min in DTG diagram, the peak temperature of SCO pyrolysis using iron oxide occurred at 8,432 seconds, while zeolite occurred at 7,167 seconds, and ZSM-5 at 9,160 seconds. Likewise, a similar phenomenon occurred in the length of the pyrolysis process. In addition, regarding the surface area analysis in Table 3, there was a correlation between pyrolysis time and pore area. ZSM-5 with the largest pore area underwent the longest pyrolysis time reaching 11,000 seconds, followed by iron oxide and zeolite at 1,000 and 9,000 seconds respectively, as shown in Figure 3. It is therefore concluded that the pore characteristics of the bed material influences the duration of the pyrolysis process. However, because pyrolysis with the addition of bed material is very complex with many influencing parameters, it is necessary to investigate the influence of other factors on the bed material characteristics. Table 3 showed that iron oxide and zeolite have a little difference in pore area, namely 22.527 and 19.497 m2/g. This value is very low compared to the ZSM-5 which is 368.912 m2/g, but the conversion degree of the drying stage showed that zeolite was greater compared to iron oxide. This is due to the physical properties of zeolite with a greater heat conductivity than iron oxide.
3.3 Kinetic analysis
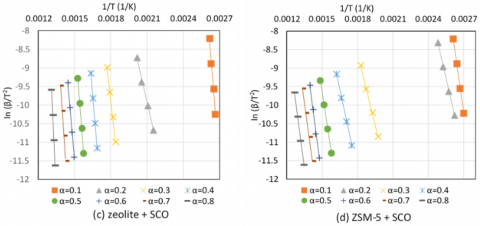
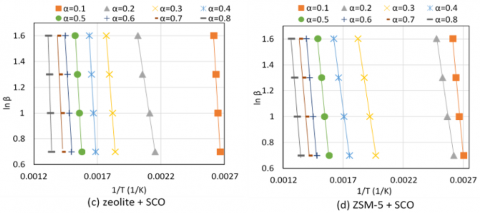
In this research, the iso-conversional method was used to determine the relationship between conversion and activation energy. The kinetic parameter of SCO pyrolysis, specifically the activation energy, was determined using the iso-conversional model of KAS, OFW, and Friedman. According to the KAS Model and the formulation in Table 3, the activation energy (Ea) is determined by plotting ln (β/T2) against 1/T which produces a gradient (slope) -Ea/R. The data analyzed were the results of SCO pyrolysis testing with each bed material using TGA at heating rates of 5, 10, 20 and 40 K/min. Figure 4 showed the plotting results of the KAS model, where each line represented the degree of conversion.
Figure 2. Changes in conversion experienced
Figure 3. DTG diagram
Figure 4. KAS model
Figure 5. OFW model
Figure 6. Friedman model
Table 4. Activation energy (Ea) and the correlation factor (R2)
|
|
KAS method |
OFW method |
Friedman method |
|||
|
α |
Ea(kJ/mol) |
R2 |
Ea(kJ/mol) |
R2 |
Ea(kJ/mol) |
R2 |
|
Sunan Candlenut Oilcake (SCO) |
||||||
|
0.1 |
71.407 |
0.994 |
76.063 |
0.995 |
82.008 |
0.577 |
|
0.2 |
81.450 |
0.998 |
86.598 |
0.998 |
116.642 |
0.990 |
|
0.3 |
114.587 |
0.999 |
118.768 |
0.999 |
115.385 |
0.999 |
|
0.4 |
152.906 |
0.999 |
155.699 |
0.999 |
147.232 |
1.000 |
|
0.5 |
196.863 |
0.977 |
197.782 |
0.979 |
178.024 |
0.986 |
|
0.6 |
203.358 |
0.991 |
204.253 |
0.992 |
183.825 |
0.983 |
|
0.7 |
209.364 |
0.995 |
210.235 |
0.996 |
207.538 |
0.991 |
|
0.8 |
297.996 |
0.985 |
294.794 |
0.987 |
265.196 |
0.997 |
|
av |
165.991 |
|
168.024 |
|
173.406 |
|
|
iron oxide + SCO |
||||||
|
0.1 |
135.258 |
0.992 |
136.738 |
0.993 |
38.722 |
0.403 |
|
0.2 |
150.660 |
0.994 |
152.323 |
0.995 |
143.610 |
0.992 |
|
0.3 |
227.987 |
0.991 |
226.585 |
0.992 |
236.653 |
0.986 |
|
0.4 |
252.803 |
0.991 |
250.593 |
0.992 |
268.082 |
0.978 |
|
0.5 |
261.645 |
1.000 |
259.418 |
1.000 |
241.120 |
0.999 |
|
0.6 |
205.986 |
0.997 |
207.077 |
0.997 |
201.676 |
0.996 |
|
0.7 |
207.902 |
0.983 |
209.236 |
0.985 |
239.095 |
0.975 |
|
0.8 |
245.580 |
1.000 |
245.393 |
1.000 |
349.818 |
0.986 |
|
av |
210.977 |
|
210.920 |
|
240.008 |
|
|
zeolite + SCO |
||||||
|
0.1 |
335.095 |
0.999 |
324.431 |
0.999 |
98.276 |
0.813 |
|
0.2 |
117.029 |
0.998 |
118.799 |
0.998 |
-18.102 |
0.715 |
|
0.3 |
234.587 |
0.999 |
231.693 |
0.999 |
195.298 |
0.987 |
|
0.4 |
319.699 |
1.000 |
313.324 |
1.000 |
317.173 |
0.997 |
|
0.5 |
349.726 |
0.996 |
342.537 |
0.997 |
377.954 |
0.993 |
|
0.6 |
300.747 |
0.998 |
296.549 |
0.998 |
325.016 |
0.999 |
|
0.7 |
395.023 |
0.993 |
386.642 |
0.993 |
471.811 |
0.987 |
|
0.8 |
600.794 |
0.998 |
582.867 |
0.998 |
820.734 |
0.992 |
|
av |
331.587 |
|
324.605 |
|
417.998 |
|
|
ZSM-5 + SCO |
||||||
|
0.1 |
189.758 |
1.000 |
186.278 |
1.000 |
23.460 |
0.669 |
|
0.2 |
114.802 |
0.997 |
115.287 |
0.997 |
105.508 |
0.754 |
|
0.3 |
107.257 |
0.999 |
110.249 |
1.000 |
- 6.870 |
0.015 |
|
0.4 |
122.910 |
1.000 |
126.174 |
1.000 |
109.131 |
0.999 |
|
0.5 |
175.484 |
1.000 |
177.077 |
1.000 |
157.033 |
0.985 |
|
0.6 |
201.032 |
0.999 |
202.054 |
0.999 |
170.737 |
0.996 |
|
0.7 |
193.531 |
0.999 |
195.410 |
1.000 |
210.346 |
0.990 |
|
0.8 |
203.850 |
0.997 |
205.821 |
0.997 |
264.306 |
0.958 |
|
av |
163.578 |
|
164.794 |
|
182.311 |
|
In Figure 4(d), ZSM-5+SCO showed the conversion degrees of 0.1 and 0.2, far apart from each other. This signified that the conversion in the drying stage caused mass degradation of up to two degrees as shown in Figure 2(d). Pyrolysis for the decomposition of the volatile fraction began from a conversion degree of 0.3 to 0.8. Furthermore, zeolite began the pyrolysis of the volatile fraction at the conversion degree of 0.2, while the iron oxide and SCO began at 0.1. The calculation on the average activation energy with the KAS model for SCO, iron oxide+SCO, zeolite+SCO, and ZSM-5+SCO, showed the respective results of 165.991, 210.977, 331.587, and 163.578 kJ/mol.
The next kinetic analysis used to calculate the activation energy was the OFW model. This model plotted log β against 1/T and produced a slope of -0.457 Ea/R for each conversion degree, with the plotting results shown in Figure 5. The OFW line showed similarities to the KAS model because both are integral equations plotting the same parameters, namely heating rate (β) and temperature (T). The results of the OFW model for SCO, iron oxide, zeolite, and ZSM-5 were 168.024, 210.920, 324.605, 164.794 kJ/mol, respectively. Comparing the calculation results between the KAS and OFW models, it is observed that the values were not significantly different.
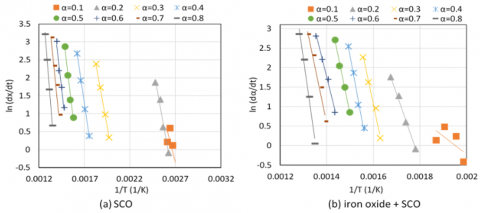
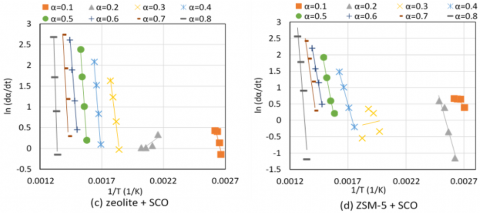
Activation energy can also be calculated based on the Friedman model formula, by plotting ln (dα/dt) against 1/T to produce a -Ea/R slope. As it is a derivative of the change in conversion to time changes, the linear gradient display of the plot results showed an uneasy or random picture, as in Figure 6. In the use of ZSM-5 bed material, it was observed that the plotting lines of conversion degrees 0.1, 0.2 and 0.3 showed different directions from the conversion degree of 0.4 to 0.8. A similar phenomenon occurred with zeolite but only two degrees, while iron oxide and SCO were at 0.1 degrees which showed different gradient directions.
The slope represented by all linear lines in each method, including SCO and three bed materials, is then multiplied by the gas constant (R) to obtain the activation energy value (Ea). To test the reliability of the relationship between data points, we can use the correlation value (R2). The complete data can be seen in Table 4.
According to the correlation value (R2), several lines showed values below 0.900 especially in the Friedman method group. Therefore, in the calculation of the average activation energy with this Friedman model, the value generated by the line slope was not included [24].
3.4 Evaluation of activation energy
Based on the calculation of the KAS, OFW, and Friedman models, the activation energy of SCO ranges from 71.407 to 297.996 kJ/mol with an average of 165.991 kJ/mol for KAS, while the OFW model begins from 76.063 to 294.794 kJ/mol at an average of 173.406 kJ/mol. The Friedman model yields 116.642 to 265.196 at an average of 173.406 kJ/mol. From the three results, it can be averaged to be 169.140 kJ/mol. This value is included in the biomass activation energy range, as well as other biomass previously studied, such as rice straw; 192.66 kJ/mol [40], hazelnut husk; 131.1 kJ/mol [29], corn stalk; 148 kJ/mol [41], empty fruit bunch (EFB) of oil palm; 213.22 kJ/mol [42].
The calculation results of the average activation energy obtained values of iron oxide+SCO at 210.977 kJ/mol by KAS, 210.920 kJ/mol by OFW and 240.008 kJ/mol by Friedman. From the three results, it can be averaged to be 220.635 kJ/mol. While the final average for zeolite+SCO is 417.998 kJ/mol and ZSM-5+SCO is 182.311 kJ/mol.
The results of the activation energy calculation show that the use of zeolite as a bed material gives the highest value, followed by iron oxide and the lowest is ZSM-5. If seen, this value has a correlation with the pore characteristic value of the bed material as shown in Table 3. It shows the surface area (BET) from low to high values is zeolite; 19,497 m2/g, iron oxide; 22,527 m2/g and ZSM-5; 368,912 m2/g. There is an inverse correlation where ZSM-5 with the lowest activation energy has the highest surface area, and vice versa for zeolites. This shows that the larger the surface area, the better the ability to reduce activation energy. This process is in line with the function of the bed material in the pyrolysis process as heat storage, so a large surface is needed to be able to transfer more heat. The stored heat is intended to cracking the biomass, so that further heat supply from the source can be reduced.
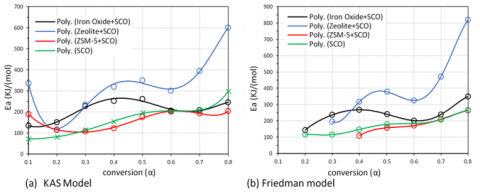
The kinetic test to calculate the activation energy using TGA is like slow pyrolysis, so that the heat transfer to the bed material takes place from the start of the furnace operation to a temperature of 950℃. At this stage, the energy supplied to heat the bed material is large enough to ignore the energy of biomass decomposition. This can be seen in Figure 7 where the activation energy curve of SCO+bed material is higher than without bed material. However, the bed material will play an important role in fast and flash pyrolysis, when the temperature has been reached and the biomass is fed spontaneously, less energy is required for decomposition. However, the fast dan flash pyrolysis kinetic testing still requires further research because the challenge is to weigh the mass of biomass in a conversion range in a very short time.
The calculation results for predicting the activation energy, where its distribution on the conversion degree was shown in the graph, are shown in Figure 7(a) for the KAS model and (b) for Friedman. Meanwhile, the OFW model was not shown because the curve had similarities to the KAS model. In the KAS method, part of the ZSM-5+SCO curve was below the SCO curve, specifically at degrees of 0.3 to 0.8, while degrees of 0.3 and below, the SCO curve was above. This signified that in SCO pyrolysis with the addition of ZSM-5 bed material, the activation energy in the devolatilization stage is lower than that of SCO pyrolysis without bed material. The distribution graph of activation energy based on the Friedman model showed that the ZSM-5+SCO curve with conversion degrees of 0.4 to 0.7 were under the SCO curve. Therefore, the activation energy of SCO pyrolysis with the addition of bed material ZSM-5 is lower at the conversion degree of 0.7, although the average value was slightly higher than the average SCO.
Figure 7. Distribution graph of the activation energy (Ea) in the conversion degree
Based on the average activation energy in the KAS and OFW models for ZSM-5+SCO of 163.578 kJ/mol and 164.794 kJ/mol, there were differences of 2.413 and 3.230 kJ/mol, compared to SCO. Therefore, the addition of ZSM-5 bed material only reduces the activation energy by 1.45% based on the calculation of the KAS model, with a 1.92% decrease using OFW. This value is quite small compared to the energy required to prepare bed materials in the pyrolysis process, unless it has other specific purposes such as producing bio-oil or gas products with certain characteristics.
Thermogravimetric analysis (TGA) on sunan candlenut oilcake showed a volatile content of 82.80%, and a calorific value of 26.93 MJ/kg. The high carbon and hydrogen contents make the sunan candlenut oilcake a potential raw material for bioenergy in form of bio-oil and bio-gas. The decomposition of the volatile fraction with the highest percentage occurred at an average temperature of 724.921 K. Furthermore, the kinetic pyrolysis successfully modeled and evaluated the activation energy using the iso-conversional method of KAS, OFW, and Friedman models. The results showed that the activation energy of the sunan candlenut oilcake is 169.140 kJ/mol decreased by 1.45% in the KAS model and 1.92% with OFW, by adding of ZSM-5 bed material. Therefore, the use of ZSM-5 bed material in the pyrolysis process reduces the activation energy.
|
A |
Pre-exponential factor, 1/s |
|
Ea |
activation energy, kJ/mol |
|
HHV |
high heat value, MJ/kg |
|
k |
Constant rate |
|
KAS |
Kissinger–Akahira–Sunose |
|
OFW |
Ozawa, Flynn and wall |
|
R |
Gas constant, 8.314 J/K.mol |
|
R2 |
Correlation coefficient |
|
T |
Temperature, K |
|
TGA |
Thermogravimetric analysis |
|
$\alpha$ |
conversion degree |
|
$\beta$ |
heating rate, K/min |
[1] Setiawan, D.I., Irawadi, T.T., Mas’ud, Z.A. (2019). Hydrotreating of sunan candlenut (Reutealis trisperma airy shaw) oil by using NiMo-γAl2O3 as renewable energy. Indonesian Journal of Chemistry, 19(1): 78-88. https://doi.org/10.22146/ijc.27274
[2] DEN. (2014). Outlook Energy Indonesia 2014: Energy Development in Supporting Fuel Substitution Program, ESDM-Indonesia, Editor. Jakarta, 131-132.
[3] Pranowo, D., Syakir, M., Prastowo, B., Herman, M., Aunillah, A. (2014). Pembuatan Biodiesel dari Kemiri Sunan (Reutealis trisperma (Blanco) Airy Shaw) dan Pemanfaatan Hasil Samping.
[4] Patel, M., Zhang, X., Kumar, A. (2016). Techno-economic and life cycle assessment on lignocellulosic biomass thermochemical conversion technologies: A review. Renewable and Sustainable Energy Reviews, 53: 1486-1499. https://doi.org/10.1016/j.rser.2015.09.070
[5] Dhanavath, K.N., Shah, K., Bankupalli, S., Bhargava, S. K., Parthasarathy, R. (2017). Derivation of optimum operating conditions for the slow pyrolysis of Mahua press seed cake in a fixed bed batch reactor for bio–oil production. Journal of Environmental Chemical Engineering, 5(4): 4051-4063. https://doi.org/10.1016/j.jece.2017.07.034
[6] Debiagi, P.E.A., Trinchera, M., Frassoldati, A., Faravelli, T., Vinu, R., Ranzi, E. (2017). Algae characterization and multistep pyrolysis mechanism. Journal of Analytical and Applied Pyrolysis, 128: 423-436.
[7] Sakthivel, R., Ramesh, K. (2017). Influence of temperature on yield, composition and properties of the sub-fractions derived from slow pyrolysis of Calophyllum inophyllum de-oiled cake. Journal of Analytical and Applied Pyrolysis, 127: 159-169. https://doi.org/10.1016/j.jaap.2017.08.012
[8] Vichaphund, S., Sricharoenchaikul, V., Atong, D. (2017). Industrial waste derived CaO-based catalysts for upgrading volatiles during pyrolysis of Jatropha residues. Journal of Analytical and Applied Pyrolysis, 124: 568-575. https://doi.org/10.1016/j.jaap.2017.01.017
[9] Quan, C., Gao, N., Song, Q. (2016). Pyrolysis of biomass components in a TGA and a fixed-bed reactor: Thermochemical behaviors, kinetics, and product characterization. Journal of Analytical and Applied Pyrolysis, 121: 84-92. https://doi.org/10.1016/j.jaap.2016.07.005
[10] Bridgwater, A.V. (2012). Review of fast pyrolysis of biomass and product upgrading. Biomass and Bioenergy, 38: 68-94. https://doi.org/10.1016/j.biombioe.2011.01.048.
[11] Dickerson, T., Soria, J. (2013). Catalytic fast pyrolysis: A review. Energies, 6(1): 514-538.
[12] Liu, J., Hou, Q., Ju, M., Ji, P., Sun, Q., Li, W. (2020). Biomass pyrolysis technology by catalytic fast pyrolysis, catalytic co-pyrolysis and microwave-assisted pyrolysis: A review. Catalysts, 10(7): 742. https://doi.org/10.3390/catal10070742
[13] Ojha, D.K., Vinu, R. (2015). Resource recovery via catalytic fast pyrolysis of polystyrene using zeolites. Journal of Analytical and Applied Pyrolysis, 113: 349-359. https://doi.org/10.1016/j.jaap.2015.02.024
[14] Alejandro Martin, S., Cerda-Barrera, C., Montecinos, A. (2017). Catalytic pyrolysis of Chilean Oak: Influence of Brønsted acid sites of Chilean natural zeolite. Catalysts, 7(12): 356. https://doi.org/10.3390/catal7120356
[15] Imran, A., Bramer, E. A., Seshan, K., Brem, G. (2016). Catalytic flash pyrolysis of biomass using different types of zeolite and online vapor fractionation. Energies, 9(3): 187. https://doi.org/10.3390/en9030187
[16] Mohammed, I.Y., Kazi, F.K., Yusup, S., Alaba, P.A., Sani, Y.M., Abakr, Y.A. (2016). Catalytic intermediate pyrolysis of napier grass in a fixed bed reactor with ZSM-5, HZSM-5 and zinc-exchanged zeolite-A as the catalyst. Energies, 9(4): 246. https://doi.org/10.3390/en9040246
[17] Vichaphund, S., Aht-Ong, D., Sricharoenchaikul, V., Atong, D. (2017). Effect of CV-ZSM-5, Ni-ZSM-5 and FA-ZSM-5 catalysts for selective aromatic formation from pyrolytic vapors of rubber wastes. Journal of Analytical and Applied Pyrolysis, 124: 733-741. https://doi.org/10.1016/j.jaap.2016.11.011
[18] Wicakso, D. R., Sutijan, S., Rochmadi, R., Budiman, A. (2018). Turnitin-Effect of Temperature on Catalytic Decomposition of Tar using Indonesian Iron Ore as Catalyst.
[19] Amelia, S., Sediawan, W.B., Mufrodi, Z., Ariyanto, T. (2019). Modification of iron oxide catalysts supported on the biomass based activated carbon for degradation of dye wastewater. Jurnal Bahan Alam Terbarukan, 7(2): 164-168. https://doi.org/10.15294/jbat.v7i2.17174
[20] Wang, K., Johnston, P.A., Brown, R.C. (2014). Comparison of in-situ and ex-situ catalytic pyrolysis in a micro-reactor system. Bioresource Technology, 173: 124-131. https://doi.org/10.1016/j.biortech.2014.09.097
[21] Shafaghat, H., Lee, H.W., Tsang, Y.F., Oh, D., Jae, J., Jung, S.C., Park, Y.K. (2019). In-situ and ex-situ catalytic pyrolysis/co-pyrolysis of empty fruit bunches using mesostructured aluminosilicate catalysts. Chemical Engineering Journal, 366: 330-338. https://doi.org/10.1016/j.cej.2019.02.055
[22] Shirazi, Y., Viamajala, S., Varanasi, S. (2020). In situ and ex situ catalytic pyrolysis of microalgae and integration with pyrolytic fractionation. Frontiers in Chemistry, 8: 786. https://doi.org/10.3389/fchem.2020.00786
[23] Kabakcı, S.B., Hacıbektaşoğlu, Ş. (2017). Catalytic Pyrolysis of Biomass, in Pyrolysis, M. Samer, Editor. IntechOpen: Energy Systems Engineering Department, Faculty of Engineering, Yalova University, Yalova, Turkey.
[24] Damartzis, T., Vamvuka, D., Sfakiotakis, S., Zabaniotou, A. (2011). Thermal degradation studies and kinetic modeling of cardoon (Cynara cardunculus) pyrolysis using thermogravimetric analysis (TGA). Bioresource technology, 102(10): 6230-6238. https://doi.org/10.1016/j.biortech.2011.02.060
[25] Fernandez, A., Saffe, A., Pereyra, R., Mazza, G., Rodriguez, R. (2016). Kinetic study of regional agro-industrial wastes pyrolysis using non-isothermal TGA analysis. Applied Thermal Engineering, 106: 1157-1164. https://doi.org/10.1016/j.applthermaleng.2016.06.084
[26] Du, Z., Ma, X., Li, Y., Chen, P., Liu, Y., Lin, X., Ruan, R. (2013). Production of aromatic hydrocarbons by catalytic pyrolysis of microalgae with zeolites: Catalyst screening in a pyroprobe. Bioresource Technology, 139: 397-401. https://doi.org/10.1016/j.biortech.2013.04.053
[27] Thangalazhy-Gopakumar, S., Adhikari, S., Chattanathan, S.A., Gupta, R.B. (2012). Catalytic pyrolysis of green algae for hydrocarbon production using H+ ZSM-5 catalyst. Bioresource Technology, 118: 150-157. https://doi.org/10.1016/j.biortech.2012.05.080
[28] Shirazi, Y., Viamajala, S., Varanasi, S. (2020). In situ and ex situ catalytic pyrolysis of microalgae and integration with pyrolytic fractionation. Frontiers in chemistry, 8: 786. https://doi.org/10.3389/fchem.2020.00786
[29] Ceylan, S., Topçu, Y. (2014). Pyrolysis kinetics of hazelnut husk using thermogravimetric analysis. Bioresource Technology, 156: 182-188. https://doi.org/10.1016/j.biortech.2014.01.040
[30] Ahmad, M.S., Mehmood, M.A., Taqvi, S.T.H., Elkamel, A., Liu, C.G., Xu, J., Gull, M. (2017). Pyrolysis, kinetics analysis, thermodynamics parameters and reaction mechanism of Typha latifolia to evaluate its bioenergy potential. Bioresource Technology, 245: 491-501. https://doi.org/10.1016/j.biortech.2017.08.162
[31] Chandrasekaran, A., Ramachandran, S., Subbiah, S. (2017). Determination of kinetic parameters in the pyrolysis operation and thermal behavior of Prosopis juliflora using thermogravimetric analysis. Bioresource Technology, 233: 413-422. https://doi.org/10.1016/j.biortech.2017.02.119
[32] Martín-Lara, M.A., Blázquez, G., Ronda, A., Calero, M. (2016). Kinetic study of the pyrolysis of pine cone shell through non-isothermal thermogravimetry: Effect of heavy metals incorporated by biosorption. Renewable Energy, 96: 613-624. https://doi.org/10.1016/j.renene.2016.05.026
[33] Abdelouahed, L., Leveneur, S., Vernieres-Hassimi, L., Balland, L., Taouk, B. (2017). Comparative investigation for the determination of kinetic parameters for biomass pyrolysis by thermogravimetric analysis. Journal of Thermal Analysis and Calorimetry, 129(2): 1201-1213. https://doi.org/10.1007/s10973-017-6212-9
[34] Kissinger, H.E. (1956). Variation of peak temperature with heating rate in differential thermal analysis. Journal of Research of the National Bureau of Standards, 57(4): 217-221.
[35] Flynn, J.H., Wall, L.A. (1966). General treatment of the thermogravimetry of polymers. Journal of Research of the National Bureau of Standards. Section A, Physics and Chemistry, 70(6): 487. http://dx.doi.org/10.6028/jres.070A.043
[36] Friedman, H.L. (1964). Kinetics of thermal degradation of char‐forming plastics from thermogravimetry. Application to a phenolic plastic. In Journal of Polymer Science Part C: Polymer Symposia. New York: Wiley Subscription Services, Inc., A Wiley Company, 6(1): 183-195. https://doi.org/10.1002/polc.5070060121
[37] Abd Aziz, M., Uemura, Y., Sabil, K.M. (2011). Characterization of oil palm biomass as feed for torrefaction process. In 2011 National Postgraduate Conference, 1-6. https://doi.org/10.1109/NatPC.2011.6136260
[38] Nyakuma, B.B., Johari, A., Ahmad, A., Abdullah, T.A.T. (2014). Comparative analysis of the calorific fuel properties of empty fruit bunch fiber and briquette. Energy Procedia, 52: 466-473. https://doi.org/10.1016/j.egypro.2014.07.099
[39] Kim, S.S., Ly, H.V., Kim, J., Choi, J.H., Woo, H.C. (2013). Thermogravimetric characteristics and pyrolysis kinetics of Alga Sagarssum sp. biomass. Bioresource Technology, 139: 242-248. https://doi.org/10.1016/j.biortech.2013.03.192
[40] Kongkaew, N., Pruksakit, W., Patumsawad, S. (2015). Thermogravimetric kinetic analysis of the pyrolysis of rice straw. Energy Procedia, 79: 663-670. https://doi.org/10.1016/j.egypro.2015.11.552
[41] Cai, J., Xu, D., Dong, Z., Yu, X., Yang, Y., Banks, S.W., Bridgwater, A.V. (2018). Processing thermogravimetric analysis data for isoconversional kinetic analysis of lignocellulosic biomass pyrolysis: Case study of corn stalk. Renewable and Sustainable Energy Reviews, 82: 2705-2715. https://doi.org/10.1016/j.rser.2017.09.113
[42] Surahmanto, F., Saptoadi, H., Sulistyo, H., Rohmat, T.A. (2017). Investigation of the slow pyrolysis kinetics of oil palm solid waste by the distributed activation energy model. Biofuels, 11(6): 663-670. https://doi.org/10.1080/17597269.2017.1387750