Edwin Villagran
© 2021 IIETA. This article is published by IIETA and is licensed under the CC BY 4.0 license (http://creativecommons.org/licenses/by/4.0/).
OPEN ACCESS
Insect proof screenhouse is increasingly used in tropical countries with a warm climate, as this type of structure is more economical than greenhouses and gives farmers the opportunity to optimize their production systems. In this work we used an experimentally validated two-dimensional numerical model, the objective was to study the air flow patterns and the thermal and hygrometric behavior of three screenhouses differentiated in their geometric configuration of the roof area and under four (4) outside wind speeds. The results obtained allowed us to find that the airflow speed inside the screenhouse can be maximized with respect to the most critical scenario by 29% for a wind speed of 0.5 ms-1 and up to 292% for a wind speed of 3.0 ms-1, which generates reductions in the average temperature inside the structure of -0.2℃ (0.5 ms-1) and up to -2.2℃ (3 ms-1). While the relative humidity presented values of 1.6% and 6.3% higher for these same speeds.
CFD simulation, airflow, temperature, relative humidity
The use of insect-proof screenhouses structures (S-MH) for horticultural and fruit production is becoming more and more widespread worldwide and cultivation areas under this production approach are steadily increasing year by year [1]. This type of structure is an intermediate technology between open field production and greenhouse production, in tropical countries with warm and moist climate conditions its implementation is an alternative of sustainable intensification for agricultural production [2-4]. The S-MH is generally a simpler and lower cost structure than the greenhouse, it is built on metal or wooden columns supporting a cover made of steel cables. On the side walls, insect proof porous screens are installed and on the cover, depending on the objective, shading or insect protection screens are installed [5].
The main objectives of the S-MH, depending on the type and material of the porous screen, are: to ensure the production of high quality food and to limit the vulnerability of fruit and vegetable production systems to the negative effects caused by supra-optimal climatic conditions of radiation, temperature, wind and precipitation [6]. The reduction in the amount of pesticides used for pest control is achieved because the porous screens create a physical restriction to the entry of pests into the growing area [7]. This system also reduces crop water consumption per cycle by modifying plant evapotranspiration rates [8, 9]. S-MH controls the growth cycles by modifying the radiation spectrum, and allows to obtain benefits in the post-harvest stage in products such as tomatoes, coriander and sweet peppers by extending their shelf life and improving organoleptic properties such as flavor, color and texture [10-12].
The porous screens that are used as roofing material in screenhouses have a series of physical, mechanical and radiometric properties, among which we can mention the degree of porosity, the texture type, the manufacturing material as well as the color and degree of shade generated. All these parameters influence the microclimate generated within the S-MH [13]. The management of the microclimate within the S-MH should consider the removal of heat and moisture excesses while allowing natural carbon enrichment for photosynthetic purposes. In the S-MH this is done through natural ventilation which is a simple and economical method for climate management that does not require large investments in control equipment. For this reason, the screenhouses are of great interest to farmers in various regions of the world [5, 14]. The knowledge of the generated microclimate within S-MH is a relevant factor for adequate crop management. Temperature is a factor driving many physiological processes, and each species has its own ideal temperature ranges to guarantee optimal yields [15]. Humidity is another key factor in agricultural production, high or low values of this variable can cause water stress problems in plants or lead to favorable environments for the development of diseases [16].
The architecture and geometric configuration of the S-MH are also parameters influencing the airflow patterns and, therefore, the microclimate generated inside these structures [3]. However, in many regions the establishment of S-HM is based on the empirical criteria of the producers or builders. This has generated that, in many occasions, not suitable structures are built unaware of the local climatic conditions of the region. Therefore, it is recommended that before the construction of an S-HM a design phase should be carried out. One of the design tools that has the capacity to generate an approximation to the probable microclimatic conditions that would be generated within an S-MH, is the computational fluid dynamics (CFD), a technique that has been widely used in greenhouses [17, 18] and in some screenhouses studies [19-21].
A CFD simulation is carried out in three phases including: (i) the pre-process phase that defines the study problem, in this phase the virtual geometry is generated and its numerical grid decomposition, likewise, the border conditions suitable for the study problem are defined; (ii) the calculation of the solution and checking the numerical convergence phase; and (iii) the post-processing phase including the spatial data of the microclimate variables under study and its validation through experimental measurements. Therefore, the objective of this work is to use a validated 2D CFD model in a screenhouse structure built in the Colombian Caribbean region, in order to evaluate and compare air flows as well as thermal and hygrometric distribution for three S-MH with different geometric configurations.
2.1 Description of the structures and climatic conditions
The geometrical configuration of the three models of screenhouse has as main characteristic the similarity in its cross-sectional dimension (x-axis), that is equivalent to 37 m (Figure 1). The S-MH1 is a flat roof with inclined walls structure with a height (y-axis) of 5 m, which represents a predominant configuration in many regions of the world (Figure 1a). The S-MH2 is an inclined wall, flat roof structure at two heights with minimum and maximum dimensions of 5 and 7 m, respectively (Figure 1b), Finally, the S-MH3 is equivalent to a structure with inclined walls and a combination of flat roof and inclined roof with a minimum height of 2.5 m on the sides and a maximum height of 7.0 m in the central area (Figure 1c). The S-MH3 model was built in the municipality of Sevilla, department of Magdalena, at the Caribbean Research Center of the Corporación Colombiana de Investigación Agropecuaria - AGROSAVIA. This structure was used to validate the numerical model, and it is equipped on its sides and on the roof with an insect proof porous screen with a thread count of 16.1 x 10.1 cm-2 and a porosity (ε) of 0.33. The same porous screen was established for the two remaining models of this study.
Figure 1. Geometric diagrams of the simulated screenhouse models
For the study region, available climate information recorded for a period of 30 years at a main climate station was analyzed. The multiannual mean data was 28.16℃, with maximum and minimum averages of 34.8 and 23.2℃, respectively. The relative humidity was above 60% and the yearly average precipitation was 1245. 1 mm. The wind speed in the region of study ranged between 0.5 and 3 m s-1, with a predominant W-E direction that is parallel to the location of the cross axis of the S-MH3 structure.
2.2 Numerical model and governing equations
In this study a two-dimensional model was considered because at local level, as in other regions of the world, the cross section of the structure is oriented parallel to the dominant wind direction. Therefore, this 2D approach allows to obtain fast and precise solutions of the air flows and the microclimate generated inside the structures [17, 22]. The resolution method used for the diffusion convection equations was the finite volume method with the general transport equation described in Eq. (1).
$\frac{\partial\left(u_{\emptyset}\right)}{\partial x}+\frac{\partial\left(v_{\emptyset}\right)}{\partial y}=\Gamma \nabla^{2} \emptyset+S_{\emptyset}$ (1)
where, x and y represent the coordinates in the Cartesian space, u and v are the components of the velocity vector, $\nabla^{2}$ is the Laplacian operator, $\Gamma$ is the diffusion coefficient, $\emptyset$ represents the concentration of the quantity transported in a dimensional form (Moment, mass and energy), and $S_{\emptyset}$ is the source term.
The closure model selected to simulate the turbulent component of the airflow was the standard semi-empirical model k-ε, which is based on two equations, one for the dissipation of kinetic energy ε (m2 s-3) and one for turbulent kinetic energy k (m2 s-3). This turbulence model is widely used for this type of study because of its robustness, computational commitment, accuracy and realism of the simulated flow [23, 24]. Also, the effect of air buoyancy caused by the force of gravity and air density changes were added to the momentum equation as a source term through the Boussinesq's approximation. The anti-insect screen was modelled as a porous media, taking into account its non-linear moment loss coefficient (Y) and permeability as a function of screen porosity (K). The airflow through this screen is governed by Eq. (2), that represents the Darcy-Forcheimer law.
$\frac{\partial p}{\partial x}=\frac{\mu}{K} u+\rho \frac{Y}{\sqrt{K}} u|u|$ (2)
where, u is the air velocity (m s-1); μ is the dynamic viscosity of the fluid (kg m-1 s-1); ρ is the density of air (kg m-3), and ∂x the thickness of the porous material (m). The K and Y factors are determined through experimental equations that can be reviewed in the study of Valera et al. [25]. The aerodynamic coefficients requested by the CFD model for the type of insect screen used in this study, are similar to those reported by Flores-Velazquez et al. [3].
The change in the amount of water vapor that occurs in the air flow was modeled by activating the species transport model in the computer domain, establishing the initial conditions as reported by Rojano et al. [26] and Villagrán et al. [17]. The effect of solar radiation on the inner microclimate of the structures was not simulated by using any of the available solution models for the radiative transfer equation, however the effect of the radiation was included in an indirect way establishing a heat flow surface on the ground of each of the structures. This methodology has been successfully applied showing precise numerical results in several similar studies, such as the one by Khaoua et al. [27] and more recently by Villagrán and Bojacá [28].
The numerical simulations were carried out under steady state conditions for the most extreme local climatic conditions, not including the presence of any type of crop. The latter in order to simplify the model and speed up the numerical calculation also to obtain the thermal distribution under the worst possible scenario. This scenario occurs when there is no presence of plant species that allow the modification of microclimate conditions through the transfer of heat and mass with the surrounding air. In order to solve the pressure-momentum coupled equations, a semi-implicit solution method was adopted for the pressure-linked equations through a second order discretization scheme for momentum, energy and turbulence, the convergence criteria for these variables were set at 10-6.
2.3 Generation of meshing and boundary conditions
To allow the generation of an adequate definition of the atmospheric boundary layer, to avoid any perturbation on the development of the air flow and in accordance with the guidelines of good practice for CFD, a large computational domain (DC) was built where each one of the three structures was included. The general dimensions of each DC were 247 m long (x axis) and 70 m high (y axis), dimensions that were established from the recommendations given by Perén et al. [29]. Another process evaluated based on recommendations from previous similar studies was the definition of the numerical grid for each DC, this was done following the process described in the work developed by He et al. [30]. The defined sizes were 622,183, 631,298 and 625,198 of square elements composed in an unstructured numerical grid (Figure 2). These sizes guarantee a solution that will not present any bias associated with the number of elements in the grid. The quality of each numerical grid was evaluated by means of the asymmetry factor, finding that the three numerical grids had values higher than 95% of the volumes within the range of asymmetry of 0-0.25, a range considered to be of high quality [31].
Figure 2. Detail of the numerical grid for each screenhouse
The boundary conditions established in the DC were a symmetrical condition for the upper region, a pressure outlet condition for the side where the simulated airflow exits, the floor region of the DC and each screenhouse was established as a wall region. The roof and walls of the structures were established as porous media and the boundary where the airflow enters was established as an inlet boundary, establishing a vertical logarithmic velocity distribution profile as proposed by Khaoua et al. [27]. Adjustments were made according to the characteristics of the region of study. The physical and optical properties of the materials used in the simulation can be reviewed in Table 1. Also, the characteristics of the porous screen and its associated aerodynamic properties are reported in Table 2.
Table 1. Properties of materials used in the CFD simulation
|
Properties of materials |
|||
|
Air |
Soil |
Porous screen |
|
|
Density (ρ, kg m-3) |
1.225 |
1300 |
990 |
|
Thermal conductivity (k, W m-1 K-1) |
0.0242 |
1.6 |
0.33 |
|
Specific heat (Cp, J K-1 kg-1) |
1006.43 |
1738 |
1900 |
|
Coefficient of thermal expansion (K-1) |
0.0033 |
||
Table 2. Aerodynamic properties of the porous screen used in the simulations
|
Number or threads per cm |
Porosity (ε) |
Diameter pore (mm) |
Diameter thread (mm) |
Effect Viscosity (α) |
C2 |
|
16.1*10.2 |
0.33 |
0.30 |
0.32 |
3.98e-09 |
19185 |
2.4 Model validation
During the period from 1 November 2019 to 31 January 2020 on the experimental site where S-MH3 has been constructed, climate information was recorded and stored in the screenhouse external and internal environment at a 10-minute interval. In the outside environment, a weather station Davis-Vantage 2 plus 6162 (Davis Instruments, Hayward, CA, EE. UU.) was used, while inside the screenhouse over the cross section (x-axis), at a height of 1.5 m above the ground (y-axis), 5 micro weather stations of the WatchDog 1000 series (Spectrum Technologies, Aurora, IL) were uniformly distributed. The collected experimental data was analyzed for a time of day selecting the hour 9, for which a 2D simulation in S-MH3 was carried out establishing as initial simulation conditions the average meteorological values obtained in the external environment (Table 3).
Table 3. Initial conditions established for the validation simulation
|
Conditions |
Value |
|
Hour |
9:00 |
|
Temperature (°C) |
32.4 |
|
Relative humidity (%) |
72.2 |
|
Solar radiation (wm-2) |
267.3 |
|
Wind speed (ms-1) |
1.68 |
|
Wind direction |
E |
Once convergence is reached for this simulation, temperature and relative humidity data are extracted from the spatial coordinates that match the measurement points inside S-MH3. These simulated data are compared with the data measured through goodness-of-fit parameters such as the mean absolute error (MAE) calculated with Eq. (3), the root mean square error (RMSE) with Eq. (4) and the mean absolute percentage error (MAPE) with Eq. (5).
$\mathrm{MAE}=\frac{1}{\mathrm{~m}} \sum_{\mathrm{i}=1}^{\mathrm{m}}|\mathrm{dmi}-\mathrm{dsi}|$ (3)
$\mathrm{RMSE}=\sqrt{\frac{\sum_{\mathrm{i}=1}^{\mathrm{m}}(\mathrm{dmi}-\mathrm{dsi})^{2}}{\mathrm{~m}}}$ (4)
$\mathrm{MAPE}=\frac{\sum_{\mathrm{i}=1}^{\mathrm{n}} \frac{|\mathrm{dmi}-\mathrm{d} s \mathrm{i}|}{|\mathrm{dmi}|}}{\mathrm{n}}$ (5)
where, dmi corresponds to the value of the measured temperature and relative humidity, dsi the simulated temperature and relative humidity data and m the number of data compared. The CFD model can only be used for the study of air flows and their effect on microclimate variables in the structures evaluated, once it is ensured that the values of MAE, RMSE and MAPE are relatively small and close to 0.
2.5 Simulated scenarios
Once the numerical model was validated in S-MH3, this model was used to develop the simulations for three specific scenarios. The scenarios considered the structures S-MH1, S-MH2 and S-MH3, evaluated for 4 external wind speeds and average maximum temperature and average relative humidity conditions reported in the study region, which can be considered the critical average conditions to which the evaluated structures would be exposed (Table 4).
Table 4. Initial CFD simulation conditions for each evaluated scenario
|
Scenario |
Air temperatura (°C) |
Relative humidity (%) |
Wind speed (ms-1) |
Wind Direction |
|
S-MH1-S1 S-MH1-S2 S-MH1-S3 S-MH1-S4 |
34.8 34.8 34.8 34.8 |
60 60 60 60 |
0.5 1 2 3 |
E E E E |
|
S-MH2-S1 S-MH2-S2 S-MH2-S3 S-MH2-S4 |
34.8 34.8 34.8 34.8 |
60 60 60 60 |
0.5 1 2 3 |
E E E E |
|
S-MH3-S1 S-MH3-S2 S-MH3-S3 S-MH3-S4 |
34.8 34.8 34.8 34.8 |
60 60 60 60 |
0.5 1 2 3 |
E E E E |
3.1 Validation of the CFD model
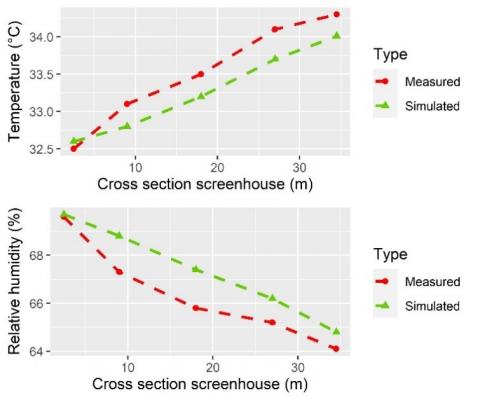
Figure 3. Graphs of behavior for measured and simulated temperature and relative humidity
Quantitatively the goodness-of-fit parameters for temperature showed values of 0.27 and 0.31°C for MAE and RMSE, while for MAPE a value of 0.34% was obtained. In the case of relative humidity, the values for MAE and RMSE were 1.01 and 1.23% respectively and 1.91% for MAPE. On the other hand, qualitatively when plotting the behavior curves for temperature and relative humidity for both the measured and simulated data, the data sets showed similar behavior across the cross section of the screenhouse evaluated (Figure 3).
Therefore, these results of the validation process allow us to deduce that the CFD model makes satisfactory predictions of the thermal and hygrometric behavior for the evaluated screenhouse and can be used for the research objective of this work.
3.2 Air velocity and flow vectors
The qualitative behavior of the airflow patterns showed differentiated behaviors depending on the geometry of the screen houses evaluated (Figure 4). In the case of S-MH1, for the scenarios S1 and S4 which are the low and high-speed scenarios (0.5 and 3 ms-1), two behaviors previously reported for this type of screenhouses can be observed. For the low speed case S1, the pattern is an airflow that enters the structure from the windward side, loses speed and is directed following the same direction of the outside wind towards the leeward wall where the airflow leaves the structure. There is also a strong interaction of the airflow patterns on the flat roof of the structure, which is consistent with what has been reported by Teitel and Wenger [19].
For the case of S2, an airflow pattern enters S-MH1 from the windward side, rises to the roof area where the greatest interaction between the external and internal airflow is observed and the greatest velocity of the flow pattern is observed until it exits from the windward side, On the other hand, it can be seen that over the area where the crop is developed, in an area that includes the middle of S-MH1 and the leeward side, a low speed air flow is generated in the opposite direction to the direction of the external air flow, which corresponds to what is reported for the same external wind speed by Teitel et al. [32]. These results support the validity of the CFD model used in this study.
Figure 4. Airflow patterns (ms-1) obtained by simulation
The airflow patterns for S-HM2 and S-HM3 under the same low and high velocity scenarios, on the contrary, with respect to S-HM1 show airflow patterns with a higher velocity and directed towards the cultivation area, an effect that can be observed in greater intensity in S-HM3 (Figure 4). In quantitative terms the average airflow velocity inside the greenhouse at a height above ground level of 1.5 m (Vin) was calculated, finding that for S-MH1 the values ranged from 0.24± 0.06 ms-1 to 0.41± 0.35 ms-1 for S1 and S4, respectively. In the case of S-MH2, the Vin values for S1 and S4 compared to S-MH1 were 16% and 92% higher respectively, while for S-MH3 compared to S-MH1 the Vin values were 29% and 292% for S1 and S4 respectively. These trends were also observed for the speeds of S2 and S3 (Table 5).
Table 5. Mean velocity (Vin) and normalized velocity (VN) values obtained for each simulated scenario
|
Scenario |
Vin (ms-1) |
VN
|
|
S-MH1-S1 S-MH1-S2 S-MH1-S3 S-MH1-S4 S-MH2-S1 S-MH2-S2 S-MH2-S3 S-MH2-S4 S-MH3-S1 S-MH3-S2 S-MH3-S3 S-MH3-S4 |
0.24± 0.06 0.33± 0.08 0.35± 0.28 0.41± 0.35 0.28± 0.06 0.41± 0.10 0.61± 0.17 0.79± 0.26 0.31± 0.09 0.42± 0.09 0.72± 0.15 1.19± 0.31 |
0.54± 0.13 0.33± 0.08 0.17± 0.09 0.13± 0.11 0.55± 0.12 0.41± 0.11 0.30± 0.08 0.27± 0.09 0.61± 0.17 0.40± 0.11 0.36± 0.08 0.39± 0.09 |
Another parameter calculated to evaluate the indoor air flows of the screenhouses was the normalized velocity (VN). This is calculated as the ratio between the inside air flow speed and the outside wind speed (Vin/Wind speed). The values of VN (Table 5) allow us to deduce that the reductions in the speed of the air flow inside the structures are greater as the speed of the external wind increases. Although this speed reduction is more critical for the S-MH1 with values between 46 and 87%, results that agree with the study by Flores-Velazquez and Montero [20], they adjusted a linear regression line to this type of behavior.
The VN distribution profile at a height of 1.5 m above ground level in the cross sections of each S-HM shows that the most pronounced loss of velocity occurs between the windward wall and the next 5 meters inside the structure (Figure 5). This is caused by the pressure changes generated by the presence of the anti-insect screen which restricts the flow of air [33]. Once inside the structures, the air flow between 5 and 15 m (x axis) for each of the simulated cases presents a speed recovery, this is influenced by the air intake that occurs through the roof region of the structures and by the contribution of the natural ventilation thermal effect, the speed increase presents higher values for the S-HM3 scenario. After this speed recovery and as the air flows approach the leeward stop they lose speed again. This behavior agrees with the one reported by Flores-Velazquez and Montero [20] in a study realized for a screenhouse without the presence of the crop.
Figure 5. Standard velocity distribution (VN) profiles inside the screenhouses
3.3 Spatial temperature distribution
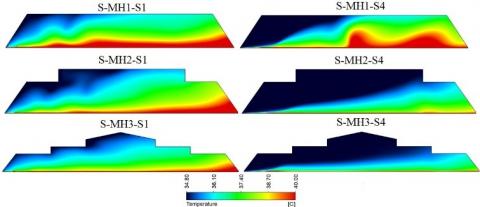
The spatial behavior of temperature inside the structures without the presence of crops is related to the spatial distribution of air flows, therefore, flows with greater intensity and speed will generate lower temperature values and reciprocally (Figure 6). Generally speaking, it can be seen that for the low-speed scenario and depending on the airflow conditions already discussed, thermal conditions are generated that show quite heterogeneous behavior, which shows that for low wind speeds, screenhouses with insect screens can generate undesirable thermal conditions resulting from inefficient ventilation [21]. For scenario S4 a more homogeneous thermal behavior is observed in the structures S-MH2 and S-MH3. For the case of S-MH1, it is observed how in the region where the flow pattern is generated with the contrary direction to that of the external environment, a heat patch is formed that is distributed from the center of the structure to the leeward wall (Figure 6).
The quantitative results of the thermal behavior allow us to observe how the less warm and more homogeneous conditions are presented for the scenarios simulated in S-MH3 (Table 6). The average temperature in the interior (Tin) of each one of the structures was calculated, obtaining values for S-MH1 of 37.9 ± 1.21℃ and 37.6± 1.82℃ for S1 and S4 respectively. The temperature does not present a significant reduction depending on the speed of the external wind under the specific conditions of this structure and the region of study. For S-MH2 and S-HM3, the Tin values were -0.2℃ and -0.6℃ lower than S-MH1 for S1, while for S4 these same values were -1.6℃ and -2.2℃ lower than S-MH1. These results of the thermal behavior allow us to conclude that for the region of study and for the length of the cross section of the structures evaluated, the modification of the roof of the conventional structure allows to generate more homogeneous and less warm distributions of temperature. This is a key factor at the time of deciding which type of geometry to use, since temperature is a variable directly related to the physiological processes of growth and development of the plants. Therefore, an improvement in this type of behavior can affect the quality of the final product harvested [34].
Another thermal parameter calculated was the average thermal differential ΔTm that exists between the internal temperature of the structures and the temperature of the external environment (Table 6). The results indicated what we have already discussed about the warmer thermal conditions for S-MH1.
Figure 6. Temperature distribution patterns (℃) obtained by simulation
Table 6. Mean temperature (Tm) and thermal differential values (ΔTm) obtained by simulation inside each structure
|
Scenario |
Tin (℃) |
ΔTm (℃) |
|
S-MH1-S1 S-MH1-S2 S-MH1-S3 S-MH1-S4 S-MH2-S1 S-MH2-S2 S-MH2-S3 S-MH2-S4 S-MH3-S1 S-MH3-S2 S-MH3-S3 S-MH3-S4 |
37.9± 1.21 37.7± 1.17 37.7± 1.58 37.6± 1.82 37.7± 1.21 37.1± 1.18 36.5± 1.05 36.0± 1.11 37.3± 1.05 36.8± 0.91 36.0± 0.71 35.4± 0.64 |
3.08 2.96 2.93 2.80 2.94 2.31 1.67 1.39 2.41 2.01 1.19 0.68 |
The behavior of the thermal differential was also calculated for the cross section at 1.5 m above ground level for the 3 structures (Figure 7). We can see graphically, how the conditions for S-HM1 can reach regions with up to +5.8℃ with respect to the outside temperature, while for S-HM2 and S-HM3 these maximum values are +4.9℃ and +4.0℃ for outside wind conditions of 0.5 and 1.0 ms-1. For the case of outside speed of 3.0 ms-1, the thermal differential values reached a maximum value of +2.5 and +1.9℃, values that are similar to those reported by Möller et al. [35] for a screenhouse with insect-proof screens.
Figure 7. Distribution profiles of the thermal differential inside the screenhouses
3.4 Spatial distribution of relative humidity
The spatial distribution patterns for relative humidity, qualitatively, allow us to observe gradients for this variable in the horizontal and vertical directions, which are generated in this case of study, without the presence of crops, by the air flow patterns and temperature distribution (Figure 8). The highest humidity values occur in the regions where the inside environment has more interaction with the outside environment, which are the windward wall and the roof region of the structures, this coincides with what is reported by Teitel et al. [14]. The distribution of relative humidity without the presence of crops is restricted to the psychrometric relationship of the humid air with respect to the temperature. Therefore, the patterns of spatial distribution are inverse to those of temperature, with which the driest regions coincide with the hottest regions and likewise in the opposite sense.
Figure 8. Relative humidity distribution patterns (%) obtained by simulation
The mean value of the relative humidity (RHin) inside the structures was calculated over the cross-section region at 1.5 m above ground level, finding that the values varied between 49.7 and 56.6% as minimum and maximum values respectively (Table 7). We found that for this variable, the most homogeneous behavior was obtained in S-MH3-S4, which is also the scenario that presented the best air flow and thermal behavior among all the cases evaluated. The humidity analysis was complemented with the calculation of the average relative humidity gradient (ΔRHm) between the interior of the structures and the exterior environment, finding that all ΔRHm present negative values up to -10.3% for the most critical case which was the scenario S-MH1-S1.
Table 7. Values of average relative humidity (RHin) and relative humidity differential (ΔRHm) obtained by simulation inside each structure
|
Scenario |
RHin (%) |
ΔRHm (%) |
|
S-MH1-S1 S-MH1-S2 S-MH1-S3 S-MH1-S4 S-MH2-S1 S-MH2-S2 S-MH2-S3 S-MH2-S4 S-MH3-S1 S-MH3-S2 S-MH3-S3 S-MH3-S4 |
49.7± 3.10 50.1± 3.30 50.3± 4.44 50.5± 5.09 49.9± 3.83 51.2± 3.21 53.7± 3.05 54.6± 3.32 51.3± 2.92 52.5± 2.80 55.0± 2.51 56.6± 2.24 |
-10.3 -9.9 -9.7 -9.5 -10.1 -8.8 -6.3 -5.4 -8.7 -7.5 -5.0 -3.4 |
The negative values occur because inside the structures there is no crop that can provide moisture through the process of transpiration or evaporation of irrigation water. For that reason what is reported in this investigation differs from other experimental studies in screenhouses with some type of crop, where the relative humidity in the interior is greater than that of the external environment as mentioned by Tanny [36].
The results found in this research allow us to conclude that the geometric shape and disposition of the roof area of the screenhouse have a relevant impact on the thermal and hygrometric behavior inside these structures. Therefore, this study can provide a starting point for producers, decision makers or builders to carry out a more rigorous analysis on the most appropriate design of the screenhouse, taking into account the local climatic conditions of the region where it is intended to be implemented. The methodological approach used in this research can be applied in other regions of the world and for various climatic conditions.
At a local level, in the Caribbean region where this study was developed, the production of vegetables is limited by extreme climatic conditions of high radiation and temperature. This work is a numerical approximation to determine the suitability of this type of technology and its adaptation to different types of fruit and vegetable crops. Therefore, future works should include the evaluation of microclimate and air flows with the presence of crops of economic and nutritional importance for the Caribbean region.
In this research it was proposed to validate a 2D CFD numerical model in a net house structure built in the Colombian Caribbean region. The results of the validation process showed that the numerical model satisfactorily predicted the thermal and hygrometric distribution inside the evaluated screenhouse structure.
The validated CFD model was used to determine the airflow behavior and its effect on the spatial distribution of temperature and humidity in two other screenhouse structures that differ in their geometric shape in the roof area. The results found allowed to verify that the shape of the roof of the screenhouse generates modifications on the distribution and speed of the flow patterns, finding that this type of modifications with respect to the standard structure used in many regions of the world, allows to maximize the speed of the airflow up to 292%.
It was also found that the modification of air flows generated microclimate conditions more suitable for agricultural production in hot climate regions. In these regions, the temperature and relative humidity differentials between the indoor and outdoor environments were +2.0 °C and -3.4% respectively, differentials that can be considered low compared to those reported in other studies for screenhouses or greenhouses under this type of climate conditions.
The authors are grateful to the Corporación Colombiana de Investigación Agropecuaria - AGROSAVIA for technical and administrative support in this study and to the Regional Fund for Agricultural Technology (FONTAGRO) for funding research entitled Innovations for horticulture in protected environments in tropical zones: option for sustainable intensification of family agriculture in the context of climate change in LAC. The opinions expressed in this publication are solely those of the authors and do not necessarily reflect the views of FONTAGRO, its Board of Directors, the Bank, its sponsoring institutions, or the countries it represents
|
S-MH |
Insect-proof screenhouses |
|
CFD |
Computational fluid dynamics |
|
Vin |
Mean velocity (ms-1) |
|
dmi |
Observed temperature and humidity data (°C) |
|
dsi |
Simulated temperature and humidity data (°C) |
|
g |
Gravitational acceleration, (m.s-2) |
|
k |
Thermal conductivity (W.m-1. K-1) |
|
VN |
The normalized wind speed |
|
MAE |
Absolute mean error (°C, %) |
|
MSE |
Mean square error (°C, %) |
|
Sϕ |
Source term |
|
Tin |
Mean temperature inside (°C) |
|
uj |
Components of speed (ms-1) |
|
Greek symbols |
|
|
Γϕ |
The diffusion coefficient |
|
ΔT |
Thermal gradient (°C) |
|
ΔRH |
Humidity gradient (%) |
|
k |
turbulent kinetic energy k (m2 s-3) |
|
$\mathcal{E}$ |
turbulent kinetic energy dissipation rate (m2.s-3) |
|
µ |
dynamic viscosity (kg.m-1.s-1) |
|
$\mu_{t}$ |
turbulent viscosity (kg.m-1.s-1) |
|
$\rho_{0}$ |
density (Kg.m-3) |
[1] Tanny, J., Lukyanov, V., Neiman, M., Cohen, S., Teitel, M., Seginer, I. (2018). Energy balance and partitioning and vertical profiles of turbulence characteristics during initial growth of a banana plantation in a screenhouse. Agricultural and Forest Meteorology, 256: 53-60. https://doi.org/10.1016/j.agrformet.2018.02.028
[2] Tanny, J. (2013). Microclimate and evapotranspiration of crops covered by agricultural screens: A review. Biosystems Engineering, 114(1): 26-43. https://doi:10.1016/j.biosystemseng.2012.10.008
[3] Flores-Velazquez, J., Ojeda, W., Villarreal-Guerrero, F., Rojano, A. (2015). Effect of crops on natural ventilation in a screenhouse evaluated by CFD simulations. In International Symposium on New Technologies and Management for Greenhouses-GreenSys, 1170: 95-102. https://doi.org/10.17660/ActaHortic.2017.1170.10
[4] Vidogbéna, F., Adégbidi, A., Assogba-Komlan, F., Martin, T., Ngouajio, M., Simon, S., Parrot, L. (2015). Cost: benefit analysis of insect net use in cabbage in real farming conditions among smallholder farmers in Benin. Crop Protection, 78: 164-171. https://doi.org/10.1016/j.cropro.2015.09.003
[5] Mahmood, A., Hu, Y., Tanny, J., Asante, E.A. (2018). Effects of shading and insect-proof screens on crop microclimate and production: A review of recent advances. Scientia Horticulturae, 241: 241-251. https://doi:10.1016/j.scienta.2018.06.078
[6] Mupambi, G., Anthony, B.M., Layne, D.R., Musacchi, S., Serra, S., Schmidt, T., Kalcsits, L.A. (2018). The influence of protective netting on tree physiology and fruit quality of apple: A review. Scientia Horticulturae, 236: 60-72. https://doi.org/10.1016/j.scienta.2018.03.014
[7] Teitel, M., Garcia-Teruel, M., Ibanez, P.F., Tanny, J., Laufer, S., Levi, A., Antler, A. (2015). Airflow characteristics and patterns in screenhouses covered with fine-mesh screens with either roof or roof and side ventilation. Biosystems Engineering, 131: 1-14. https://doi.org/10.1016/j.biosystemseng.2014.12.010
[8] Pirkner, M., Dicken, U., Tanny, J. (2014). Penman-Monteith approaches for estimating crop evapotranspiration in screenhouses-a case study with table-grape. International Journal of Biometeorology, 58(5): 725-737. https://doi.org/10.1007/s00484-013-0653-z
[9] Haijun, L., Cohen, S., Lemcoff, J.H., Israeli, Y., Tanny, J. (2015). Sap flow, canopy conductance and microclimate in a banana screenhouse. Agricultural and Forest Meteorology, 201: 165-175. https://doi.org/10.1016/j.agrformet.2014.11.009
[10] Ilić, Z.S., Milenković, L., Šunić, L., Fallik, E. (2015). Effect of coloured shade‐nets on plant leaf parameters and tomato fruit quality. Journal of the Science of Food and Agriculture, 95(13): 2660-2667. https://doi.org/10.1002/jsfa.7000
[11] Ilić, Z.S., Fallik, E. (2017). Light quality manipulation improves vegetable quality at harvest and postharvest: A review. Environmental and Experimental Botany, 139: 79-90. https://doi.org/10.1016/j.envexpbot.2017.04.006.
[12] Ilić, Z.S., Milenković, L., Šunić, L., Barać, S., Mastilović, J., Kevrešan, Ž., Fallik, E. (2017). Effect of shading by coloured nets on yield and fruit quality of sweet pepper. Zemdirbyste-Agriculture, 104(1): 53-62. https://doi.org/10.13080/z-a.2017.104.008
[13] Teitel, M., Vitoshkin, H., Geoola, F., Karlsson, S., Stahl, N. (2018). Greenhouse and screenhouse cover materials: literature review and industry perspective. Acta Horticulturae. 1227: 31-44. https://doi.org/10.17660/ActaHortic.2018.1227.4
[14] Teitel, M., Garcia-Teruel Rguez, M., Liang, H., Tanny, J., Ozer, S., Alon, H. (2017). Vertical profiles of temperature, humidity ratio and air velocity in different types of insect-proof screenhouse. International Symposium on New Technologies for Environment Control, Energy-Saving and Crop Production in Greenhouse and Plant, pp. 205-212. https://doi.org/10.17660/ActaHortic.2018.1227.25
[15] Singh, M.C., Singh, J.P., Singh, K.G. (2018). Development of a microclimate model for prediction of temperatures inside a naturally ventilated greenhouse under cucumber crop in soilless media. Computers and Electronics in Agriculture, 154: 227-238. https://doi.org/10.1016/j.compag.2018.08.044
[16] Bournet, P.E. (2014). Assessing greenhouse climate using CFD: A focus on air humidity issues. Acta Hortic, 1037: 971-986. https://doi.org/10.17660/ActaHortic.2014.1037.129
[17] Villagrán, E.A., Romero, E.J.B., Bojacá, C.R. (2019). Transient CFD analysis of the natural ventilation of three types of greenhouses used for agricultural production in a tropical mountain climate. Biosystems Engineering, 188: 288-304. https://doi:10.1016/j.biosystemseng.2019.10.026
[18] Mesmoudi, K., Meguellati, K., Bournet, P.E. (2017). Thermal analysis of greenhouses installed under semi arid climate. International Journal of Heat and Technology, 35(3): 474-486. https://doi.org/10.18280/ijht.350304
[19] Teitel, M., Wenger, E. (2012). The effect of screenhouse roof shape on the flow patterns - CFD simulations. Acta Horticulturae, 927: 603-610. https://doi.org/10.17660/ActaHortic.2012.927.74
[20] Flores-Velazquez, J., Montero, J.I. (2008). Computational fluid dynamics (CFD) study of large scale screenhouses. In International Workshop on Greenhouse Environmental Control and Crop Production in SemiArid Regions, 797: 117-122. https://doi.org/10.17660/ActaHortic.2008.797.14
[21] Flores-Velazquez, J., Villarreal Guerrero, F., Lopez, I.L., Montero, J.I., Piscia, D. (2013). 3-dimensional thermal analysis of a screenhouse with plane and multispan roof by using computational fluid dynamics (CFD). Acta Horticulturae, 1008: 151-158. https://doi.org/10.17660/ActaHortic.2013.1008.19
[22] Kichah, A., Bournet, P.E., Migeon, C., Boulard, T. (2012). Measurement and CFD simulation of microclimate characteristics and transpiration of an Impatiens pot plant crop in a greenhouse. Biosystems Engineering, 112(1): 22-34. https://doi.org/10.1016/j.biosystemseng.2012.01.012
[23] Senhaji, A., Mouqallid, M., Majdoubi, H. (2019). CFD assisted study of multi-chapels greenhouse vents openings effect on inside airflow circulation and microclimate patterns. Open Journal of Fluid Dynamics, 9(2): 119-139. https://doi.org/10.4236/ojfd.2019.92009
[24] Ali, H.B., Bournet, P.E., Cannavo, P., Chantoiseau, E. (2018). Development of a CFD crop submodel for simulating microclimate and transpiration of ornamental plants grown in a greenhouse under water restriction. Computers and Electronics in Agriculture, 149: 26-40. https://doi.org/10.1016/J.COMPAG.2017.06.021
[25] Valera, D.L., Álvarez, A.J., Molina, F.D. (2006). Aerodynamic analysis of several insect-proof screens used in greenhouses. Spanish Journal of Agricultural Research, 4(4): 273-279. https://doi.org/10.5424/sjar/2006044-204
[26] Rojano, F., Flores-Velázquez, J., Villarreal-Guerrero, F., Rojano, A. (2014). Dynamics of climatic conditions in a greenhouse: two locations in Mexico. Acta Horticulturae, 1037: 955-962. https://doi.org/10.17660/ActaHortic.2014.1037.127
[27] Khaoua, S.O., Bournet, P.E., Migeon, C., Boulard, T., Chasseriaux, G. (2006). Analysis of greenhouse ventilation efficiency based on computational fluid dynamics. Biosystems Engineering, 95(1): 83-98. https://doi.org/10.1016/j.biosystemseng.2006.05.004
[28] Villagran, E., Bojaca, C.R. (2019). CFD simulation of the increase of the roof ventilation area in a traditional Colombian greenhouse: Effect on air flow patterns and thermal behavior. International Journal of Heat and Technology, 37(3): 881-892. https://doi.org/10.18280/ijht.370326
[29] Perén, J.I., van Hooff, T., Leite, B.C.C., Blocken, B. (2016). CFD simulation of wind-driven upward cross ventilation and its enhancement in long buildings: Impact of single-span versus double-span leeward sawtooth roof and opening ratio. Building and Environment, 96: 142-156. https://doi.org/10.1016/j.buildenv.2015.11.021
[30] He, X., Wang, J., Guo, S., Zhang, J., Wei, B., Sun, J., Shu, S. (2018). Ventilation optimization of solar greenhouse with removable back walls based on CFD. Computers and Electronics in Agriculture, 149: 16-25. https://doi.org/10.1016/j.compag.2017.10.001
[31] Baeza, E.J., Sapounas, A., Stanghellini, C., Bonachela, S., Hernández, J., Montero, J.I., López, J.C., Granados, M.R., Muñoz, P., Lorenzo, P., Fernández-del Olmo, P. (2017). Numerical simulation of the effect of different mulches on the heat storage capacity of a Mediterranean greenhouse soil. Acta Horticulturae, 1170: 119-128. https://doi.org/10.17660/ActaHortic.2017.1170.13
[32] Teitel, M., Liang, H., Vitoshkin, H., Tanny, J., Ozer, S. (2020). Airflow patterns and turbulence characteristics above the canopy of a tomato crop in a roof-ventilated insect-proof screenhouse. Biosystems Engineering, 190: 184-200. https://doi.org/10.1016/j.biosystemseng.2019.12.001
[33] Flores-Velazquez, J., Arzeta, A., Ojeda, W., Villarreal-Guerrero, F. (2018). Computational fluid dynamics analysis of the wind drag force in a typical Mexican screenhouse. Acta Hortic. 1227: 99-106. https://doi.org/10.17660/ActaHortic.2018.1227.12
[34] Ma, D., Carpenter, N., Maki, H., Rehman, T.U., Tuinstra, M.R., Jin, J. (2019). Greenhouse environment modeling and simulation for microclimate control. Computers and Electronics in Agriculture, 162: 134-142. https://doi.org/10.1016/j.compag.2019.04.013
[35] Möller, M., Tanny, J., Cohen, S., Teitel, M. (2003). micrometeorological characterisation in a screenhouse. Acta Horticulturae, 614: 445-451. https://doi.org/10.17660/ActaHortic.2003.614.67
[36] Tanny, J. (2013). Microclimate and evapotranspiration of crops covered by agricultural screens: A review. Biosystems Engineering, 114(1): 26-43. https://doi.org/10.1016/j.biosystemseng.2012.10.008