Mohammed Aissa* | Azzedine Boutelhig
© 2021 IIETA. This article is published by IIETA and is licensed under the CC BY 4.0 license (http://creativecommons.org/licenses/by/4.0/).
OPEN ACCESS
Only scarce studies that were adopted have considered two properties, the structure safety and energy, where the aero-dynamic and energetic phenomena were taken into account simultaneously in the agricultural greenhouses area. In fact, in this numerical study, the response of the greenhouse has been investigated in outside climate conditions, by considering the orientation relatively to the wind direction velocity and solar trajectory. A resolution of the physical problem combined between the thermal and dynamical fluid flow equations have been based on the Ansys Fluent software. The results showed that the difference between inside and outside air temperature of greenhouse has been strongly affected by the reorientation of the tunnel greenhouse structure, or by the design of the tunnel structure that was adopted in the dome and chapel shape. Moreover, the safety properties of greenhouse structure linked to the drag stress can be developed when based on the interaction fluid-structure analysis. In this view, a temperature profile evolution versus different heights inside greenhouse was highlighted. As well as like continues of our previous study of the drag evolution over tunnel design body proved by the results found in the literature will be compared with chapel and dome designs.
tunnel, chapel, dome, temperature, drag
The agricultural infrastructure technics offered great opportunity in improving production in quality and quantity within small areas. However, great challenges are generally appearing during erection works according to Shamshiri et al. [1, 2]. These technics play big role in improving the quality and predictability of crops, which require monitoring different factors influencing on the crop evolution, such as temperature, solar beam, humidity, internal carbon dioxide levels. The obtained data allows end-users in taking preventive measures to protect crops from the action of rain, strong winds and pests [3-5]. The growth optimality of a certain type of crop are generally achieved by a suitable greenhouse’s architectural design. This being the case of structural design of greenhouses, studied on the basis of applicable normative instructions [5-8]. The agricultural construction technic is currently used in high speed, due to its safety against structural damage, its flexibility design against stress from severe wind speeds, as well as its characteristics in normalizing the inside light [9]. On other hand, a vent in wall and roof design can playing an important role on inside microclimate [10-13]. In their numerical study Edwin et al. [14], the vents position in the roof area of a traditional greenhouse influence on the airflow patterns and thermal behavior increasing ventilation rates performance. The circulation process of the indoor air in the greenhouse is based for two physical ways, the first one known by a static component due to the wind outside air speed and the second one is a dynamic component produced by the buoyancy phenomenon [15, 16]. The external metrological conditions and design greenhouse factors such as a shape and orientation of the greenhouse can control considerably the natural ventilation in order to offer an adequate inside microclimate conditions in the greenhouse [17, 18]. in the structural design study of greenhouses, the effects of wind intensity and direction are taken into consideration in the way to allow a more favorable internal climate for cultivation. In this view, the main purpose of this attempt is to run analysis through computer modelling the behavior of stress on the structures of tunnel greenhouses acquired from the wind drag force, making comparison between the longitudinal and transversal wind directions a round tunnel greenhouse. Thereby, the designs dome and chapel greenhouses influence in temperature profile and stress evolution under low solar radiation and wind velocity beyond the structure are considered in this work. We have found that the wind speed and geometric of the greenhouse affect considerably in the physical phenomena through the fluid structure interaction principal. Where the transversal position of tunnel greenhouse accelerates a transition toward turbulent and more favorite the heat transfers than longitudinal position. On the other hand, a dome geometry associate to the greenhouse can be considered the best one relatively to the tunnel and chapel shapes in the safety and heating points of view.
The agricultural tunnel greenhouse shown in Figure 1 is installed in the last site token on consideration for the experimental measurements, which realized by the dimensions in Table 1:
Table 1. Experimental tunnel greenhouse dimensions
|
|
Length |
Width |
Height |
|
Sizes |
25 m |
8 m |
3.5 m |
The physical materials properties as that used in our previous work [19] shown in Table 2, was chosen for a composite material cover and mediums existing when constructed a greenhouse.
Table 2. Physical properties of the materials [19]
|
Physical properties |
Air |
Polyethylene |
Sol |
|
$\rho$ (Kg/m3) |
1.225 |
930 |
1500 |
|
Cp (J/KgK) |
1006.43 |
2100 |
800 |
|
K (W/mK) |
0.0242 |
0.4 |
0.33 |
Figure 1. Solar greenhouse with polyethylene cover
Figure 2. Algerian irradiation Solar and wind potential Maps. Atlas_solaire_Algerien_CDER [20]
The experiment was carried out of tunnel greenhouse is constructed and installed in the Renewable Energy Applied Research Unit (UREAR) of Ghardaia, Algeria, it covered with low-density polyethylene, greenhouse occupies a surface area equal to 200 m2 (see Figure 1).
As can see in cartography, a site considered in this study take in consideration the climatic conditions characterized an arid area in South Algeria at Ghardaia province (Saharian region), which can be localized by the north Latitude 32.32°, the west Longitude 3.48° and the altitude of 500m that shown in Figure 2. This localization recognized by the cold weather in winter and hot temperature with high solar radiation intensity in summer, where in Figure 2 the distribution of the radiation solar and wind speed is shown a potential of the entire Algerian territory, which are very important in the region that considered. Nevertheless, the average duration of sunshine in southern Algeria is around 9 hours / day, we see that it is always greater than 8 hours/day in most of the territory.
3.1 Mathematical modelling and natural convection
The system of fluid dynamics equations can be constructed based on theoretical expressions of the materials fundamental laws and its continuation:
- A mass conservation equation (or continuity equation):
$\frac{d \rho}{\mathrm{dt}}+\rho \operatorname{div}(\vec{v})=0$ (1)
- Newton equation of fundamental dynamic law:
$\frac{\mathrm{d} \overrightarrow{\mathrm{v}}}{\mathrm{dt}}+\overrightarrow{\mathrm{v}} \cdot \overrightarrow{\operatorname{grad}}(\vec{v})=-\frac{1}{\rho} \overrightarrow{\operatorname{grad}}(\vec{p})+v \Delta \vec{v}+\vec{f}$ (2)
where:
$\overrightarrow{\mathrm{f}}=\mathrm{f}_{\mathrm{z}} \overrightarrow{\mathrm{k}}=\mathrm{g} \beta\left(\mathrm{T}-\mathrm{T}_{\mathrm{c}}\right) \overrightarrow{\mathrm{k}}$ (3)
- Thermodynamic first principle law (conservation of energy).
$\frac{\mathrm{dT}}{\mathrm{d} \mathrm{t}}+\overrightarrow{\mathrm{v}} \cdot \overrightarrow{\operatorname{grad}}(T)=\frac{k}{\rho C_{p}} \Delta T$ (4)
where, the (1), (2) and (4) equations can be expressed in Cartesian polar and spherical coordinates.
Each kinds of fluid specialized by their physical properties must adapt to these lows by convenient constituent basic formula of state, for the force tensor depending to the velocity components, heat flux versus to the temperature. The final system of equations that’s obtained is recognized as the Navier-Stokes non-linear system equations, nevertheless this name should more specially attached to the vector velocity equations. When this vector velocity to decomposed, a system of equations gives in total five scalar equations were derived. In the case of incompressible fluid, the more complex unknown in the system of equations is the pressure.
A gravity force can be appearing when a density of the fluid change by heating, where the phenomena as buoyancy-driven of the flow can be produced, on the other hand, it’s expressed by natural-convection flows, which is controlled by the dimensionless Rayleigh number given by:
$R_{a}=\frac{g \beta(\Delta T) L^{3}}{\mu \alpha}$ (5)
where, ∆T the maximum temperature difference of the airflow and L is the collector height.
In the flow fluid regimes, a laminar pattern flow can be produced for a Rayleigh numbers less than 108. When 108 < Ra < 1010, the transition to turbulence generates in this range. The problem of the pressure determined by the density of the fluid through the masse conservation balance, based on the masse conservation inside domain. Using the ideal gas law, the initial density will be computed from the initial pressure and temperature, in this approach, this mass will be properly conserved, Fluent Inc [21], so the initial mass is known, as the solution progresses over time.
3.2 Computational domain and boundary definition:
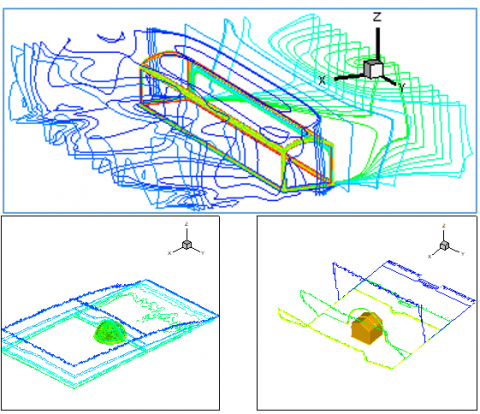
A computational domain for three case that considered in this study is shown in Figure 3, were the geometric configuration of the envelope greenhouses in tunnel, dome and chapel shapes that are enclosed in a parallelepiped domain of three-dimensional space illustrate in detail on the following schemes of the Figure 3. Nevertheless, the boundaries conditions of the last geometrical configuration note in the Table 3.
Table 3. type and expression of Boundary conditions
|
Boundary name |
Inlet |
outlet |
Wall |
Top, lateral |
|
Condition Kind |
Velocity inlet
|
Pressure Outlet |
no slip condition |
Symmetric condition |
|
Condition expression |
V=Cst |
P=Cst |
$\mathrm{u}=\mathrm{v}=\mathrm{w}=0 \mathrm{~m} / \mathrm{s}$ |
$\partial v_{i} / \partial x_{i}=C s t$ |
|
|
Dirichlet |
Dirichlet |
Dirichlet |
Neumann |
A constant value of air free velocity was imposed at the inlet part in x or y direction of the geometrical model domain, (Figure 3).
Figure 3. 3D Computational domain for tunnel dome and chapel greenhouses
The selected field of computation is a mesh grid structured on the inside and outside greenhouse areas, particularly it’s well refined near the outer surface of the greenhouse and gradually widens when moving away.
4.1 Validation by experiment results
4.1.1 Global_Direct _Diffus Radiations and wind deposit
The Solar module, Load Model of FLUENT (ANSYS) exploited for calculate the effects of radiation from the sun's rays that penetrate a field of computation. Where the solar calculator utility take part to accurate the sun location in the sky for a given time of day, in the date and position. Furthermore, modeling stable and unstable flows can be also used. Solar charge effects can be also simulated and determinate over the transmission of solar energy through the whole greenhouse surface, in each moment of the day. A characteristic Data-in intended are the date, the time, the method of solar irradiation, the mesh orientation, the sun factor and the information about position. The grid orientation is specified towards the North by positive Y axis and towards the East by the negative X axis direction vector.
Figure 4. Global-Direct-Diffuse solar radiation measurement at 11-12 Nov 2018
The validation of the solar model through the such as solar irradiation results is given in the Table 4 which is in good agreement with the radiation of the first day (11/11/2018) experiment results shown in Figure 4.
Table 4. Direct _Diffuse-reflect solar radiation
|
DNI |
Vertical-diff-rad |
Horizontal-diff-rad |
Reflect-rad |
|
577 w/m2 |
51.9 w/m2 |
56.7 w/m2 |
39.65 w/m2 |
4.1.2 Experiment temperature evolution
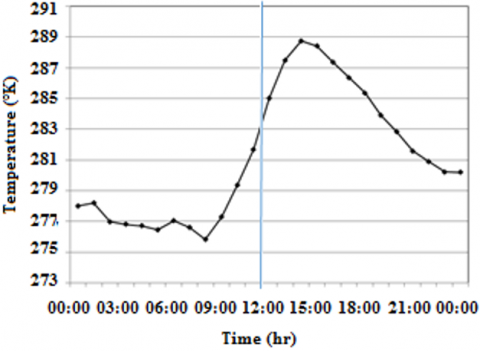
The comparison of the temperatures profile obtained numerically and experimentally shown a good agreement result. For this validation, we have measured the temperature values inside closed agricultural tunnel greenhouse without crops and not watering for three different heights level (x=0.5m, x=1m, x=2.1m) that illustrate in Figure 5. Where in the ambient temperature T=283°K measured at midday (12h) in Figure 6, we find the inside temperature at x=2.1m T=293°K, then when the height decreases the temperature increases for to achieved at x=1.5m T=295.5°K and at x=0.5m T=298°K, this difference of temperature known by the stratification problem inside greenhouse.
Figure 5. Measured indoor air temperature of the tunnel greenhouse at different heights (19/02/2017)
Figure 6. Measured outside air temperature of the greenhouse for the day of (19/02/2017)
On the other hand, the heating efficiency greenhouse system can obtain through the Figures 5, 6 experimental results showed that the difference of the inside and outside temperature can be reached ∆T=288°K.
4.2 Orientation greenhouse effects on aerodynamic property
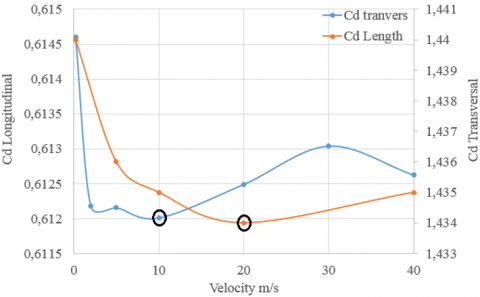
The drag concept in the context of fluid dynamics refers to the forces that act on a solid object in the direction of the relative flow velocity. The aerodynamic forces on a body come primarily from differences in pressure and viscous shearing stresses. Thereby, the drag force on a body could be divided into two components, namely frictional drag (viscous drag) and pressure drag (form drag). In this study, the net drags forces of longitudinal and transversal interaction position greenhouses with a wind motion are shown in Figure 7. Where Cd is the global drag coefficient of the friction and the pressure one.
Figure 7. Variation of the drag force coefficient (Cd) in longitudinal and transverse case tunnel greenhouse versus free air speed (V)
Other hand, for the solar raisons, we considering the longitudinal case for the greenhouse oriented from east to west, and the transversal case for that oriented from north to south.
The main aims in this work are the study of the force acting on the greenhouse trough the un-dimensional Drag coefficient Cd, which can be used as the control parameter for distinguish between the flow regimes over the building of the greenhouses. In her, the transition regime from laminar to turbulent regime can be notice at critical Reynolds number that corresponding to minimum drag coefficient according to the Reynolds number. In Figure 7, we compere this transition critical values associate respectively to the transversal and longitudinal greenhouses. We find that the transition in the first case occurred at Rec=2.7*106 corresponding to the air speed Vc=10m/s. Where, the second point noted in the second case for the critical Reynolds number Rec=5.4*106 corresponding to the velocity Vc=20m/s in the longitudinal greenhouse stat.
In their study Braza et al. [22], in the flow around circular cylinder, established the critical Reynolds number Rec=2.5*105, in this case of bluff body known as the academicals body. However, when considering this drag force can be divided into pressure drag and frictional drag, we note that the first component predominates a second one’s in the case bluff bodies, which inversed in the case of stream bodies.
The aero-dynamical Drag coefficient Cd depending to the drag force Fd by the expression with square air free speed V, that given by:
$F_{d}=\frac{1}{2} \rho C_{d} A v^{2}$ (6)
Roy and Boulard [23] have confirmed by a numerical investigation the wind direction effects on the inside climatic parameters in the greenhouse, where have highlighted the influence of the wind direction on the temperature, velocity, and humidity distributions in the greenhouse. Teitel et al. [24] observed that the wind interaction with the structure greenhouse opened on the perpendicular plane have result in vertical direction a well and perfect gradient of temperatures on air and crop, the same results have been observed for the humidity.
4.3 The effect of the building design in the drag coefficient
In the Figures 8 and 9 the evolution of the drag coefficient versus temporary evolution, show an important positive value with fluctuations for the chapel structure. On the other hand, a drag coefficient is associate to the weaken negatives values which tends to zero and without fluctuations.
The important different Aerodynamic Drag coefficient Cd values can be observed when we compare between three designs shapes of greenhouses considered in this paper as well as between different position orientations of the tunnel greenhouse.
Figure 8. Evolution of aerodynamic drag coefficient on chapel greenhouse
Figure 9. Evolution of aerodynamic drag coefficient on dome greenhouse
The very weak force acting in the structure is noted in the case of dome greenhouse (Cd≃0). Where in the chapel shape case, the mean drag coefficient value Cd equal to 0.29. So the greater drag coefficient saved value in tunnel shape greenhouse case with a mean drag coefficient value Cd=1.43 for the longitudinal orientation status and Cd=0.61 for the cross section orientation status.
4.4 The effect of the building design in the inside temperature
The temperature and humidity behaviors obtained by Teitel et al. [24] confirmed that their ratio was more important in the roof vicinity than the crop, however the air velocity was higher close the crop than nigh to the roof. The temperature gradients observed inside greenhouse in the vertical direction inversed relatively to our results which can be explained through the ventilation openings in this case. These gradients are also found in a horizontal plane on the mean flow direction that were weak than the vertical direction temperature gradients. Khaoua et al. [25] studied by numerical voice the wind speed effect and roof vent opening configuration on glasshouse airflow and temperature behaviors. Find results which confirmed the greenhouse microclimate is mainly dependent on the vents configurations and the wind speeds strongly.
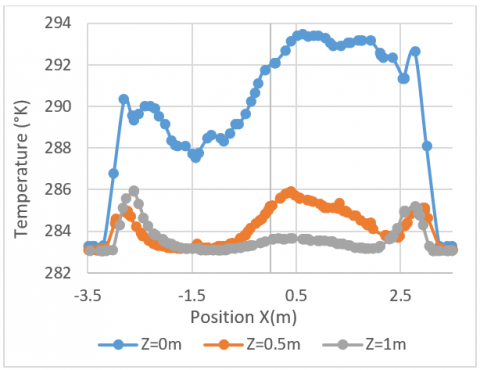
Figure 10. Profile temperature in X direction for chapel greenhouse at z=0, 0.5 and 1m height
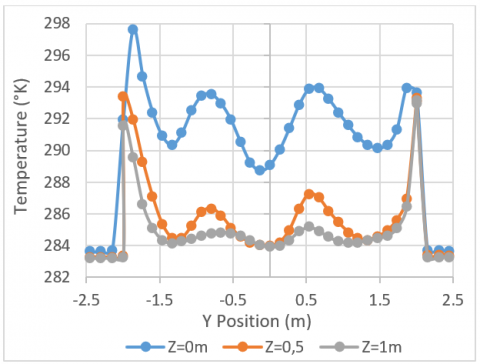
Figure 11. Profile temperature in Y direction for chapel greenhouse at z=0, 0.5 and 1m height
Figure 12. A comparison of the profiles temperature in X and Y direction for chapel greenhouse at z=0m
Figure 13. Profile temperature in X directions for dome greenhouse at z=0, 0.5 and 1m height
Figure 14. the profile temperature in Y directions for dome greenhouse at z=0, 0.5 and 1m height
Figure 15. Comparison of temperature profile in X and Y directions for dome greenhouse at z=0m
Here in a comparative study is carried out between two types of agricultural greenhouses namely geometric dome and chapel. The climatic conditions considered for a winter period or the ambient temperature T = 283°k and the wind speed V = 2m /s.
The no symmetry temperature profile was noticed in the x direction parallel to the wind motion for chapel and dome greenhouses. In Figure 10, a temperature evolution in chapel greenhouse, show that a high temperature has been registered in upstream side and the low temperature can observed in downstream side, this situation inversed in the case of the dome greenhouse in Figure 13. By comparison of temperature curves evolution in x and y direction observed respectively in Figures 11 and 14, the quasi-symmetry temperature gradient profile can be noticed in the y direction cross to the wind streamline faraway to the structure of the greenhouse. A maximum difference temperature between inside and outside can be reached 14°K and in the mean it’s over 10°K.
The Figures 10-15 shown that the inside mean temperature of the dome greenhouse structure is slightly more important than the chapel greenhouse structure. Nevertheless, in both directions of the orientations x and y, and in both forms chapel or dome greenhouses we observe that at z=0m the temperature still higher than other altitude in inside.
The more important values of the temperature can be observed on the polyethylene cover inside sides in Y direction how has not exposed to the wind. Where the Figures 12 and 15, corresponding to the temperature profiles in the sol respectively on the chapel and dome greenhouses. The jump in the temperature values which can be observed in beside external to indoor neighborhood cover it’s important noticed a different of the temperature reached 287°K for y direction and 283°K for x direction.
Sethi [26] have experimentally investigated a solar heating influences by design, compared the radiation solar transmission of the five shapes different of agricultural greenhouses in India, vinery, uneven-span, even-span, Quonset and modified arch type. He finds through the results that the maximum solar irradiation receives in the uneven-span shape greenhouse and the minimum solar irradiation receives in the Quonset shape at all latitudes on all months in the year. The greenhouse orientation East-west considered a very well situation than that north-south in the year-round greenhouse applications, where in winter they receive the lot-of solar radiations at all latitudes in the case east-west orientation and a little quantity of radiation in summer except near the equator. Whist, Chandra et al. [27] contend for northern climatic conditions in India that the results obtained by greenhouse orientation north-south in best homogeneity of the microclimate. However, Dragićević [28] investigated a comparison of uneven-span greenhouses orientated east-west and north-south concluded that, for at different latitudes at the northern hemisphere of Serbia, Belgrade, the east-west orientation of uneven-span solar greenhouse is the best suited during each month for all examined latitudes.
The effect of the wind velocity on the inside greenhouse temperature and the aerodynamics drag coefficient corresponding to the force acting on outside wall area have been highlighted, under solar radiation. Two positions of the tunnel greenhouse were considered, transversal and longitudinal orientations. In the first case, a critical Reynolds numbers values are getting in this study at Re=2.7*106 corresponding to Vc=10m/s, and Re=5.4*106 corresponding to Vc=20m/s in the second case. The last critical situation corresponding to the minimum drag coefficient and minimum gain of the temperature registered in the transition point from laminar to turbulent regime.
The drag coefficient that’s most decreases between considering cases in this work is that corresponds to the dome shape greenhouse (Cd≃0), and Cd=0.287 in the chapel shape greenhouse how has associate to the uniform stream wind velocity U∞=2m/s.
In the same period of the weak solar radiation intensity (577w/m2) registered in winter on south of Algeria (Arid area) at the external temperature Text=283°K, a comparison between temperature distribution in the different structures of chapel and dome greenhouses has been realized simultaneously to their safety from wind damage that can be occurred. Where, the results were found shown a best property aero-dynamic and energetic in the case of the dome design than the chapel one’s. Moreover, the very important inside temperature gain observed with a more safety of the building structure under wind stresses acting in the case of the dome greenhouses. However, inversely to the first case, the slightly low different temperature inside-outside relatively to dome shape associated to the important drag coefficient that have been registered in the case of the chapel greenhouses structures.
|
Cd |
Drag Coefficient |
|
$\rho$ |
Density (Kg.m-3) |
|
L |
Characteristic Length (m) |
|
$\alpha$ |
Dilatability coefficient |
|
$\mu$ |
Dynamic viscosity (Kg.m-1.s-1) |
|
$\beta$ |
Compressibility coefficient |
|
Ra |
Roughly Number |
|
Re |
Reynolds Number |
|
A |
Area (m2) |
| V | Velocity (m.s-1 ) |
|
Vc |
Critical Velocity (m.s-1 ) |
|
$\mathrm{C}_{\mathrm{p}}$ |
Specific heat (J.Kg-1.K-1) |
|
K |
Thermal conductivity (W.m-1.K-1) |
|
G |
Gravitational Acceleration, m.s-2 |
|
$\Delta \mathrm{T}$ |
Difference of temperature (°K) |
| T | Temperature (°K) |
|
Fd |
Drag force (N) |
|
T |
Time (s) |
|
F |
force (N) |
|
fz |
Vertical force (N) |
|
L |
Characteristic length (m) |
|
$\overrightarrow{\mathrm{k}}$ |
vertical unit vector |
|
DNI |
Direct Normal irradiation |
[1] Shamshiri, S., Ismail, W.I.W. (2013). A review of greenhouse climate control and automation systems in tropical regions. Journal of Agricultural Science and Applications 2(3): 175-182. https://doi.org/10.14511/jasa. 2013.020307
[2] Giacomelli, G.A. (2009). Engineering principles impacting high-tunnel environments. Hort Technology, 19(1): 30-33. https://doi.org/10.21273/HORTSCI.19.1.30
[3] Van Straten, G., van Willigenburg, G., van Henten, E., van Ooteghem, R. (2010). Optimal Control of Greenhouse Cultivation. CRC Press. https://doi.org/10.1201/b10321
[4] Emekli, N.Y., Kendirli, B., Kurunc, A. (2010). Structural analysis and functional characteristics of greenhouses in the Mediterranean region of Turkey. African Journal of Biotechnology, 9: 3131-3139. https://doi.org/10.5897/AJB2010.000-3154
[5] Ali-Nezhad, F.M., Eskandari, H. (2012). Effect of architectural design of greenhouse on solar radiation interception and crops growth conditions. International Journal of Agriculture and Crop Sciences (IJACS), 4(3): 122-127.
[6] Garg, H.P., Prakash, J. (2000). Solar Energy: Fundamentals and Applications. McGraw-Hill, New Delhi, India.
[7] Stanciu, C., Stanciu, D., Dobrovicescu, A. (2016). Effect of greenhouse orientation with respect to EW axis on its required heating and cooling loads. Energy Procedia, 85: 498-504. https://doi.org/10.1016/j.egypro.2015.12.234
[8] Iribarne, L., Torres, J.A., Peña, A. (2007). Using computer modeling technics to design tunnel greenhouse structures. Computers in Industry, 58: 403-415. https://doi.org/10.1016/j.compind.2006.09.001
[9] Critten, D.L. (1993). A review of the light transmission into greenhouse crops. Acta Horticulturae, 328: 9-31. https://doi.org/10.17660/ActaHortic.1993.328.1
[10] Kacira, M., Short, T.H., Stowell, R.R., (1998). A CFD evaluation of naturally ventilated, multi-span, sawtooth greenhouses. Transactions of the ASAE, 41(3): 833-837. https://doi.org/10.13031/2013.17222
[11] Bartzanas, T.B.T.K.C., Boulard, T., Kittas, C. (2004). Effect of vent arrangement on windward ventilation of a tunnel greenhouse. Biosystems Engineering, 88(4): 479-490. https://doi.org/10.1016/j.biosystemseng
[12] Molina Aiz, F.D., Valera, D.L., Pena, A.A., Alvarez, A.J., Gil, J.A. (2006). Analysis of the effect of rollup vent arrangement and wind speed on Almeria-type greenhouse ventilation performance using computational fluid dynamics. Acta. Hort., 719: 173-179. https://doi.org/10.17660/ActaHortic.2006.719.17
[13] He, K., Chen, D., Sun, L., Huang, Z., Liu, Z. (2015). Effects of vent configuration and span number on greenhouse microclimate under summer conditions in Eastern China. International Journal of Ventilation, 13(4): 381-396. https://doi.org/10.1080/14733315.2015.11684062
[14] Edwin. A.V.M., Carlos, R.B.A. (2019). CFD Simulation of increase of the roof ventilation area in a traditional Colombian greenhouse: Effect on air flow patterns and thermal behavior. International Journal of Heat and Technology, 37(3): 881-892. https://doi.org/10.18280/ijht.370326
[15] Haxaire, R., Boulard, T., Mermier, M. (2000). Greenhouse natural ventilation by wind forces. Acta Horticulturale, 534: 31-40. https://doi.org/10.17660/ActaHortic. 2000.534.2
[16] Critten, D.L., Bailey, B.J. (2002). A review of greenhouse engineering developments during the 1990s. Agriculturale and Forest Meteorology, 112(1): 1-22. https://doi.org/10.1016/S0168-1923(02)00057-6
[17] McCartney, L., Orsat, V., Lefsrud, M.G. (2018). An experimental study of the cooling performane and airflow patterns in a model natural ventilation augmented cooling (NVAC) greenhouse. Biosystems Engineering, 174: 173-189. https://doi.org/10.1016/j.biosystemseng.2018.07.005
[18] Espinoza. K., Lopez. A., Valera. D.L., Molina-Aiz. F.D., Torres, J.A., Pena, A. (2017). Effects of ventilator configuration on the flow pattern of a naturally-ventilated three-span Mediterranean greenhouse. Biosystems Engineering, 164: 13-30. https://doi.org/10.1016/j.biosystemseng.2017.10.001
[19] Aissa, M., Bezari, S. (2018). The orientation effect of the agricultural tunnel greenhouse on aerodynamic and energy properties. 2018 5th International Symposium on Environment-Friendly Energies and Applications (EFEA), Rome, 2018, pp. 1-4. https://doi.org/10.1109/EFEA.2018.8617097
[20] Atlas_solaire_Algerien_CDER, http://www.cder.dz, accessed on 19 March 2021.
[21] Fluent Inc. Fluent 6.3 user’s guide. (2006). https://romeo.univ-reims.fr/documents/fluent/fluent User Guide.pdf.
[22] Braza, M., Faghani, D., Persillon, H. (2017). Successive stages and role of natural vortex dislocations in the three-dimensional wake transition. J. Fluid Mech, 439: 1-43. https://doi.org/10.1017/jfm.2017.146
[23] Roy, J.C., Boulard, T. (2005). CFD prediction of the natural ventilation in a tunnel-type greenhouse: Influence of wind direction and sensibility to turbulence models. International Society for Horticultural Science (ISHS), 2005 Leuven, Belgium. https://doi.org/10.17660/ActaHortic.2005.691.55
[24] Teitel, M., Liran, O., Tanny, J., Barak, M. (2008). Wind driven ventilation of a mono-span greenhouse with a rose crop and continuous screened side vents and its effect on flow patterns and microclimate. Biosyst. Eng., 101(1): 111-122. https://doi.org/10.17660/actahortic.1978.87.3
[25] Ould Khaoua, S.A., Bournet, P.E., Migeon, C., Boulard, T., Chassériaux, G. (2006). Analysis of greenhouse ventilation efficiency based on computational fluid dynamics. Biosyst. Eng., 95(1): 83-98. https://doi.org/10.1016/j.biosystemseng.2006.05.004
[26] Sethi, V.P. (2009). On the selection of shape and orientation of a greenhouse: Thermal modeling and experimental validation Sol. Energy, 83(1): 21-38. https://doi.org/10.1016/j.solener.2008.05.018
[27] Chandra, P., Srivastava, P.C., Maheshwari, R.C. (1982). Solar greenhouse design consideration. ISAE XIX Annual Convention 1982 Udaipur.
[28] Dragićević, M.S. (2011). Determining the optimum orientation of a greenhouse on the basis of the total solar radiation availability. Thermal Science, 15(1): 215-221. https://doi.org/10.2298/TSCI100220057D