Yahui Luo | Xiwen Yang* | Pin Jiang
© 2020 IIETA. This article is published by IIETA and is licensed under the CC BY 4.0 license (http://creativecommons.org/licenses/by/4.0/).
OPEN ACCESS
Vegetable growth requires a relatively stable environment for the root zone. If the temperature in root zone environment is optimal, the aeroponic cultivation will be energy-efficient, and the aeroponic vegetables will grow well at high, normal, or low temperature. By computational fluid dynamics (CFD), this paper numerically simulates the root zone temperature of lettuce in the aeroponic cultivation box, after the box was sprayed with nutrient solutions of different temperatures. Then, the root zone environments of aeroponic lettuce were monitored through experiments at three different temperatures: high temperature, normal temperature, and low temperature. Through comparison, it was learned that the error between the simulated and measured values at each point was smaller than 1.35℃; the maximum error at a single point was within 7.4%; overall, the mean relative error was merely 5.8%. The results prove that the proposed CFD simulation model is reasonable and effective. Our research provides a theoretical reference for optimizing the root zone temperature, regulating the spray of nutrient solutions at different temperatures, and building an energy-efficient efficient aeroponic cultivation system.
aeroponic cultivation, root zone temperature, numerical simulation, computational fluid dynamics (CFD)
Vegetable growth requires a relatively stable environment for the root zone. A better root zone environment promotes the production efficiency of vegetables, whether they are cultured in soil, water, or air [1-6]. Unlike traditional cultivation modes, aeroponic cultivation adopts a closed box, in which the root system is suspended. The root zone environment is obviously easy to control, resulting in the rapid growth of vegetables [7-12].
In aeroponic cultivation, the root zone environment is regulated by many factors, including but not limited to nutrient solution concentration, spray frequency, droplet size, and root zone temperature. Yu et al. [13] studied the effects of intercropping on growth and nitrate accumulation of aeroponic lettuce. Bao et al. [14, 15] investigated how the growth and yield of aeroponic potatoes are influenced by nutrient solution concentration and spray frequency. Sharma et al. [16], Lemma et al. [17], and Zhang et al. [18] explored the impacts of nutrient solution on crop growth in aeroponic cultivation. Imran et al. [19], and Eni et al. [20] examined the effects of root cooling degree on aeroponic crops.
At present, scholars have mainly tried to improve the internal and external qualities of aeroponic vegetables by optimizing and regulating relevant parameters. However, there are few reports on how to create a stable root zone temperature for the growth of aeroponic vegetables. The temperature stabilization technique for the root zone could facilitate the adjustment of nutrient solution and reduction of energy consumption in aeroponic cultivation. Therefore, this paper attempts to optimize the temperature in root zone environment of aeroponic vegetables by regulating the temperature of nutrient solution with different gradients, in order to promote the growth state, quality, and yield of the crops.
Taking lettuce as the target vegetable, this paper carries out numerical simulation of the temperature field in the aeroponic cultivation box by computational fluid dynamics (CFD), after the box was sprayed with nutrient solutions of different temperatures. Besides, the root zone environments of aeroponic lettuce were measured through experiments at high, normal, and low temperatures. The variation and spatial distribution laws of root zone temperature were analyzed in each scenario. Based on these laws, it is possible to optimize the root zone temperature, regulate the spray of nutrient solutions at high, normal, or low temperature, and build an energy-efficient efficient aeroponic cultivation system. The research results shed theoretical and technical lights on aeroponic cultivation of vegetables in different temperature environments, such as big sheds, greenhouses, and the outdoor.
2.1 Aeroponic cultivation box
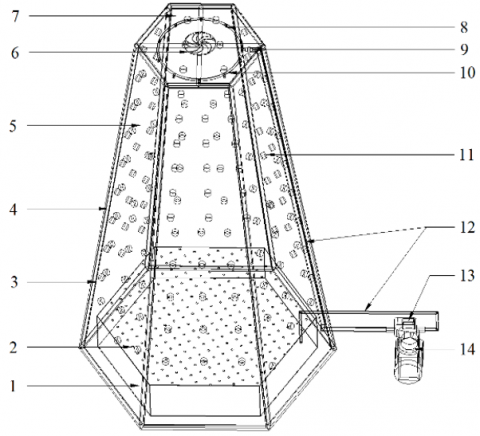
Our team independently designed an aeroponic cultivation box shaped like a truncated pyramid [18]. This structure accepts more lights and achieves better efficiency than the traditional column structure. As shown in Figure 1, every cross-section of the 1.2m-tall box is a regular hexagon. The top hexagon has a side length of 0.2m, and the bottom hexagon has a side length of 0.4m. The sides of the structure are six 2cm-thick trapezoidal plastic extruded boards. There are 12 holes (diameter: 3.5cm) on each board. Each hole is connected with a plastic fix planting basket, which contains the seedlings.
During the cultivation, the booster pump at the bottom of the box transfers the nutrient solution from the nutrient solution tank to the top of the ring spray tube; then, the nutrient solution is atomized at the high-pressure spray nozzle, which is welded on the ring spray tube, and sprayed onto the surface of vegetable root. In this way, the root system receives water, oxygen, and nutrients from the moist air.
1. Nutrient solution tank 2. Filter screen 3. Stainless steel support 4. Waterproof light-shielding film 5. Plastic extruded board 6. Exhaust fan 7. Top plate 8. High-pressure spray nozzle 9. Two-way joint 10. Ring spray tube 11. Hole 12. Infusion tube 13. Pump controller 14. Booster pump
Figure 1. The proposed aeroponic cultivation box
2.2 Other instruments
The temperature inside the box and in the root zone were both collected with waterproof PT100 temperature sensor (range: -50-200℃; measuring error: ±0.15℃; sampling period: 1s). The temperature of the nutrient solution was adjusted between 10 and 40℃ by a refrigerating machine.
Centering on an ARM development board, the external data collection system captures the temperature, humidity, and light intensity with DHT11 temperature and humidity transducer and photoresistor sensor (working voltage: 3.3-5V).
2.3 Experimental setup
The experiments were conducted in the intelligent climate room of College of Mechanical and Electrical Engineering, Hunan Agricultural University, with aeroponic lettuce as the target vegetable. From the relevant literature [19-22], the optimal temperature of the nutrient solution for the root zone of hydroponic lettuce falls between 18 and 22℃. Healthy seedings with root length of 5-7cm were selected, and transplanted to the fix planting baskets in the designed box. During the growth period, the light period and dark period were set to 16h (06:00-23:00) and 8h (23:00-07:00), respectively; the temperature was adjusted in 20±0.5℃); the humidity was regulated between 70% and 80%RH. The parameters in the growth environment were monitored by the external data collection system.
2.4 Experimental method
(1) Based on the known parameters, a three-dimensional (3D) numerical simulation model was built for the temperature field in the aeroponic cultivation box, providing reference for the temperature change of aeroponic vegetables. In addition, the structure of the early-stage device was optimized to save time for the late-stage experiments, and improve cultivation efficiency.
(2) It was already known that the optimal temperature of the nutrient solution for the root growth of lettuce falls between 18 and 22℃. With the prior knowledge, mist spray experiments were carried out in the aeroponic cultivation box, using nutrient solutions of three different temperatures: the high temperature of 30℃, the normal temperature of 22℃, and the low temperature of 10℃. Combined with the preliminary results, four groups of nutrient solutions with different ambient temperatures were arranged: 17℃ (group T1), 18℃ (group T2), 22℃ (group T3), and 23℃ (group T4). A refrigerating machine was used to control the temperature of the nutrient solution, which is stored at the bottom of the box. The nutrient solution of each group was sprayed into the box by the high-pressure spray nozzle. Then, the temperature in the box during the continuous spray was collected in real time, and analyzed to obtain the law of temperature variation.
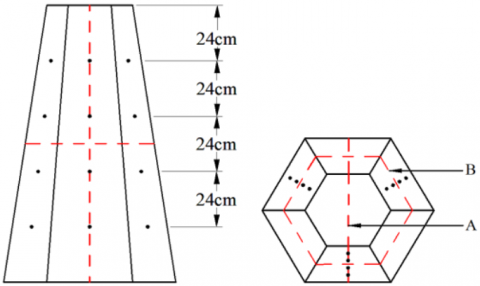
(3) The root zone temperature in the box was collected by temperature and humidity transducers via spot measurement. A total of 12 monitoring points were arranged evenly in four layers with a spacing of 0.24m (Figure 2).
Note: $\bullet$ indicates the location of each monitoring point; the red dotted lines stand for cross section A.
Figure 2. The arrangement of monitoring points
3.1 Numerical model
FLUENT15.0 was adopted to numerically simulate the temperature field inside the box. The turbulence was simulated with a standard K-epsilon equation model, the near wall region with a wall function, and the multiphase flow with the mixture model [21-24]. The fluid flow inside the box must be governed by the physical laws of conservation. Therefore, CFD was selected for the numerical simulation of the flow under the control of the basic governing equation [25, 26]:
$\frac{\partial \left( \rho \varphi \right)}{\partial t}+div\left( \rho \varphi v \right)=div\left( {{\Gamma }_{\varphi }}grad\varphi +{{S}_{\varphi }} \right)$ (1)
3.2 Compositional model
Humidity is a key factor that affects the root growth of aeroponic crop. For CFD numerical simulation, the compositional model was selected to analyze the laws of humidity distribution and temperature variation in nutrient solutions at different temperatures. The relative humidity of the moist air, which can be regarded as an incompressible ideal gas, was calculated based on the mass fraction of water vapor inside the box. Note that the mass fraction was converted into moisture content, which was then converted into relative humidity. Besides, the enthalpy of the moist air was solved by the following formulas to find the air temperature:
$\frac{\partial }{\partial t}\left( \rho E \right)+\frac{\partial }{\partial {{x}_{i}}}\left[ {{u}_{i}}\left( \rho E+\rho \right) \right]=\frac{\partial }{\partial {{x}_{i}}}\left[ {{k}_{eff}}\frac{\partial T}{\partial {{x}_{i}}}-{{\sum }_{j}}{{h}_{j}}{{J}_{j}}+{{u}_{j}}{{\left( {{\tau }_{ij}} \right)}_{eff}} \right]+{{S}_{h}}$ (2)
$E=h-\frac{p}{\rho }+\frac{u_{i}^{2}}{2}$ (3)
$h={{\sum }_{j}}{{m}_{j}}{{h}_{j}}$ (4)
${{h}_{j}}=\int\limits_{{{T}_{ref}}}^{T}{{{C}_{p,j}}}dT$ (5)
3.3 Mass-heat exchange model of the spray system
In the box, the droplets of the atomized nutrient solution absorb heat from the air, and evaporate during the falling. This process reduces the ambient temperature and increases the humidity inside the box. The energy exchange and mass exchange of the air in the spray system and the box can be respectively described by:
$S_{{\phi energy }}=Q_{\text {svp }}=\lambda\left(\beta m_{w}\right)$ (6)
$S_{\phi h_{20}}=M_{v p}=A_{S} m_{v p} \sigma \psi\left(w_{s a}-w_{a}\right)$ (7)
3.4 Definition of materials and boundary conditions
The aeroponic cultivation box was simplified into a model on a 1:1 scale. The boundary condition of the inlet was set to velocity inlet, with a velocity of 0.8m/s, and relative humidity of the inlet was set to 80%. The boundary condition of the outlet was set to pressure output, with a pressure of 0Pa. The reference pressure was set to 101,325Pa. The heat exchange on the surface of outer walls was not considered, because the surface is insulated. For simplicity, it was assumed that the atomized droplets fill the inside of the box evenly, and the volume fraction of water was 0.5. The boundary conditions and parameter settings are shown in Table 1.
3.5 Grid meshing
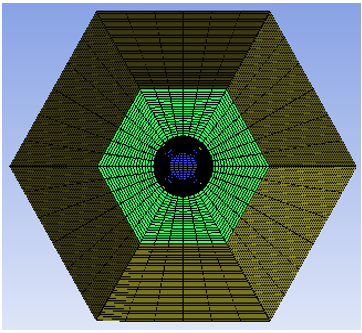
Based on the box shape, 3D solid model was established for the box using Creo. The ICEM model was adopted for grid meshing (Figure 3). The circular area at the middle inlet was meshed into O-blocks. The middle ring and inner circle areas were meshed with a relatively high density, and the grids in the height direction were of unified size. The grid files were processed, and imported to FLUENT 15.0 for post-processing. In total, 59,112 high-quality grids were generated, with the minimum Quality of 0.760992 and the maximum aspect ratio of 0.982856.
Figure 3. The grid meshing of the aeroponic cultivation box
Table 1. The boundary conditions and parameter settings
|
Name |
Parameters |
Values |
|
Air |
Density /($\mathrm{kg} \cdot m^{-3}$) |
1.225 |
|
Heat conductivity coefficient /($W \cdot m^{-1} \cdot K^{-1}$) |
2.42×10⁻² |
|
|
Thermal expansion coefficient /$K^{-1}$ |
3.356×10⁻³ |
|
|
Specific heat capacity /($J \cdot \mathrm{kg}^{-1} \cdot K^{-1}$) |
1.00643×10³ |
|
|
Dynamic viscosity /($N \cdot s \cdot m^{-2}$) |
1.83×10⁻⁵ |
|
|
XPS |
Compressive strength /(kpa) |
1.87×10² |
|
Moisture permeability coefficient /($n g \cdot m^{-1} \cdot s^{-1} \cdot P a$) |
1.3 |
|
|
Heat conductivity coefficient /($W \cdot m^{-1} \cdot K^{-1}$) |
3×10⁻² |
|
|
Dimensional stability /(%) |
0.2 |
|
|
Water absorption rate /(%) |
0.1 |
|
|
Thickness /(cm) |
2 |
|
|
Specific heat capacity /($J \cdot k g^{-1} \cdot K^{-1}$) |
1.5×10³ |
|
|
Density /($\mathrm{kg} \cdot m^{-3}$) |
2.5×101 |
|
|
Boundary parameters |
Inlet wind velocity /(m/s) |
0.8 |
|
Inlet temperature /(K) |
295.15 |
|
|
External temperature /(K) |
295.15 |
|
|
External relative humidity /(%RH) |
80% |
|
|
Spray parameters |
Nutrient solution temperature /(K) |
2.9115×10² |
|
Saturated vapor pressure /(Pa) |
3.1×10³ |
|
|
Flow /($m^{3} \cdot h^{-1}$) |
1.548×10⁻¹ |
|
|
Flow rate /($m \cdot s^{-1}$) |
4.14×10⁻¹ |
Due to the sheer size of the measured data, it would take an excessively long time to simulate each scenario in turn. Thanks to the versatility of our simulation model, numerical simulation was only carried out for the data at the ambient temperature of 22℃ and nutrient solution temperature of 18℃.
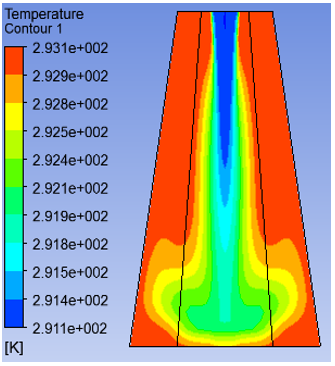
Figure 4 displays the distributions of temperature, velocity, and streamline through 60s of continuous spraying. As shown in the cloud maps of temperature distribution (subgraphs a and b), the temperature at the nozzle gradually decreased, from the start to the end of spraying. There was an obvious drop of temperature in the area below the nozzle. After entering the box, the low-temperature droplets were mixed with the surrounding high-temperature gas as they moved inward, resulting in a gradual decline of internal temperature and a relatively small cooling area. At this time, the temperature above and around the box did not change. The reason is that the droplets have not reached these areas in the short spraying time, without inducing any heat exchange. The internal temperature averaged 19.78℃.
As shown in the cloud maps of velocity and streamline distributions (subgraphs c, d, and e), the area affected by inlet velocity gradually widened over time, owing to the large space within the box. It takes a long while for inlet velocity to reach the bottom and surrounding areas. That is why the affected area tended to expand from top to bottom.
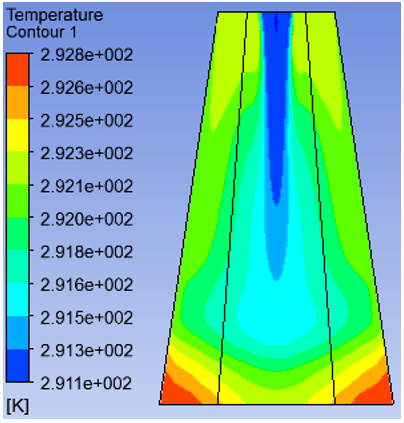
(a) Cloud map of temperature distribution in section A
(b) Cloud map of temperature distribution in section B
(c) Cloud map of velocity distribution in section A
(d) Cloud map of velocity distribution in section B
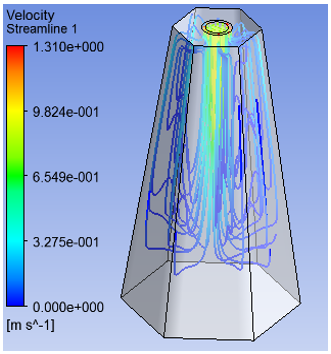
(e) Cloud map of streamline distribution
Figure 4. The distributions of temperature, velocity, and streamline through 60s of continuous spraying
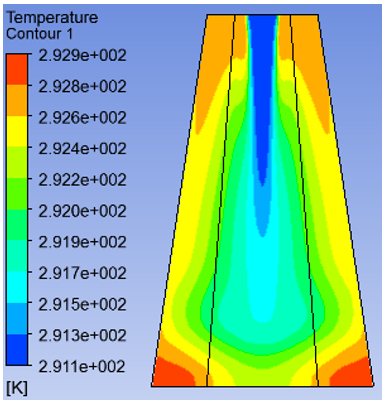
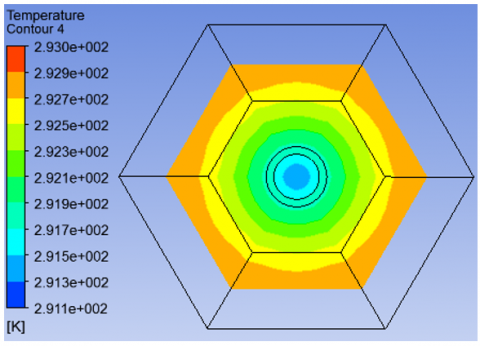
Figure 5 displays the distributions of temperature, velocity, and streamline through 180s of continuous spraying. As shown in the cloud maps of temperature distribution (subgraphs a and b), the temperature at and below the nozzle remained stable through the 180s. In the process of moving downward and around, the low-temperature droplets entering the box were mixed more uniformly with the surrounding high-temperature gas, which speeds up the cooling rate and widens the low-temperature area from the level of the 60s-long spraying. Despite the gradual decline in the temperature above and around the box, the temperature at the corners of the bottom remained unchanged. The internal temperature averaged 19.34℃.
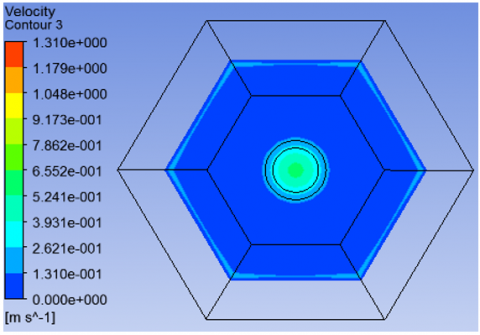
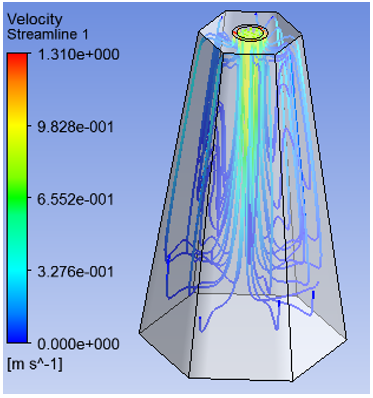
As shown in the cloud maps of velocity and streamline distributions (subgraphs c, d, and e), the temperature was high in the lower corner of the box, while that in the upper area was low. The reason lies in the limited heat exchange between the dead corner of the spraying below the box and the mainstream. With the elapse of time, the influence range of inlet velocity tended to be stable, and the velocity field gradually stabilized.
(a) Cloud map of temperature distribution in section A
(b) Cloud map of temperature distribution in section B
(c) Cloud map of velocity distribution in section A
(d) Cloud map of velocity distribution in section B
(e) Cloud map of streamline distribution
Figure 5. The distributions of temperature, velocity, and streamline through 180s of continuous spraying
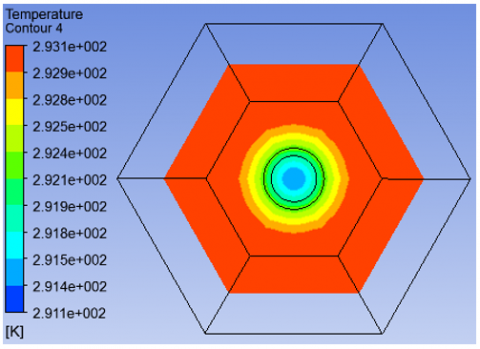
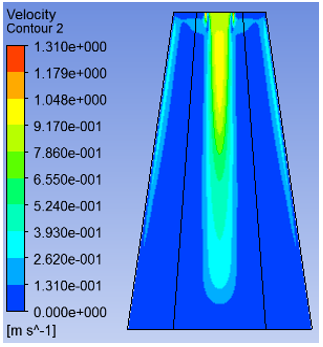
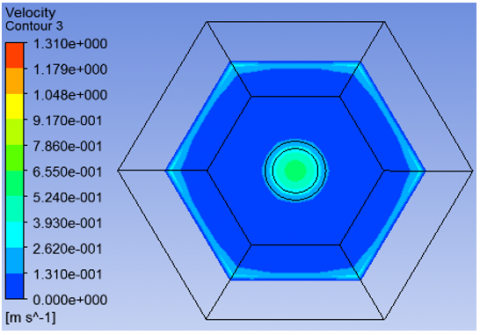
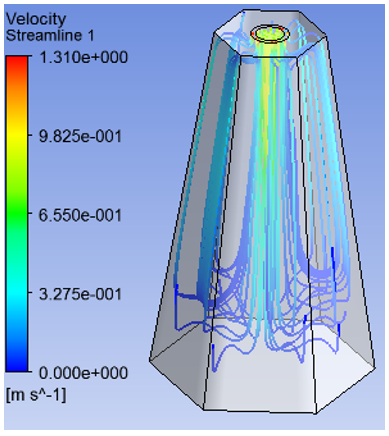
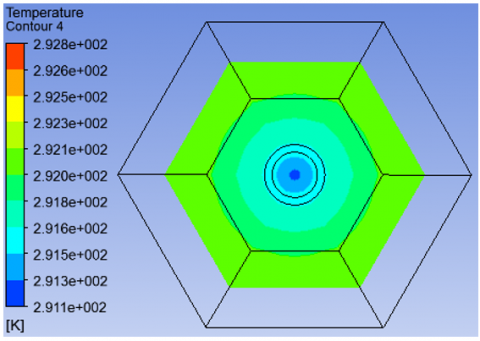
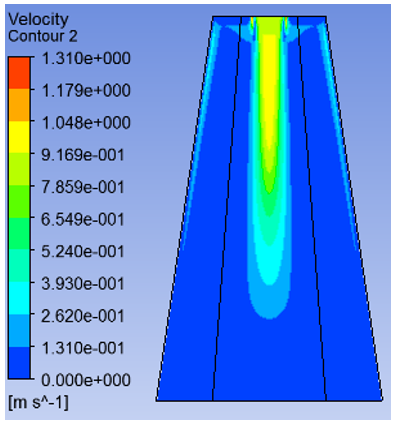
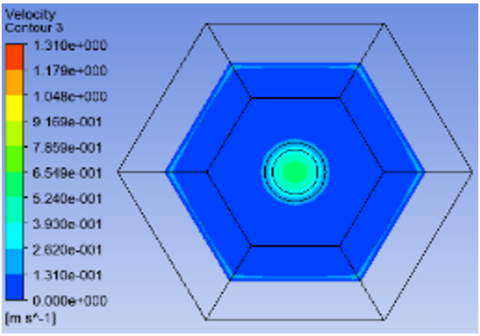
Figure 6 displays the distributions of temperature, velocity, and streamline through 300s of continuous spraying. As shown in the cloud maps of temperature distribution (subgraphs a and b), the low-temperature droplets entering the box were fully mixed with the surrounding high-temperature gas, as they moved downward and around. The decline in temperature gradually slowed down. The temperature above and around the box tended to be stable with a small fluctuation. At this time, the humidity in the box reached the peak and remained stable. However, the temperature at the corners of the box bottom did not change, indicating that the droplets could not reach these places, i.e., there existed a dead angle of spraying. The internal temperature averaged 18.84℃. Therefore, it is not recommended to plant the lettuce near the bottom of the box.
(a) Cloud map of temperature distribution in section A
(b) Cloud map of temperature distribution in section B
(c) Cloud map of velocity distribution in section A
(d) Cloud map of velocity distribution in section B
(e) Cloud map of streamline distribution
Figure 6. The distributions of temperature, velocity, and streamline through 300s of continuous spraying
As shown in the cloud maps of velocity and streamline distributions (subgraphs c, d, and e), the velocity field did not change, a sign of the stable flow in the box. This is because the heat exchange between the dead corner of spraying in the lower part of the box and the mainstream area, which pushes up the temperature in the upper area of the box. After reaching the bottom, the droplets entering the inlet flowed upward, exhibiting a steady state. This means the droplets have a cooling effect on the incoming air.
5.1 Results analysis
In the high-temperature group, the external temperature of the box was set to 30℃. For comparison, the most suitable temperature range of lettuce root zone was set to 18-22℃. Then, spray experiments were conducted on nutrient solutions with different temperatures. When the inside of the box was continuously sprayed with 18℃ nutrient solution, the temperature stabilized within 18-22℃. Meanwhile, the stabilization temperatures of other groups did not belong to this range.
According to the measured data (Table 2), when the external temperature was 30℃ and the nutrient solution was 18℃, the temperature in the box gradually decreased until the spraying reached a relatively stable state at 300s. The temperature monitored at each point fluctuated slightly from 18.99℃ to 20.42℃, averaging at 20.01℃. Once the temperature in the box became stable, the spraying was terminated, and the temperature gradually rose, until the mean temperature of all points surpassed the optimal temperature of 22℃. At this time, the spray had stopped for 124s, suggesting that the best stop interval is within 124s.
In short, when the lettuce grows at the high temperature of 30℃, the continuous spraying of nutrient solution at 18℃ ensures that the root zone grows in the optimal temperature of 18-22℃. The spraying effectively reduces the impact of high temperature on root growth of aeroponic lettuce. The maximum stop interval of spraying is 124s.
In the normal-temperature group, the external temperature of the box was set to 22℃. For comparison, the most suitable temperature range of lettuce root zone was still set to 18-22℃. Then, spray experiments were conducted on nutrient solutions with different temperatures. When the inside of the box was continuously sprayed with 18℃ nutrient solution, the temperature stabilized within 18-22℃. But the maximum stop interval of spaying was only achieved with 18℃ nutrient solution.
According to the measured data (Table 3), when the external temperature was 22℃ and the nutrient solution was 18℃, the temperature in the box gradually decreased until the spraying reached a relatively stable state at 300s. The temperature monitored at each point fluctuated slightly from 18.11℃ to 18.50℃, averaging at 18.29℃. Once the temperature in the box became stable, the spraying was terminated, and the temperature gradually rose, until the stable state was reached; the temperature monitored at each point slightly oscillated in 19.89-20.62℃, with an average of 20.17℃. Regardless of continuous spraying or intermittent spraying, the temperature was moderate in the box, falling within the optimal range.
In short, when the lettuce grows at the normal temperature of 22℃, the continuous spraying of nutrient solution at 18℃ ensures that the root zone grows in the optimal temperature of 18-22℃. There is no fixed limit for the continuous spraying time or the stop time. The energy efficiency can be improved by adjusting the spraying time as per the actual condition.
In the low-temperature group, the external temperature of the box was set to 10℃. For comparison, the most suitable temperature range of lettuce root zone was still set to 18-22℃, too. Then, spray experiments were conducted on nutrient solutions with different temperatures. When the inside of the box was continuously sprayed with 22℃ nutrient solution, the temperature stabilized within 18-22℃, and the maximum stop interval was realized.
According to the measured data (Table 4), when the external temperature was 10℃ and the nutrient solution was 18℃, the temperature in the box gradually decreased until the spraying reached a relatively stable state at 300s. The temperature monitored at each point fluctuated slightly from 20.01℃ to 21.89℃, averaging at 20.54℃. Once the temperature in the box became stable, the spraying was terminated, and the temperature gradually declined, until the mean temperature of all points fell below the optimal temperature of 18°C. At this time, the spraying had stopped for 144s, suggesting that the best stop interval is within 144s.
Table 2. The experimental data of high temperature and 18℃ nutrient solution
|
Start and stop times of spraying/s |
Temperature at each point /℃ |
|||||||||||
|
1 |
2 |
3 |
4 |
5 |
6 |
7 |
8 |
9 |
10 |
11 |
12 |
|
|
60 (start) |
20.6 |
21.07 |
21.97 |
21.07 |
20.49 |
20.67 |
21.71 |
20.71 |
20.46 |
21.39 |
19.36 |
19.03 |
|
120 |
20.16 |
20.35 |
20.82 |
20.35 |
20.36 |
20.27 |
20.67 |
19.96 |
20.21 |
20.49 |
18.99 |
18.92 |
|
240 |
20.07 |
20.25 |
20.32 |
20.32 |
20.28 |
20.21 |
20.39 |
19.99 |
20.17 |
20.35 |
19.06 |
18.92 |
|
300 (stop) |
20.03 |
20.17 |
20.24 |
20.32 |
20.21 |
20.25 |
20.42 |
20.03 |
20.14 |
20.27 |
18.99 |
18.99 |
|
358 |
20.71 |
20.86 |
20.93 |
20.68 |
21.28 |
21.36 |
21.29 |
20.89 |
21.68 |
22 |
20.93 |
21.14 |
|
424 |
21.6 |
21.68 |
21.97 |
21.36 |
22.15 |
22.08 |
22.04 |
21.65 |
22.4 |
22.85 |
21.96 |
22.21 |
Table 3. The experimental data of normal temperature and 18℃ nutrient solution
|
Start and stop times of spraying/s |
Temperature at each point /℃ |
|||||||||||
|
1 |
2 |
3 |
4 |
5 |
6 |
7 |
8 |
9 |
10 |
11 |
12 |
|
|
60 (start) |
19.15 |
19.4 |
19.08 |
19.26 |
18.79 |
18.97 |
19.12 |
19.04 |
18.76 |
18.82 |
18.25 |
18.25 |
|
120 |
18.28 |
18.53 |
18.43 |
18.32 |
18.46 |
18.42 |
18.46 |
18.50 |
18.29 |
18.36 |
18.11 |
18.11 |
|
180 |
18.30 |
18.46 |
18.50 |
18.54 |
18.25 |
18.39 |
18.32 |
18.28 |
18.21 |
18.32 |
18.14 |
18.11 |
|
240 |
18.25 |
18.43 |
18.50 |
18.32 |
18.46 |
18.50 |
18.46 |
18.50 |
18.22 |
18.33 |
18.14 |
18.07 |
|
300 (stop) |
18.28 |
18.50 |
18.43 |
18.43 |
18.25 |
18.40 |
18.32 |
18.33 |
18.14 |
18.22 |
18.11 |
18.11 |
|
480 |
18.85 |
18.78 |
18.92 |
19.07 |
18.81 |
18.81 |
19.21 |
18.56 |
18.7 |
19.17 |
18.74 |
18.38 |
|
900 |
19.39 |
19.31 |
19.42 |
19.57 |
19.60 |
19.60 |
19.82 |
19.42 |
19.60 |
19.88 |
19.60 |
19.38 |
|
1500 |
19.98 |
19.89 |
20.07 |
20.03 |
20.17 |
20.14 |
20.42 |
19.96 |
20.38 |
20.62 |
20.26 |
20.13 |
Table 4. The experimental data of low temperature and 22℃ nutrient solution
|
Start and stop times of spraying/s |
Temperature at each point /℃ |
|||||||||||
|
1 |
2 |
3 |
4 |
5 |
6 |
7 |
8 |
9 |
10 |
11 |
12 |
|
|
30 (start) |
13.43 |
13.4 |
14.33 |
14.08 |
15.44 |
14.97 |
13.76 |
16.1 |
14.8 |
13.89 |
19.28 |
16.86 |
|
60 |
17.69 |
17.19 |
18.16 |
17.7 |
18.88 |
18.91 |
17.73 |
18.56 |
18.3 |
18.1 |
21.23 |
20.83 |
|
120 |
20.28 |
19.63 |
20.24 |
20.1 |
20.28 |
20.53 |
19.81 |
20.28 |
19.92 |
20.07 |
21.89 |
21.46 |
|
240 |
20.42 |
20.03 |
20.4 |
20.33 |
20.46 |
20.64 |
20.02 |
20.43 |
19.95 |
20.28 |
21.89 |
21.42 |
|
300 (stop) |
20.43 |
20.07 |
20.41 |
20.4 |
20.39 |
20.62 |
20.11 |
20.45 |
20.01 |
20.29 |
21.89 |
21.41 |
|
360 |
19.09 |
18.38 |
18.88 |
19.02 |
19.78 |
20.24 |
20.07 |
20.17 |
19.28 |
19.14 |
20.53 |
20.71 |
|
373 |
18.66 |
17.91 |
18.52 |
18.74 |
19.53 |
20.03 |
19.81 |
19.88 |
19.13 |
19.03 |
20.39 |
20.6 |
|
444 |
16.8 |
16.15 |
16.65 |
16.83 |
18.16 |
18.7 |
18.41 |
18.55 |
18.38 |
18.1 |
19.39 |
19.89 |
Figure 7. The comparison between measured and simulated temperatures at each point
In short, when the lettuce grows at the low temperature of 10℃, the continuous spraying of nutrient solution at 18℃ ensures that the root zone grows in the optimal temperature of 18-22℃. The spraying effectively reduces the impact of low temperature on root growth of aeroponic lettuce. The maximum stop interval of spraying is 144s.
According to the above experimental results, whether the aeroponic cultivation box faced high or low temperature, the root zone temperature could be controlled in a suitable range, by adjusting the nutrient solution temperature and the stop interval of spraying. These adjustments help to mitigate the negative impact of unsuitable temperature on aeroponic cultivation, and promote the growth of aeroponic crop.
5.2 Model verification
To verify the rationality of the established CFD model, a comparative analysis was conducted between measured and simulated temperatures at each monitoring point. The same verification method was applied for each scenario. Therefore, only one scenario was taken as an example: the external temperature of the box of 22℃ and the nutrient solution temperature of 18℃. The comparison results (Figure 7) show that the error between measured and simulated temperatures at every point was smaller than 1.35℃, the maximum error of a single point was within 7.4%, and the mean relative error of all points was 5.8%. The small errors indicate that the proposed CFD model was reasonable and effectively, and applicable to adjusting root zone temperature in aeroponic cultivation.
Taking a truncated pyramid-shaped aeroponic cultivation box for example, this paper combines CFD numerical simulation with experiments to investigate the root zone temperature inside the box, and established and solved a 3D model for root zone temperature field. Under three cultivation conditions (high temperature, normal temperature, and low temperature), the authors discussed how to adjust the root zone temperature in the box by adjusting the nutrient solution temperature and stop interval of spraying, such that the root growth temperature of the aeroponic crop reaches the most suitable range. The adjustment is more energy-efficient than regulating the temperature in the whole space of the aeroponic environment.
Model verification suggests that the error between measured and simulated temperatures at every point was smaller than 1.35℃, the maximum error of a single point was within 7.4%, and the mean relative error of all points was 5.8%. The small errors indicate that the proposed CFD model was reasonable and effectively. Our research provides a guidance for the aeroponic cultivation of vegetables in different temperature environments, namely, shed, greenhouse, and extreme environments (e.g., cold regions, and hot islands and reefs), and shed theoretical lights on the optimization of root zone temperature of vegetables, temperature adjustment of nutrient solution, and energy-efficient cultivation.
This research was supported by Hunan Key Research and Development Program (Grant No.: 2018NK2063), Hunan Education Department Project (Grant No.: 20C0940).
[1] Thakura, K., Partapa, M., Kumarc, D., Warghat, A.R. (2019). Enhancement of picrosides content in Picrorhiza kurroa Royle ex Benth. mediated through nutrient feeding approach under aeroponic and hydroponic system. Industrial Crops & Products, 133: 160-167. https://doi.org/10.1016/j.indcrop.2019.03.021
[2] Hwang, Y.H., An, C.G., Chang, Y.H., Yoon, H.S., An, J.U., Shon, J.M., Rho, C.W., Jeong, B.R. (2012). Effect of zero drainage using drainage zero sensor on root zone environment, growth and yield in tomato rockwool culture. Protected Horticulture and Plant Factory, 21(4): 398-403. https://doi.org/10.12791/KSBEC.2012.21.4.398
[3] Nam, D.S., Moon, T., Lee, J.W., Son, J.E. (2019). Estimating transpiration rates of hydroponically-grown paprika via an artificial neural network using aerial and root-zone environments and growth factors in greenhouses. Horticulture, Environment and Biotechnology, 60(6): 912-923. https://doi.org/10.1007/s13580-019-00183-z
[4] Lam, V.P., Kim, S.J., Bok, G.J., Lee, J.W., Park, J.S. (2020). The effects of root temperature on growth, physiology, and accumulation of bioactive compounds of agastache rugosa. Agriculture, 10(5): 162. https://doi.org/10.3390/agriculture10050162
[5] Sun, L.L., Du, Y.P., Duan, Q.Y., Zhai, H. (2017). Root temperature regulated frost damage in leaves of the grapevine Vitis vinifera L. Australian Journal of Grape and Wine Research, 24(2): 181-189. https://doi.org/10.1111/ajgw.12328
[6] Tiwari, J.K., Devi, S., Buckseth, T., Ali, N., Singh, R.K., Zinta, R., Dua, V.K., Chakrabarti, S.K. (2020). Precision phenotyping of contrasting potato (Solanum tuberosum L.) varieties in a novel aeroponics system for improving nitrogen use efficiency: In search of key traits and genes. Journal of Integrative Agriculture, 19(1): 167-174. https://doi.org/10.1016/s2095-3119(19)62625-0
[7] Farran, I., Mingo-Castel, A.M. (2006). Potato minituber production using aeroponics: Effect of plant density and harvesting intervals. American Journal of Potato Research, 83(1): 47-53. https://doi.org/10.1007/BF02869609
[8] Tokunaga, H., Anh, N.H., Dong, N.V., Ham, L.H., Hanh, N.T., Hung, N., Ishitani, M., Tuan, L.N., Utsumi, Y., Vu, N.A., Seki, M. (2019). An efficient method of propagating cassava plants using aeroponic culture. Journal of Crop Improvement, 34(2): 1-20. https://doi.org/10.1080/15427528.2019.1673271
[9] Eldridge, B.M., Manzoni, L.R., Graham, C.A., Rodgers, B., Farmer, J.R., Dodd, A.N. (2020). Getting to the roots of aeroponic indoor farming. New Phytologist, 228(4): 1183-1192. https://doi.org/10.1111/nph.16780
[10] Mangaiyarkarasi, R. (2020). A review on production of horticulture crops in aeroponics system. Madras Agricultural Journal, 107(1-3). https://doi.org/10.29321/MAJ.2020.000341
[11] Jamhari, C.A., Wibowo, W.K., Annisa, A.R., Roffi, T.M. (2020). Design and implementation of IoT system for aeroponic chamber temperature monitoring. In 2020 Third International Conference on Vocational Education and Electrical Engineering (ICVEE), pp. 1-4. https://doi.org/10.1109/ICVEE50212.2020.9243213
[12] Lakhiar, I.A., Gao, J., Syed, T.N., Chandio, F.A., Buttar, N.A. (2018). Modern plant cultivation technologies in agriculture under controlled environment: A review on aeroponics. Journal of Plant Interactions, 13(1): 338-352. https://doi.org/10.1080/17429145.2018.1472308
[13] Yu, H.Y., Wang, L.L., Zhang, L., Liu, S., Zhang, Y.Q. (2017). Effects of intercropping on growth and nitrate accumulation of lettuce in aeroponics. Transactions of the Chinese Society of Agricultural Engineering, 33(24): 228-234. https://doi.org/10.11975/j.issn.1002-6819.2017.24.030.
[14] Bao, L., Wang, Z.L., Jin, W.L., He, W.S. (2019). Effects of different nutrition solution concentration and spray frequency on growth and yield of aeroponic potatoes. Soil and Fertilizer Sciences in China, (4): 148-155. https://doi.org/10.11838/sfsc.1673-6257.18346
[15] Bao, L., Wei, Z.Q., Wang, Z.L., Jin, W.L., He, W.S. (2019). Effects of different nutrient solution concentrations and spraying frequency on the early growth of aeroponic potatoes. Molecular Plant Breeding, 17(9): 3030-3039. https://doi.org/10.13271/j.mpb.017.003030
[16] Sharma, U., Kataria, V., Shekhawat, N.S. (2018). Aeroponics for adventitious rhizogenesis in evergreen haloxeric tree Tamarix aphylla (L.) Karst.: Influence of exogenous auxins and cutting type. Physiology and Molecular Biology of Plants, 24(1): 167-174. https://doi.org/10.1007/s12298-017-0493-0
[17] Lemma, T., Abebe, C., Gebremedhin, W., Atsede, S., Egata, S., Ebrahim, S. (2017). Determination of nutrient solutions for potato (Solanum tuberosum L.) seed production under aeroponics production system. Open Agriculture, (2): 155-159. https://doi.org/10.1515/opag-2017-0015
[18] Zhang, M.Y., Sun, H., Song, S. (2019). Effects of different nutrient solutions on growth and development of lettuce grown in aeroponics. Journal of Anhui Agricultural Sciences, 47(12): 48-50. https://doi.org/10.3969/j.issn.0517-6611.2019.12.014
[19] Sumarni, E., Farid, N., Sugiarto, A.N., Sudarmadji, A. (2016). G0 Seed potential of the aeroponics potatoes seed in the lowlands with a root zone cooling into g1 in the highlands. Rona Teknik Pertanian, 9(1): 1-10. https://doi.org/10.17969/rtp.v9i1.4380
[20] Oraby, H., Lachance, A., Desjardins, Y. (2015). A low nutrient solution temperature and the application of stress treatments increase potato mini-tubers production in an aeroponic system. American Journal of Potato Research, 92(3): 387-397. https://doi.org/10.1007/s12230-015-9444-x
[21] Limtrakarn, W., Boonmongkol, P., Chompupoung, A., Rungprateepthaworn, K., Kruenate, J., Dechaumphai, P. (2012). Computational fluid dynamics modeling to improve natural flow rate and sweet pepper productivity in greenhouse. Advances in Mechanical Engineering, (6): 1-7. https://doi.org/10.1007/10.1155/2012/158563
[22] Kichah, A., Bournet, P.E., Migeon, C., Boulard, T. (2012). Measurement and CFD simulation of microclimate characteristics and transpiration of an Impatiens pot plant crop in a greenhouse. Biosystems Engineering, 112(1): 22-34. https://doi.org/10.1016/j.biosystemseng.2012.01.012
[23] Lee, I.B., Short, T.H. (2001). Verification of computational fluid dynamic temperature simulations in a full-scale naturally ventilated greenhouse. Transactions of the ASAE, 44(1): 119-127. https://doi.org/10.13031/2013.2303
[24] Okushima, L., Sase, S., Nara, M. (1989). A support system for natural ventilation design of greenhouses based on Computational aerodynamics. Acta Horticulturae, 248: 129-136. https://doi.org/10.17660/actahortic.1989.248.13
[25] Hamidipour, M., Chen, J., Larachi, F. (2012). CFD study on hydrodynamics in three-phase fluidized beds—Application of turbulence models and experimental validation. Chemical Engineering Science, 78: 167-180. https://doi.org/10.1016/j.ces.2012.05.016
[26] Laborde-Boutet, C., Larachi, F., Dromard, N., Delsart, O., Schweich, D. (2009). CFD simulation of bubble column flows: Investigations on turbulence models in RANS approach. Chemical Engineering Science, 64(21): 4399-4413. https://doi.org/10.1016/j.ces.2009.07.009