Suat Ozturk
© 2020 IIETA. This article is published by IIETA and is licensed under the CC BY 4.0 license (http://creativecommons.org/licenses/by/4.0/).
OPEN ACCESS
The adiabatic, turbulent, and partially premixed combustions of several shale gases and air in a co-axial type combustor are computationally examined under the effects of different equivalence ratios, inlet temperatures, flow rates, humidity ratios, pressure, oxid inlet temperatures and flow rates, and swirl velocities in this study. Shale gases are extracted from Barnette, New Albany, Fayetteville, and Haynesville areas of USA. ANSYS software is used for numerical calculations of combustion. Results show that the maximum NO emissions for Barnette, New Albany, Fayetteville, and Haynesville shale gas occur at the equivalence ratio of 1.42, 1.41, 1.4, and 1.39. The rising fuel inlet temperature increase NO and reduces CO emissions after 300 K. The increasing humidity ratio causes NO and CO mass fractions to decrease. The ascending pressure raises NO up to 4 bar and lowers CO emissions. The increasing oxid flow rate abates the mass fractions of both NO and CO. The rising swirl velocity escalates NO up to 15 m/s and decreases CO emissions for all the shale gas combustions.
adiabatic, combustion, emissions, partially premixed, turbulent, shale gas
Growing population, developing technologies and countries, competition among countries, and high standard expectation in life progressively increase energy demand every year. Natural gas has lately begun to become prominent in the main energy sources because there are newly discovered gas fields in the Mediterranean and South China Sea and gas combustion units used in energy production, heating, and transportation emits less greenhouse gas according to petrol and coal [1]. Besides, natural gas is also able to be obtained from shale gas extracted from shale rocks by horizontal drilling and hydraulic fracturing techniques in the last years.
Shale gas composed mainly by methane, ethane, propane, carbon dioxide, nitrogen, hydrogen sulfide, and water are on the way of being one of important energy sources in the future. USA is the primary supplier and producer of shale gas nowadays and shale gas production to reach a 50% share in the total gas production of USA by 2035 is estimated. China, India, South Africa, and some Europe countries also have shale gas reservoirs and endeavor to extract for marketing it commercially [2, 3].
Environmental issues related to shale gas emerge during its extraction and combustion processes in energy production systems. Extraction process can cause greenhouse gas emission by fleeing methane, water pollution during hydraulic fracturing, and earthquake jeopardy [3, 4]. Combustion process can produce nitrogen oxides (NOx), carbon monoxide (CO), hydrocarbons (HC), volatile organic compounds (VOCs), ozone (O3), etc. because of high temperature, incomplete combustion, and fuel ingredient [5]. NOx (mostly NO and NO2) is responsible for respiratory system diseases, acid rains and smog formation. CO as a toxic gas is a reason for poisoning. HC causes the irritation at throat, nose, and eyes. VOCs and O3 induce illness in respiratory tract [6-10].
NOx can arise as thermal, prompt, and fuel NOx during the combustion. Thermal NOx produces from air-nitrogen oxidization in a combustor by the thermal mechanism of Zeldovich at high temperature (above 1300oC). Prompt NOx swiftly emerges in the case that the oxidizing rate of nitrogen formed in thermal mechanism is exceeded by the formation rate of nitrogen oxides. Fuel NOx forms from nitrogen in the fuel being subject to temperature, stoichiometry, the onset concentration of nitrogen in fuel/air mixture, etc. CO ensues from the combination of carbon and oxygen at the incomplete combustion.
Fuel and air can be burned as premixed, partially premixed, and non-premixed. In the partially premixed combustion, oxidizer (air or oxygen) with premixed fuel-air at any equivalence ratio are partially mixed during the combustion process in the chamber by entering to the combustor from separated inlets [11]. It is also a promising combustion process of lean fuel-air mixture that is thought to be used for engines and other power units because of its high power, low emissions, and efficient fuel consumption.
It is seen that there is a gap for the combustion case of shale gas because researchers are mainly interested in the emissions and environmental effects of the extracting process of gas from shale rocks in literature. Vargas et al. determined that shale gas 3 (58% CH4-20% C2H6-12% C3H8-10% CO2) have higher laminar burning velocity according to shale gas 1 (86% CH4, 14% C2H6) and 2 (81% CH4, 10% C2H6, 9% N2) extracted in Etiope and the adiabatic flame temperatures for all are around 2210 K at ER=1 [3]. Ozturk detected that increasing humidity ratio reduces NOx, rising inlet pressure raise NOx, and ascending flow rate decreases NOx for non-premixed shale gas combustion [5]. Cohen and Winkler concluded electricity production from shale gas emits lower greenhouse gas than that of coal [12]. Chang et al. deduced shale gas use for power generation has lower emissions and water consumption according to coal fired power plants [13]. Andreini et al. compared different models for partially premixed gas (CH4) turbine and determined NOx emissions by numerical analysis [14]. Jaggu et al. found NOx to rise from 33 to 72 ppm for equivalence ratio between 0.75 and 1.1 in a natural gas fired partially premixed type burner with CFD simulation of ANSYS Fluent [15]. Xue and Aggarwal concluded that NO formation in the non-premixed zone is higher according to the rich premixed zone for n-heptane-air partially premixed combustion [16]. Li et al. studied the dilution effects of CO2 and H2O for partially premixed swirling syngas flames and determined that CO2 reduced flame temperature and H2O has a lower effect on flame temperature [17]. Naha and Aggarwal reported the effects of fuel on NOx emissions in the partially premixed combustion of methane and n-heptane [18]. Tian et al. introduced the oxygen diluted partially premixed CH4-air combustion to get lower emissions of NOx and CO as promising and feasible [19]. Liu et al. investigated premixed and partially premixed flame structure under various pressures of H2-CO-air syngas and indicated that CO attenuated the flame at low pressure in comparison with high pressure [20]. Gebhardt concluded that Polish shale gases from Lubocino (76.7% CH4, 14.1% C2H6, 6.6% C3H8, 0.1% CO2, 2.4% N2) and Syczyn (86.4% CH4, 5.9% C2H6, 3.4% C3H8, 0.1% CO2, 3.6% N2) show the potential for appliances category 2E by modification including higher hydrocarbons separating [21].
In this study, NO and CO emissions of turbulent, partially premixed and adiabatic combustion of shale gas in a co-axial cylindrical combustor are numerically investigated under the effects of several inlet pressure, temperature, flow rates, humidity ratio, equivalence ratio, and swirl velocities by ANSYS software.
Combustion case is an intersection topic of fluid mechanics, heat and mass transfer, thermo-dynamics, chemical kinetics, radiation, buoyancy, etc. It can be investigated in numerical and experimental way. It is quite difficult to observe reactions and flame of a combustion process experimentally because of high reaction temperature, fast reactions, and narrow reaction zone. On the other hand, numerical methods are cheaper, easier to be used and less time requiring way [5].
The products, flame structure, temperatures, and mass fractions in the burner during the combustion can be numerically calculated by computational fluid dynamics (CFD). Fluid Flow (Fluent) from Analysis Systems of ANSYS Workbench used in this study is the computational fluid dynamics software utilizing finite volume method and can solve the problems of heat and mass transfer, fluid mechanics, reactions, combustion phenomenon, etc. [22, 23]
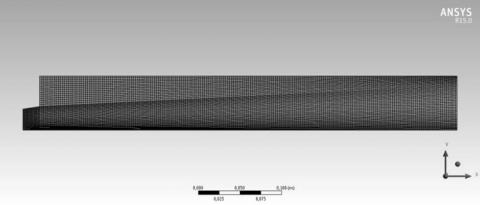
Fluent analysis and solves the equations of problem defined by mathematical models as turbulent, adiabatic, non-premixed, etc. under assigned boundary conditions, solution methods and controls on the meshed geometry of a system. A 2D model of co-axial type combustor is created to simplify and accelerate the solution of partially premixed combustion. The mesh of 2D combustion field of the co-axial combustor involves 12076 nodes and 11800 elements. The top and down edges at the inlet, the edge of partially premixed gas/air inlet, the edge of air inlet, and the edges of top and down include 20, 20, 15, and 200 numbers of divisions, respectively. Mapped face meshing with quadrilaterals method is used in the mesh of model. The meshed combustion field is illustrated in Figure 1.
Figure 1. The meshed combustion field of co-axial combustor
The following models and properties are chosen from Setup of Fluent: Viscous Model – k-epsilon (2 eqn), k-epsilon model – standard, Near-Wall Treatment – Standart Wall Functions, Species Model – Partially Premixed Combustion (Premixed Model – C Equation, Chemical Equilibrium, Adiabatic, and Flame Speed Model – Zimont are selected), NOx Model – On (Thermal, Prompt, and N2O Intermediate are selected). Equivalence ratios, inlet flow rates and temperatures are entered form Zone of Boundary Conditions, Prompt Tab of NOx Model and Boundary tab of PDF Table by changing Fuel (shale gas-air mixture) and Oxid (air) ratios for the complete combustions and others.
Shale gases used in this study are extracted from different field sources of Barnette, New Albany, Fayetteville, and Haynesville regions of USA. The average values of the gas compositions of the fields are given in Table 1.
Table 1. The shale gas compositions used in the numerical calculations [24]
|
Regions |
CH4 |
C2H6 |
C3H8 |
CO2 |
N2 |
|
Barnette |
86.75 |
6.725 |
1.975 |
1.675 |
2.875 |
|
New Albany |
89.875 |
1.125 |
1.125 |
7.875 |
0 |
|
Fayetteville |
97.3 |
1 |
0 |
1 |
0.7 |
|
Haynesville |
95 |
0.1 |
0 |
4.8 |
0.1 |
Figure 2. The co-axial combustor and the inlet flow rates and temperatures for fuel and air [25]
NOx emissions are evaluated in terms of NO concentration at the outlet. Furthermore, the mass fraction of NO in the range of 10-4 can also be evaluated as the mass fraction of NOx being the sum of NO and NO2 mass fractions because the mass fraction of NO2 is usually in the range of 10-6 in the results of the computations in literature.
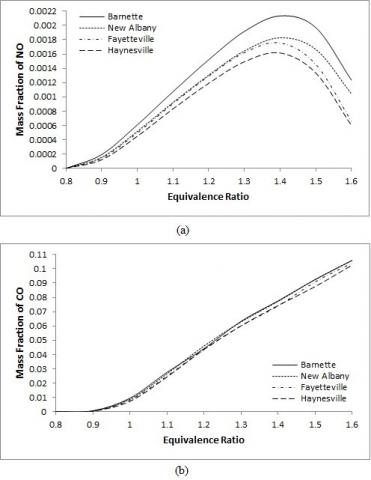
The mass fractions of NO at various equivalence ratios from 0.8 to 1.6 are given in Figure 3a. Maximum NO mass fractions at the end of partially premixed combustions of Barnette, New Albany, Fayetteville, and Haynesville shale gases emerge at the equivalence ratios of 1.42, 1.41, 1.4, and 1.39, respectively. The highest value of NO emission is obtained in the combustion of Barnette shale gas as 0.002135 kg NO/kg. There is roughly a difference of 25% between Barnette and Haynesville NO emissions. NO emissions are reduced when the equivalence ratio is futher increased because the rising equivalence ratio means rich fuel mixture and reducing air in the combuster decreases both reaction temperatures and thermal NO because of poor combustion. Moreover, it is seen that the high CH4 and low C2H6-C3H8 contents of Fayetteville and Haynesville cause to NO emissions to diminish.
The CO emissions are represented in Figure 3b. The rising equivalence ratio means high fuel in the combustor. It generally provokes the incomplete combustion and increases CO amount. The heavy hydro carbon and CO2 contents jointly of Barnette and New Albany raise CO emissions as well. The rank for CO emissions of all the shale gas combustions is obtained same as the rank of equivalence ratios. CO emission for Barnette is 0.00949 kg CO/kg at ER=1 and there is a difference of 23% between Barnette and Haynesville.
Figure 3. Mass fractions of NO (a) and CO (b) at different fuel equivalence ratio
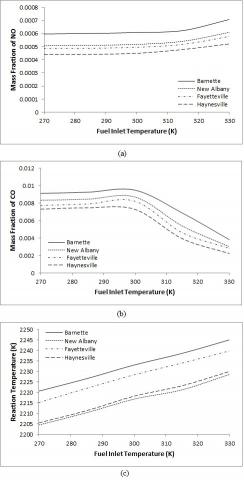
The variation of NO and CO emissions with respect to fuel inlet temperatures is illustrated in Figure 4a and 4b. There is no crucial increment up to 300 K, but NO begins to escalate after 300 K for all the shale gas. The reason is that the rising reaction temperature increase thermal NO. CO emissions diminish after 300 K because fuel burns better in the high temperature medium. The orders are same as in the order of equivalence ratio. The NO increment and CO decrement between 300 and 330 K are around 17% and 65%, respectively.
The adiabatic reaction temperatures are seen in Figure 4c. Ascending inlet temperature of fuel enhances reaction temperatures by 1.1% approximately between 270 and 330 K. The order of reaction temperatures from the highest to the lowest is Barnette, Fayetteville, Haynesville, and New Albany. The difference between Barnette and New Albany is 16 K and 0.72% at the fuel inlet temperature of 300 K. The higher oxygen contents premixed with Barnette and Fayetteville shale gases increase total oxygen amount in the combustor and cause the order of reaction temperatures to change by burning better of these shale gases. Hence, it can be concluded that the main factors affecting the reaction temperatures of shale gases are the contents of gases and changing oxygen amounts in premixed air/gas.
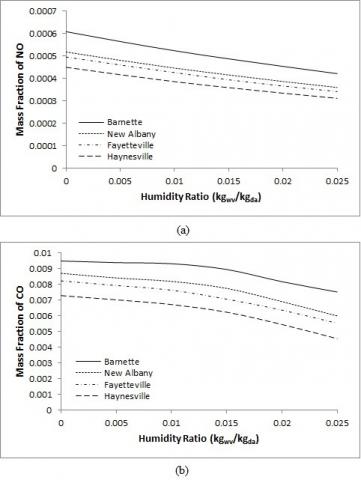
The effect of the humidity in the burning air on NO emissions is shown in Figure 5a. The ascending humidity ratio in the air decreases NO mass fractions for all the shale gas combustions because the humidity reduces reaction temperatures by both its heat holding ability and preventing oxygen to reach to the flame zone with covering the flame up [22]. Thus, decreasing temperature of reaction diminish thermal NO. The variation in NO mass fraction between 0 and 0.025 kgwv/kgda is near 30%. The highest NO belongs to Barnette followed by New Albany, Fayetteville, and Haynesville. CO emissions at various humidity ratios are presented in Figure 5b. The humidity increment in the air reduces CO mass fractions in the combustions because of the extinguished burning. The difference between the highest and the lowest values for Barnette, New Albany, Fayetteville, and Haynesville are 20.7%, 31%, 32.5%, and 37%, respectively.
The pressure gauge in Fluent is relative to the atmospheric pressure. In other words, 1 bar of atmosphere pressure is indicated as 0 bar in the gauge. Figure 6a represents NO emissions at different inlet pressures of fuel and air together. The augmenting pressure ascends NO up to 5 bar for Barnette and 4 bar for Fayetteville, Haynesville and New Albany approximately and after these pressure values, NO mass fractions begin to reduce. High inlet pressure increases mass density of gas and air and increasing mass density promotes both reaction temperature and thermal NO to ascend until a certain inlet pressure value. But higher mass density causes the less burning of gases in a constant volume combustion chamber.
CO emissions totally decrease by the rising pressure as given in Figure 6b. A 90% downfall in the average of all between 0 and 10 bar is detected in CO mass fractions. High inlet pressure causes CO and oxygen to react further by increment in moleculer movement in combustion chamber and decreases CO mass fraction at the end of combustion. In the same time, higher pressure values also promote CO to decrease because of less burning of fuel with higher mass density. As a result, increasing inlet pressure of fuel and air permanently decreases CO mass fraction. The low NO and CO emissions are very important for vehicle engines performing the combustion in high pressure.
Figure 4. Mass fractions of NO (a) and CO (b), reaction temperature (c) at different fuel inlet temperatures with ER=1
Figure 5. Mass fractions of NO (a) and CO (b) at different humidity ratios with ER=1
Figure 6. Mass fractions of NO (a) and CO (b) at different inlet pressures with ER=1
Figure 7a and 7b indicates NO and CO emissions at the folds of various inlet flow rates. Rising flow rates drops off both NO and CO mass fractions because redundant fuel and air mass entering into the combustion chamber of certain volume induces poor combustion by unburned hydro carbons exiting from the outlet. There are approximately the average reductions of 75% and 62% for NO and CO mass fractions.
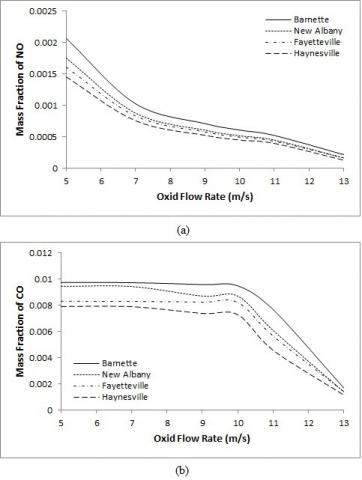
The effect of oxid (air) flow rate on NO mass fractions is given in Figure 8a. The increasing air flow rate relieves NO emissions for all the shale gas combustions because excessive air reduces the total equivalence ratio and get close to the complete combustion. It also lowers CO emissions after 10 m/s especially as shown in Figure 8b. The reason for decreasing sharply of CO emissions after air flow rate of 10 m/s is that higher flow rate may cause less burning of gas’s components and oxygen in air because there is no enough time for burning and reacting of molecules in a constant volume combustion chamber. NO emissions averagely decrease 90% for all at the interval of 5-13 m/s. CO mass fractions between 10 and 13 m/s roughly reduces 83% on average for the combustions of shale gases.
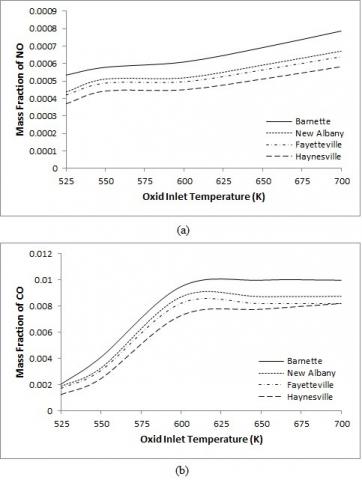
The variations in NO and CO mass fractions at various oxid (air) inlet temperatures are demonstrated in Figure 9a and 9b. The growing oxid inlet temperature causes mass fraction of NO to ascend. The augment tendency of NO emissions seems higher after 600 K. It is generally expected that ascendant oxid temperature increases the reaction temperature and the ascending temperature grows thermal NO up. The ordering for NO emissions from the highest to the lowest at the end of shale gas/air combustion is Barnette, New Albany, Fayetteville, and Haynesville. The difference between 525 K and 700 K is 47%, 53%, 52%, and 57% with 0.000252, 0.000233, 0.000219, and 0.000212 kg NO/kg for Barnette, New Albany, Fayetteville, and Haynesville, respectively. CO emissions severely advance up to 600 K and get a little high between 600 K and 700 K because increasing air inlet temperature raises reaction temperature and rising reaction temperature is able to cause to the reaction of molecules of oxygen and nitrogen before oxygen and carbon monoxide after air inlet temperature of 600 K. The average increment is roughly 360% till 600 K and 0.3% between 600 K and 700 K. The lower CO emissions can be obtained at the low oxid inlet temperatures.
Figure 7. Mass fractions of NO (a) and CO (b) at different folds of inlet flow rates with ER=1
Figure 8. Mass fractions of NO (a) and CO (b) at different oxid flow rates with ER=1
Figure 9. Mass fractions of NO (a) and CO (b) at different oxid inlet temperatures with ER=1
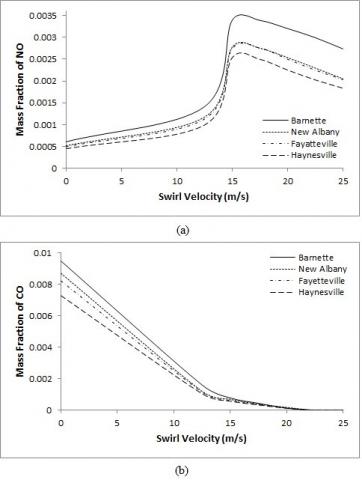
Figure 10. Mass fractions of NO (a) and CO (b) at different swirl velocities with ER=1
The effect of swirl velocity on the mass fraction of NO is plotted in Figure 10a. NO emissions indicate a serious growth up to 15 m/s swirl velocity and begin to decrease at the interval of 15-25 m/s. The increment percentage is approximately 450% as mean for all and the moderation percentage is roughly 19.2%, 25%, 25%, and 27% from 15 m/s to 25 m/s for Barnette, New Albany, Fayetteville, and Haynesville, respectively. The ascending swirl velocity increases the turbulent and flame intensity in the combustion chamber. It also causes a good combustion by providing a good mixing of premixed shale gas-air with upstream burning air. The proximity to the complete combustion with high swirl velocities can also be seen by the degradation in CO emissions in Figure 10b. The better combustion process always produces the lower CO emission. The increasing of the swirl velocity from 0 to 25 m/s averagely ensures 100% attenuation in CO emissions for all the shale gas combustion.
The prevention of NO, CO and the other pollutant emissions emerging at the end of the gas and other combustion processes in power plants, vehicle engines and heating systems are not possible with today’s technologies. However, the methods as exhaust gas re-circulation, catalytic reduction, water injection, compressed air, humid combustion air, low sulphur fuel, liquid shower, etc. are able to minimize the emissions into the acceptable levels [5].
The NO and CO emissions of the partially premixed combustions of the shale gases extracted from Barnette, New Albany, Fayetteville, and Haynesville regions of United States of America are numerically investigated and the mass fractions of NO and CO are determined at various reactant inlet temperatures, equivalence ratios, humidity ratios, flow rates, pressure, oxid flow rates and temperatures, and swirl velocities. The following results are obtained:
|
CFD |
computational fluid dynamics |
|
CH4 |
methane |
|
C2H6 |
ethane |
|
C3H8 |
propane |
|
CO |
carbon monoxide |
|
CO2 |
carbon dioxide |
|
ER |
equivalence ratio |
|
H2O |
water |
|
NO |
nitrogen oxide |
|
NOx |
nitrogen oxides |
|
K |
kelvin |
|
N2 |
nitrogen |
|
Atm |
atmosphere |
|
wv |
water vapour |
|
da |
dry air |
[1] Bilgen, S., Sarıkaya, İ. (2016). New horizon in energy: Shale gas. Journal of Natural Gas Science and Engineering, 35: 637-645. http://dx.doi.org/10.1016/j.jngse.2016.09.014
[2] Chapiro. G., Bruining, J. (2015). Combustion enhance recovery of shale gas. Journal of Petroleum Science and Engineering, 127: 179-189. http://dx.doi.org/10.1016/j.petrol.2015.01.036
[3] Vargas, A.C., Arrieta, A.A., Arrieta, C.E. (2016). Combustion characteristics of several typical shale gas mixtures. Journal of Natural Gas Science and Engineering, 33: 296-304. http://dx.doi.org/10.1016/j.jngse.2016.03.039
[4] Wang, Q., Chen, X., Jha, A.N., Rogers, H. (2014). Natural gas from shale formation-the evolution, evidences and challenges of shale gas revolution in United States. Renewable and Sustainable Energy Reviews, 30: 1-28. http://dx.doi.org/10.1016/j.rser.2013.08.0 65
[5] Ozturk, S. (2018). A computational evaluation for hazardous emissions of non-premixed shale gas combustion. Journal of Scientific and Engineering Research, 5(11): 256-264.
[6] Jerzak, W. (2014). Emissions of NOx and CO from natural gas combustion with adding CO2 at varying distances from the burner. Annual Set the Environment Protection, 16: 148-160.
[7] Kale, M., Choudhary, R., Dixit, S.K. (2015). A computational evaluation of emissions for non-premixed natural gas combustion. International Journal of Scientific Research Engineering & Technology, 4(7): 731-735.
[8] Somarathne, K.D.K.A., Parwatha, G., Oguri, S., Nada, Y., Ito, T., Noda, S. (2013). NOx reduction of non-premixed flames by combination of burner and furnaces. Journal of Environment and Engineering, 8(1): 1-10. http://dx.doi.org/10.1299/jee.8.1
[9] Akça, H., Ürel, G., Karacan, C.D., Tuygun, N., Polat, E. (2017). The effect of carbon monoxide poisoning on platelet volume in children. J Pediatr Emerg Intensive Care Med, 4: 13-16. http://dx.doi.org/10.4274/cayd.52523
[10] Alyüz, B., Veli, S. (2006). İç ortam havasında bulunan uçucu organik bileşikler ve sağlık üzerine etkileri. Trakya Univ J Sci, 7(2): 109-116.
[11] Cohen, B, Winkler, H. (2014). Greenhouse gas emissions from shale gas and coal for electricity generation in South Africa. S Afr J Sci., 110(3/4): 1-5. http://dx.doi.org/10.1590/sajs.2014/20130194
[12] Chang, Y., Huang, R., Ries, R.J., Masanet, E. (2015). Life-cycle comparison of greenhouse gas emissions and water consumption for coal and shale gas fired power generation in China. Energy, 86: 335-343. http://dx.doi.org/10.1016/j.energy.2015.04.034
[13] Shahi, M., Kok, J.B.W., Casado, J.C.R., Pozarlik, A.K. (2014). Assessment of thermoacoustic instabilities in a partially premixed model combustor using URANS approach. Applied Thermal Engineering, 71: 276-290. http://dx.doi.org/10.1016/j.applthermaleng.2014.0 6.068
[14] Andreinia, A., Facchinia, B., Innocentia, A., Ceruttib, M. (2014). Numerical analysis of a low NOx partially premixed burner for industrial gas turbine applications. Energy Procedia, 45: 1382-1391. http://dx.doi.org/10.1016/j.egypro.2014.01.145
[15] Jaggu, N., Sriram, A.T., Adin, G., Ravi, S.D. (2017). Numerical prediction of NOx emissions from a partially premixed type burner of a gas fired air heating system. RUAS-SASTech Journal, 16(1): 21-24.
[16] Xue, H., Aggarwal S.K. (2003). NOx emissions in n-heptane/air partially premixed flames. Combustion and Flame, 132: 723-741. http://dx.doi.org/10.1016/S0010-2180(02)00534-5
[17] Li, S.S., Li, S.H., Mira, D., Zhu, M, Jiang, X. (2018). Investigation of dilution effects on partially premixed swirling syngas flames using a LES-LEM approach. Journal of the Energy Institute, 91: 902-915. https://doi.org/10.1016/j.joei.2017.09.005
[18] Naha, S., Aggarwal, S.K. (2004). Fuel effects on NOx emissions in partially premixed flames. Combustion and Flame, 139: 90-105. https://doi.org/10.1016/j.combustflame.2004.07.006
[19] Tian, L., Liu, L.S., Duan, R.Z. (2018). Experimental investigation on oxygen diluted partially premixed and oxygen enriched supplemental combustion for low emission. Energy, 156(2018): 144-153. https://doi.org/10.1016/j.energy.2018.05.033
[20] Liu, Z.G., Kong, W.J., Consalvi, J.L., Han, W.H. (2018). H2/CO/air premixed and partially premixed flame structure at different pressures based on reaction limit analysis. Science Bulletin, 63(19): 1260-1266. https://doi.org/10.1016/j.scib.2018.08.011
[21] Gebhardt, Z. (2015). Analysis of the possibilities for using shale gas to supply gas appliances based on the comparative assessment of gas. Nafta-Gaz, 11. https://doi.org/10.18668/NG2015.11.16
[22] Öztürk, S., Eyriboyun, M. (2010). NOx formation in combustion of natural gases used in Turkey under different conditions. Journal of Thermal Science and Technology, 30(2): 95-102.
[23] Guessab, A., Aris, A., Bounif, A. (2013). Simulation of turbulent piloted methane non-premixed flame based on combination of finite-rate/eddy-dissipation model. Mechanika, 19(6): 657-664. http://dx.doi.org/10.5755/j01.mech.19.6.6000
[24] Bullin, K., Krouskop, P. (2008). Composition variety complicates processing plans for US shale gas. Research and Engineering Inc., Gas Processors Association, Bryan.
[25] ANSYS Fluent Release 14.5. (2013). Tutorial 13. Partially Premixed Combustion in a Co-axial Combustor, ANSYS, Inc., 1-17.