Hooman Enayati
© 2020 IIETA. This article is published by IIETA and is licensed under the CC BY 4.0 license (http://creativecommons.org/licenses/by/4.0/).
OPEN ACCESS
The current paper presents a numerical study of flow and thermal maps in cylindrical enclosures heated laterally of two different diameters while keeping the enclosure height constant at H = 821.7 mm. The current study aims to understand the impact of different reactor sizes on the flow and thermal maps inside the crystal growth reactor as they are the key parameters that affect the mass flow rate inside an ammonthermal crystal growth reactor. Three-dimensional (3D) Large Eddy Simulation (LES) simulations are conducted by implementing a commercial computational fluid dynamics (CFD) software, ANSYS FLUENT. The two Rayleigh (Ra) numbers are 2×10⁷ and 8.2×10⁴ based on properties at the mean fluid temperature (315 K) and the characteristic length of R/2 (volume/lateral area). As the main achievement of this study, it can be determined that the diameter (D) of the cylindrical reactor plays a major role in the flow causality and thermal map. In the small diameter reactor (D = 25.4 mm; H/D = 32.35), the temperature distribution roots the buoyant forces to be active both in the boundary layers in the vicinity of the walls and the core region of the reactor. However, in the large diameter reactor (D = 158.8 mm; H/D = 5.17), the temperature distribution in the core is practically constant, causing the shear forces exerted by the boundary layers to play the main role in moving the fluid core, while buoyancy is dominant only in creating the boundary layers adjacent to the walls. The new understanding from this research study would eventually help the next researches to better design a crystal growth reactor given the fact that flow and thermal maps would alter the mass transfer study which would further affect the deposition rate on the seeds.
fluid flows, LES simulations, crystal growth, natural convection, 3D cylindrical reactor, CFD, Buoyancy
Free convection flow, which arises due to the density gradient resulting from concentration or temperature differences, has numerous natural and industrial applications. Transport of nutrients and pollutants in a water body such as an ocean or a crystal growth reactor are selected applications which natural convection is the main mode of flow movement. GaN crystals can be manufactured through an ammonothermal crystal growth method that uses free convection to move around the nutrients to eventually make the crystallized form of GaN on the seeds inside the reactor.
A buoyancy-driven flow has been studied numerically and experimentally extensively in the literature over the past decades for two main thermal boundary conditions; top-bottom heating and side-wall heating [1-4]. Hall et al. [5], conducted a numerical and theoretical study of transient natural convection in a two-dimensional rectangular domain for Ra = 103 - 106, Pr = 7, and height/length ratio = 1. The characteristic length considered in that study was based on the height of the enclosure. A sudden heating was applied on one of the side walls, while the remaining walls were kept insulated. The authors found out that the process had two distinct phases; early period dominated by conduction and the late period dominated by convection.
The thermal distribution plays a major role in determining the characteristics of flow map inside the domain. There are also some studies that looked at the effects of a heat generation source within the domain. Ramezanpour et al. [6], presented their experimental results of free convection in an open-ended concentric and eccentric annulus considering helical fin on the internal tube. They investigated the effect of pitches and fin diameter considering various constant temperatures on the inner tube. The aforementioned thermal boundary condition was achieved by passing saturated steam at different pressure through the tube.
Several studies have been conducted considering the Boussinesq approximation and temperature dependent properties for the working fluid [7-10]. Furthermore, natural convection has also been studied for various geometries such as a cube, vertical cylinder or triangular shape both using 2D and 3D approaches [11-13].
Herraez et al. [14], studied free convection in air around horizontal cylinders of different diameters (fixed length) with different surface temperatures using holographic interferometry to define the corresponding temperature fields. They defined an equation for the temperature filed for three different diameters; 0.01 m, 0.02 m and 0.03 m. The GrPr value in their study was varied from 2.2×10³ to 1.6×10⁵. Al-Arabi et al. [15] conducted an experimental study to determine the local and average heat transfer by natural convection from the outside surface of isothermal cylinders of different diameters and lengths at different inclinations considering two different flow regimes; laminar and turbulent. They concluded that the heat transfer depended on both the diameter and inclination of the cylinders. Ludovisi et al. [16] conducted 2D CFD models to investigate the natural convection in water-filled horizontal pipes of various diameters. With the assumption of a uniform pipe surface temperature, they claimed that the Nusselt number was not strongly dependent on the Prandtl number but a function of the Rayleigh number. Moreover, the numerical results were compared to experimental data and other relevant available in literature.
The current author has studied a relatively new thermal boundary condition which is “laterally-heating” for the walls [17-23]. They conducted several 2D RANS, 3D RANS, and 3D LES numerical studies to investigate the fluid flow and temperature distribution in a relatively big crystal growth reactor (fixed diameter of 6.25 in) using temperature dependent properties or by implementing the Boussinesq approximation in the numerical settings. The present work aims to add more information to the previous studies of the current author while the size of the reactor is reduced (by decreasing the diameter) to better understand the possible new physics inside the crystal growth reactor. The numerical results from the current research study can potentially pave the path for the next rector designers to improve the optimum enclosure design. To the author’s knowledge, there is no study for the proposed thermal boundary conditions, and the presented dimensions for a cylindrical vertical reactor by which the flow and thermal maps have been studied. Here is the novelty of the current research which would shed light on the physics of this study.
The present article shows fluid flow and thermal maps characterizing natural convection in a laterally heated cylindrical reactor for two different aspect ratios. A key point in this study is that the height (H) is kept unchanged for both reactors and the main goal is to determine the effect of the reactor diameter (while height is kept constant) on the core flow and boundary layers patterns, associated temperature distribution, and the role of the buoyant force inside the reactor. Having the knowledge of changing roles and interaction between the shear force and buoyant force as a function of the reactor diameter will help improve the design of a crystal growth reactor as the impact of these forces on the flow and temperature maps ultimately affect the etching and deposition of GaN crystals inside the crystal growth reactor.
The remainder of this paper is organized as follows:
Section 2 shows the governing equations, geometry and the numerical domain, boundary and initial conditions, numerical set-up and talks about the mesh and time studies to better explains the numerical approach in the simulations. Section 3 provides the numerical results of the current study in terms of velocity, temperature and density contours inside the reactor on several planes and lines. This section better explains the related natural convection concept in a laterally heated cylindrical reactor. The numerical results support the conclusion section that is provided in section 4 of this article.
2.1 Governing equations
The governing equations for an incompressible flow with temperature-dependent properties using LES (Dynamic Smagorinsky) model are the general forms of the continuity equation, Navier-Stokes equations (NSE), and energy equations. In the LES study, the large three-dimensional unsteady scales are explicitly resolved, whereas the effects of the smaller scales are modeled using Sub-grid scale (SGS) models. LES model is expected to be more accurate and reliable than a RANS model for flows in which large-scale unsteadiness is more important. LES spatially filters the equations of motion and resolves eddies larger than the filter size, while the smaller ones are modeled. In fact, LES models are more reliable than RANS models, as they only model scales smaller than the filter size and resolve all the other scales. The Kolmogorov theory justifies the LES model. Sub-grid scales are any scales that are smaller than the cutoff filter width. Two classes of SGS models exist; the first class is functional models and the second class is structural models. Some models may be categorized as both. In LES, a filter function is used to distinguish between the small and large scales. This would happen by introducing the filter length scale that works as the cutoff width for the scales. All eddies larger than this length scale are resolved directly and the smaller eddies are modeled. More details about the LES method and its relevant equations can be found by Enayati [24] and are not presented in this section.
2.2 Geometry and corresponding numerical domain
Figure 1-a presents the general 3D cylindrical geometry of both small and big reactors. Figure 1-b shows the two-dimensional (2D) cross-section of Figure 1-a on X-Y plane. The cross-section represents walls on the outer side of the numerical domain. The length of the hot wall (487.68 mm), insulator (12.7 mm), and cold wall (321.27 mm) were kept constant, while two different diameter values for the reactor were considered: 6.25 in (158.75 mm) for the big reactor, and 1 inch (25.4 mm) for the small reactor, respectively. The full geometry values for the big reactor were based on an in-house experimental apparatus of the same dimensions designed to simulate a crystal growth autoclave geometry [18]. The one-inch reactor value was chosen to show a distinct diameter difference to better understand the possible changes in terms of flow patterns and temperature distribution inside the reactor.
Figure 1. (a) Schematic of the 3D cylindrical geometry (b) Schematic of the geometry on the X-Y plane
Table 1. Water with temperature dependent properties [24], 1 atm
|
|
B0 |
B1 |
B2 |
B3 |
B4 |
|
Density (kg/m3) |
765.33 |
1.8142 |
-0.0035 |
0 |
0 |
|
Specific Heat (j/(kg-k)) |
28109.49 |
-282.0843 |
1.251534 |
-0.002480858 |
1.857e-6 |
|
Thermal conductivity (w/(m-k)) |
-0.5752 |
0.006397 |
-8.151e-6 |
0 |
0 |
|
Viscosity (kg/(m-s)) |
0.0967 |
-0.0008207 |
2.344e-6 |
-2.244e-9 |
0 |
2.3 Boundary and initial conditions
The transient governing equations (NSE and energy) were initialized by considering the Newtonian working fluid (water) inside the reactor at rest (no velocity), with a starting average temperature of 315 K. The upper cold and lower hot walls had a constant temperature of $T_{L}=$310 K and $T_{H}=$320 K, respectively. The top and bottom caps (walls) along with the insulator section (insulator wall) that splits the cold from the hot sections of the reactor were adiabatic (see Figure 1-b). All walls were considered fixed with no applied velocity magnitudes on them.
2.4 Numerical set-up
The Pressure-Implicit with Splitting of Operators (PISO) algorithm was incorporated for the pressure-velocity coupling. This extended form of SIMPLE family algorithm is used in solving the Navier-Stokes equations by addition of two extra terms in the equations. More detailed information can be found in the research [25]. A second-order implicit temporal formulation was considered for the unsteady flow computations. The spatial discretization for pressure, momentum, and energy were PREssure STaggering Option (PRESTO) and Bounded Central Differencing [25]. The working fluid (water) was considering that its transport properties varied with temperature during the numerical computations. The properties of the water are a polynomial function of the temperature (B0+B1×T+B2×T2+B3×T3+B4×T4). The constants in this polynomial are provided in Table 1. Note that in an ammonothermal growth environment, if one respects geometric and dynamic similitude (same Ra number), then conclusions regarding flow and temperature patterns obtained from numerical simulation done with water can be scaled successfully to the GaN environment (Ammonia instead of water). A convergence criterion of 5×10⁻⁵ was chosen for all the primary variables in the governing equations.
2.5 Mesh and time-step studies
Figure 2 presents the grid resolution on an arbitrary X-Z plane of the 3D domain (arbitrary height). A magnified view of the near-wall region of Figure 2-a is illustrated in Figure 2-b to capture the details of the boundary layer formation and flow behavior near the walls. Far away from the wall, the grid used 16 elements over 6 mm length (biased elements) for the big reactor and 12 elements over 2 mm for the small reactor (biased elements), respectively.
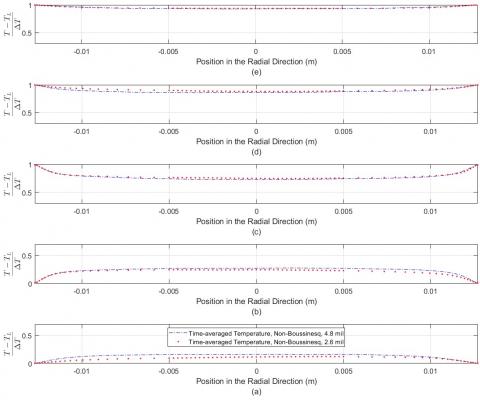
In the current study, for the big and small reactor, more than 5.25 million and 4.8 million elements were considered, respectively. Based on the previous study [18], for a numerical study with a relatively similar Ra value and thermal boundary conditions, that current number of elements for the big reactor (6.25 in diameter) provides accurate numerical results. Hence, a separate mesh study was not conducted for the big reactor of the current study. For the smaller reactor (one-inch diameter), a separate mesh study was conducted (using 2.6 million and 4.8 million elements) to investigate the accuracy of the numerical results. Seven lines were considered inside the reactor (see Table 2 for the locations) and the time-averaged temperature over a time window of 100 sec on each line was recorded and studied (Figure 3 and Figure 4). This time-window was selected based on the previous study [18]. As can be seen, the difference between these two mesh grids are not high (less than 6%). Yet, a more conservative mesh grid size (4.8 million) was used for the analysis of the small reactor (one-inch diameter) in this research study.
A time step of 0.0025 sec was considered in the simulations for both reactor sizes. Based on the previous study [18], a time step of 0.005 sec works well for the big reactor and the higher Ra number. A more conservative time step value (0.0025 sec) was implemented in both numerical simulations as a time convergence study was not feasible for both cases due to the numerical simulation cost and lack of hardware resources.
Figure 2. (a) Mesh on X-Z radial plane (b) Zoomed-in area of interest in Figure 2-a
Table 2. Location of different lines for the mesh convergence study (one-inch diameter)
|
|
X (m) |
Y (m) |
Z (m) |
|
Line 1 |
0 |
0.2 |
[-0.0127, 0.0127] |
|
Line 2 |
0 |
0.3 |
[-0.0127, 0.0127] |
|
Line 3 |
0 |
0.4 |
[-0.0127, 0.0127] |
|
Line 4 |
0 |
0.6 |
[-0.0127, 0.0127] |
|
Line 5 |
0 |
0.7 |
[-0.0127, 0.0127] |
|
Line A |
0 |
[0.1, 0.7] |
[-0.0127, 0.0127] |
|
Line B |
0 |
[0.1, 0.7] |
0 |
Figure 3. Time-averaged temperature on five lines in Table 2 considering temperature dependent properties for the working fluid in the one-inch reactor; (a) Line 5 (b) Line 4 (c) Line 3 (d) Line 2 (e) Line 1
Figure 4. Time-averaged temperature on two lines in Table 2 considering temperature dependent properties for the working fluid; (a) Line B (b) Line A
The numerical results of flow and thermal maps inside the two reactors are presented in this section. Velocity and temperature values are normalized with respect to a reference velocity magnitude (1 mm/s), and $\frac{T-T_{L}}{T_{H}-T_{L}}$, respectively. The corresponding Ra and Pr numbers are 2×10⁷ (big reactor), 8.2×10⁴ (small reactor) and Pr = 4.17, respectively. These values correspond to the properties of water at 315 K as the average temperature ($\frac{T_{H}+T_{L}}{2}$). The characteristic length in the definition of the Ra is the ratio of reactor volume to its total area (R/2). Contours of velocity, temperature, and density on the X-Y plane are presented to better show the differences between these two numerical cases in terms of flow and thermal maps.
3.1 The small reactor (diameter = 25.4 mm)
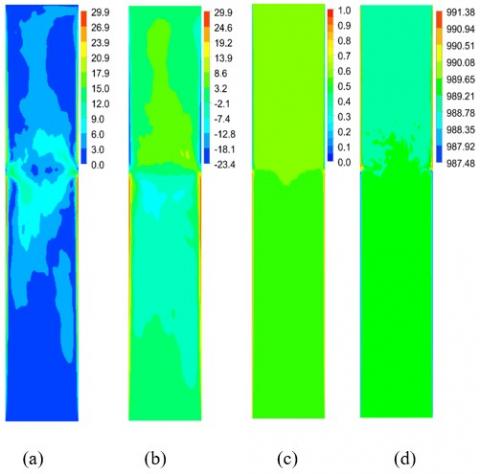
Figure 5 shows the time-averaged velocity (total magnitude and Y-velocity magnitude), time-averaged temperature and density contours of the small reactor (25.4 mm diameter) over a time-window of 100 sec on X-Y (Z = 0) diametral plane.
(a) normalized velocity contour (total velocity), (b) normalized velocity contour (Y-velocity), (c) normalized temperature, (d) Instantaneous density contour (kg/m3)
Figure 5. Small reactor, Time-averaged velocity and normalized temperature magnitude over 100 seconds on X-Y plane
Figure 5-a shows the normalized time-averaged velocity contour on the X-Y diametral plane (Z=0). Flow in the lower warmer zone of the reactor moves upward while the upper cooler flow moves downward. These two flow streams meet each other in the mixing zone where they exchange enthalpy and momentum. The mixing zone is where an adiabatic region zone separates the hot/cold zones, and the imposed thermal boundary conditions are changing from a constant high temperature (TH) to a constant low temperature (TL). One can observe several vortices in the reactor as they form and vanish in space and time as the flow is turbulent in nature. It needs to be emphasized that flow with high-velocity values inside the reactor, moves mainly in the central regions far away from the vertical walls (red and green regions in Figure 5-a).
Figure 5-b presents the normalized time-averaged Y-velocity contour on the same place (Z=0) as Figure 5-a. As can be seen, flow with higher magnitude and momentum in the Y direction exists in the central regions of the upper section. Similarly, flow moves downward in the Y-direction in the lower core regions of the reactor.
Figure 5-c presents the normalized mean temperature on the diametral X-Y plane (Z=0). As can be observed, the working fluid is warmer in the lower section of the reactor whereas the upper part of the reactor includes a cooler working fluid. The current temperature distribution could be expected as the lower section of the reactor includes hot walls which could end in a warmer flow in the lower section of the reactor. This thermal map clearly explain that the buoyant force is strong inside the domain. Note, the normalized temperature is around the mid-temperature (0.5) which shows a good mixing in terms of flow mixing inside the reactor in the mixing zone. Furthermore, the current thermal distribution does not show a temperature inversion, will be discussed later for the bigger reactor, and this is an important finding regarding the temperature distribution inside the reactor. In fact, due to the small size of the reactor, boundary layers that form on both side walls meet each other mainly near the mixing zone and that would cause the flow and thermal distribution become completely different than the big reactor due to the better mixing of warm and cool fluid flows.
Figure 5-d presents the density distribution on the same plane (Z=0) inside the reactor. As can be observed, flow with a higher density exists in the upper cool section of the reactor whereas the lower warm section displays lower density values. This trend is consistent with the thermal movement regarding decreasing temperature and consequently, having higher density values for an incompressible working fluid. In addition, in Figure 5-b, a strong and continues temperature gradient exists near the wall and the core regions of the reactor.
Figure 6 presents the normalized time-averaged temperature distribution on five selected locations (see Table 3) inside the small reactor. As can be seen in Figure 5-c, the lower section of the reactor has a warmer fluid while the upper section of it, has a cooler fluid flow. The normalized temperature in the upper locations (for instance Figure 6-a) and the lower locations (for instance Figure 6-e) clearly show that temperature inversion does not happen in this reactor size and the buoyant force is the dominant force inside the reactor (both in the central core regions and in the vicinity of walls). Also, in the upper and lower sections of the reactor, the normalized temperature is close to zero and one, respectively. This happens as the wall temperature value and temperature magnitude near it are relatively equal. In fact, there is not a sharp temperature gradient near the lateral wall as can be seen in Figure 6 as a more uniform temperature domain exists near the walls.
Table 3. Location of different lines on X-Y plane (Z = 0), both reactors
|
|
X (m), big reactor |
X (m), small reactor |
Y (m) |
Z (m) |
|
Line 1 |
[-0.079375, 0.079375] |
[-0.0127, 0.0127] |
0.2 |
0 |
|
Line 2 |
[-0.079375, 0.079375] |
[-0.0127, 0.0127] |
0.3 |
0 |
|
Line 3 |
[-0.079375, 0.079375] |
[-0.0127, 0.0127] |
0.4 |
0 |
|
Line 4 |
[-0.079375, 0.079375] |
[-0.0127, 0.0127] |
0.6 |
0 |
|
Line 5 |
[-0.079375, 0.079375] |
[-0.0127, 0.0127] |
0.7 |
0 |
A similar discussion of Figure 5 can be provided in this section. Figure 7 presents the time-averaged normalized velocity, temperature and density contours over a time-window of 100 sec on the X-Y diametral plane (Z=0).
Figure 7-a shows the normalized velocity contour on the X-Y plane. Flow with higher velocity values only exists near the vertical walls while the central regions of the reactor have relatively low-velocity magnitudes particularly in the upper and lower core regions of the reactor. In other words, in the mixing zone where the adiabatic zone locates, the fluid dimensionless velocity magnitude is less than 18 and as it goes towards the upper and lower caps, its magnitude drops off even more.
Figure 7-b shows a similar trend as shown in Figure 5-b regarding the fluid movement in the central region of the reactor in the Y-direction. In fact, flow with a higher Y-velocity magnitude (dark green) exists in the upper section of the enclosure while the fluid flow has a lower Y-velocity magnitude (light green and blue) in the core region of the reactor. Note that in the vicinity of lateral/vertical walls, flow has the highest and lowest Y-velocity magnitudes (formation of momentum boundary layer).
Figure 7-c presents the normalized time-averaged temperature contour on the same plane of Figure 5-c. The temperatures values are relatively uniform far away from the lateral walls both in the upper and lower sections of the reactor. The flow with higher temperature values only exists near the walls, while the central region of the reactor is practically at a constant temperature. It is prominent that fluid of higher temperature happens to be in the upper colder section of the reactor while the lower section is inhabited by the fluid of lower temperature. In this reactor size, the boundary layers on the lateral walls of the reactor do not collide with each other and consequently, the flow and thermal maps are different from the smaller reactor.
Lastly, Figure 7-d presents the density distribution inside the domain. It visibly shows that fluid flow far away from the walls has relatively uniform density values while the upper section of the reactor has slightly lower density magnitudes in the central regions of the reactor compared to the lower section of it. This density distribution further confirms the temperature gradient inside the reactor.
(a) Line 5, (b) Line 4, (c) Line 3, (d) Line 2, (e) Line 1
Figure 6. Time-averaged normalized temperature on different lines using temperature-dependent properties for the working fluid over a time window of 100 s for the small reactor
(a) normalized velocity contour (total velocity), (b) normalized velocity contour (Y-velocity), (c) normalized temperature, (d) Instantaneous density contour (kg/m3)
Figure 7. Large reactor, Time-averaged velocity and normalized temperature magnitude over 100 seconds on X-Y plane
(a) Line 5, (b) Line 4, (c) Line 3, (d) Line 2, (e) Line 1
Figure 8. Time-averaged normalized temperature on different lines using temperature-dependent properties for the working fluid over a time window of 100 s for the big reactor
Figure 8 presents similar information as explained for Figure 6. The normalized time-averaged temperature distribution on five selected locations (see Table 3) inside the reactor is presented. As can be seen in Figure 8, the lower section of the reactor has a cooler fluid while the upper section, has a warmer fluid flow. The normalized temperature in the upper locations (for instance Figure 8-a) and the lower locations (for instance Figure 8-e) clearly show that temperature inversion does happen in this reactor size and the buoyant force is not the dominant force inside the reactor. Moreover, in the upper and lower sections of the domain, the normalized temperature is not close to zero and one, respectively. This is because the wall temperature value and temperature magnitude in the vicinity of it are not similar in terms of magnitudes.
To summarize, a comparison of temperature contours between Figure 5-c and Figure 7-c, reveals some interesting phenomena inside the reactor. First, one can observe a counterintuitive temperature inversion in the core of the large diameter reactor, a phenomenon that is absent in the small-diameter reactor. Secondly, the boundary layer in the big reactor is the fundamental driver of the core fluid where the radial temperature gradient is practically constant, relegating buoyancy to a minor role in the core’s fluid circulation and natural convection of heat. By comparison, as Figure 5-c shows, in the small reactor, the radial and axial temperature gradients are rather significant. As a result, buoyant forces in the core become one of the main drivers of the core’s fluid flow, in addition to the shear effect of the wall boundary layers. Thus, the small and big reactors which differ only through their diameters, are subject to two rather different mechanisms for the transfer of momentum and heat through natural convection.
3D numerical simulations of natural convection in laterally heated cylindrical reactors were conducted, using Dynamic Smagorinsky LES model in ANSYS FLUENT by considering temperature-dependent properties for the working fluid (water). Two different cylindrical reactor sizes were numerically simulated. The only difference between these two reactors was their diameters: The small reactor had a diameter of 25.4 mm while the big reactor’s diameter was 158.75 mm, i.e. 6.25 times larger. A temperature gradient (lateral-heating) of 10 K was applied to the cylindrical geometries with the aspect ratio (H/D) of 5.17 and 32.35 for the small and large reactors, respectively. Two Rayleigh numbers were 2×10⁷ and 8.2×10⁴ based on properties at the mean fluid temperature (315 K); water in this study. Note that the characteristic length for the Ra number is based on the ratio of the reactor’s volume to its lateral area as the characteristic length (Radius of the reactor/2).
Ammonia is the working fluid used in an ammonothermal crystal growth reactor. However, if one respects geometric (scaled dimensions in all directions by the same ratio) and dynamic similitude rules (a similar Ra number), then conclusions regarding flow and temperature patterns obtained from a numerical simulation done with another fluid (water in this study) will apply to the GaN environment. Hence, it is vital to make sure that geometric and dynamic similitudes are respected in simulations.
The 3D LES simulations were conducted and contours of velocity, temperature, and density were illustrated on several planes to better analyze the physics behind these two cases (effect(s) of different reactor diameters on the flow and thermal maps).
Regarding flow analysis, natural convection flow movements are due to the buoyant forces inside a medium. It can be concluded that while both reactors exhibit circulating in boundary layers (vicinity of lateral/vertical walls) generated by buoyant forces, the velocity magnitudes were higher near the lateral walls in the big reactor. Note that in the vicinity of the lateral/vertical walls, buoyant force was the dominant force in the big reactor. The small reactor showed higher velocity magnitudes in the core region. In addition, the time-averaged velocity contours showed lower values in the small reactor compared to the big reactor.
With regard to thermal analysis, the relatively uniform temperature distribution observed in the core of the big reactor for the current Rayleigh number indicated that the momentum of the core was caused by the shear boundary layers rather than its buoyancy (only in the core/central region of the reactor). The temperature map in the big reactor exhibited an unexpected temperature inversion whereby the upper core was warmer by 0.5 K (could be large for a higher thermal boundary gradient (i.e. 30 K; in this study was 10 K)) than the lower core. This thermal trend was not observed in the small reactor where the core flow was subject to both buoyant and shear forces. In the small reactor, the warmer flow circulated in the lower section of the reactor while flow with cooler temperature was distributed in the upper part of the reactor. In the small diameter reactor, the temperature distribution roots the buoyant forces to be active both in the boundary layers and the core of the reactor. However, in the large diameter reactor, the temperature distribution in the core is practically constant, causing the shear forces (and not buoyant forces) exerted by the boundary layers to play the main role in moving the fluid core.
The next step for this study could be the addition of the rack and seeds inside a small size reactor to better understand the flow and thermal maps inside the reactor with the presence of obstacles as these studies would be beneficial for the mass transfer investigation inside a crystal growth reactor. Another step would be the implementation of a higher temperature gradient (as new thermal boundary conditions), considering temperature-dependent properties for the working fluid, on the lateral walls of the reactor (i.e. 30 K) while using higher operating pressure and temperature values in the numerical simulations.
This paper is based upon work supported by the National Science Foundation under Grant No. 1336700.
|
T |
Temperature, K |
|
TL |
Lower temperature on the wall, K |
|
TH |
Higher temperature on the wall, K |
|
H |
Total height of the reactor, mm |
|
D |
Diameter of the reactor, mm |
|
R |
Radius of the reactor, mm |
|
Ra |
Rayleigh number |
|
Pr |
Prandtl number |
[1] Lo, D.C., Young, D.L., Tsai, C.C. (2007). High resolution of 2D natural convection in a cavity by the DQ method. Journal of Computational and Applied Mathematics, 203(1): 219-236. http://dx.doi.org/10.1016/j.cam.2006.03.021
[2] Wu, W., Ewing, D., Ching, C.Y. (2006). The effect of the top and bottom wall temperatures on the laminar natural convection in an air-filled square cavity. International Journal of Heat and Mass Transfer, 49(11-12): 1999-2008. http://dx.doi.org/10.1016/j.ijheatmasstransfer.2005.11.027
[3] Catton, I., Edwards, D.K. (1967). Effect of side walls on natural convection between horizontal plates heated from below. Heat Transfer, 89(4): 295-299. http://dx.doi.org/10.1115/1.3614388
[4] Švarc, P., Dvorák, V. (2013). Numerical and experimental studies of laminar natural convection on a horizontal cylinder. Engineering Mechanics, 20(3/4): 177-186.
[5] Hall, J.D., Bejan, A., Chaddock, J.B. (1988). Transient natural convection in a rectangular enclosure with one heated side wall. International Journal of Heat and Fluid Flow, 9(4): 396-404. http://dx.doi.org/10.1016/0142-727X(88)90006-9
[6] Ramezanpour, M., Hosseini, R. (2020). An experimental study of natural convection in vertical annulus with helical fin. Experimental Heat Transfer, 33(3): 226-244. http://dx.doi.org/10.1080/08916152.2019.1614114
[7] Wu, X.Z., Libchaber, A. (1991). Non-Boussinesq effects in free thermal convection. Physical Review A, 43(6): 2833. http://dx.doi.org/10.1103/PhysRevA.43.2833
[8] Zhang, J., Childress, S., Libchaber, A. (1997). Non-Boussinesq effect: Thermal convection with broken symmetry. Physics of Fluids, 9(4): 1034-1042. http://dx.doi.org/10.1063/1.869198
[9] Hung, K.S., Cheng, C.H. (2002). Pressure effects on natural convection for non-Boussinesq fluid in a rectangular enclosure. Numerical Heat Transfer: Part A: Applications, 41(5): 515-528. http://dx.doi.org/10.1080/104077802753570347
[10] Mlaouah, H., Tsuji, T., Nagano, Y. (1997). A study of non-Boussinesq effect on transition of thermally induced flow in a square cavity. International Journal of Heat and Fluid Flow, 18(1): 100-106. http://dx.doi.org/10.1016/S0142-727X(97)00146-X
[11] Hsieh, S.S. (1990). Thermal correlation of natural convection in bottom-cooled cylindrical enclosures. Journal of Thermophysics and Heat Transfer, 4(1): 123-126. http://dx.doi.org/10.2514/3.29176
[12] Edwards, D.K., Catton, I. (1969). Prediction of heat transfer by natural convection in closed cylinders heated from below. International Journal of Heat and Mass Transfer, 12(1): 23-30. http://dx.doi.org/10.1016/0017-9310(69)90075-1
[13] Huang, D.Y., Hsieh, S.S. (1987). Analysis of natural convection in a cylindrical enclosure. Numerical Heat Transfer, Part A: Applications, 12(1): 121-135. http://dx.doi.org/10.1080/10407788708913577
[14] Herraez, J.V., Belda, R. (2002). A study of free convection in air around horizontal cylinders of different diameters based on holographic interferometry. Temperature field equations and heat transfer coefficients. International Journal of Thermal Sciences, 41(3): 261-267. http://dx.doi.org/10.1016/S1290-0729(01)01314-X
[15] Al-Arabi, M., Khamis, M. (1982). Natural convection heat transfer from inclined cylinders. International Journal of Heat and Mass Transfer, 25(1): 3-15. http://dx.doi.org/10.1016/0017-9310(82)90229-0
[16] Ludovisi, D., Garza, I.A. (2013). Natural convection heat transfer in horizontal cylindrical cavities: A Computational Fluid Dynamics (CFD) investigation. in ASME Power Conference, American Society of Mechanical Engineers, pp. 1-4. http://dx.doi.org/10.1115/POWER2013-98014
[17] Enayati, H., Chandy, A.J., Braun, M.J. (2016). Numerical simulations of turbulent natural convection in laterally-heated cylindrical enclosures with baffles for crystal growth. In ASME International Mechanical Engineering Congress and Exposition, American Society of Mechanical Engineers, pp. 1-9. http://dx.doi.org/10.1115/IMECE2016-66106
[18] Enayati, H., Chandy, A.J., Braun, M.J., Horning, N. (2017). 3D large eddy simulation (LES) calculations and experiments of natural convection in a laterally-heated cylindrical enclosure for crystal growth. International Journal of Thermal Sciences, 116: 1-21. http://dx.doi.org/10.1016/j.ijthermalsci.2017.01.025
[19] Enayati, H., Chandy, A.J., Braun, M.J. (2016). Numerical simulations of transitional and turbulent natural convection in laterally heated cylindrical enclosures for crystal growth. Numerical Heat Transfer, Part A: Applications, 70(11): 1195-1212. http://dx.doi.org/10.1080/10407782.2016.1230378
[20] Enayati, H., Chandy, A.J., Braun, M.J. (2018). Large eddy simulation (LES) calculations of natural convection in cylindrical enclosures with rack and seeds for crystal growth applications. International Journal of Thermal Sciences, 123: 42-57. http://dx.doi.org/10.1016/j.ijthermalsci.2017.08.025
[21] Enayati, H., Braun, M.J., Chandy, A.J. (2018). Numerical simulations of porous medium with different permeabilities and positions in a laterally-heated cylindrical enclosure for crystal growth. Journal of Crystal Growth, 483: 65-80. http://dx.doi.org/10.1016/j.jcrysgro.2017.11.019
[22] Enayati, H., Chandy, A., Braun, M.J. (2017). Three-Dimensional large eddy simulations of natural convection in laterally heated cylindrical enclosures with racks and seeds for crystal growth. In ASTFE Digital Library. Begel House Inc. http://dx.doi.org/10.1615/TFEC2017.cfd.017674
[23] Enayati, H., Chandy, A.J., Braun, M.J. (2015). Numerical simulations of natural convection in a laterally-heated cylindrical reactor. In Proceedings of the 1st Thermal and Fluids Engineering Summer Conference. http://dx.doi.org/10.1615/TFESC1.cmd.012704
[24] Enayati, H. (2019). Numerical flow and thermal simulations of natural convection flow in laterally-heated cylindrical enclosures for crystal growth. Doctoral dissertation, University of Akron. http://orcid.org/0000-0001-9933-2010
[25] Ansys Theory Guide, 2018.