OPEN ACCESS
Fouling in crude preheat trains in petroleum refineries affect the heat recovery from product streams significantly. Clear understanding on the effects of various operating conditions on fouling is still lacking among the researchers and practitioners. In the present study, a three-dimensional CFD model of a heat exchanger tube has been developed to predict the rate of coke deposition and fouling resistance through species-transport framework, in which, petroleum, asphaltenes and non-asphaltenes are represented as lumped pseudo-components in the crude oil. Asphaltenes particles were introduced into the bulk of crude oil and considered to be the only reactant for coke formation. The coke deposition rate and fouling resistance are predicted by varying the flow velocity, wall shear stress and surface roughness. From the CFD simulations, it is observed that the fouling resistance reduces under wall shear stress and surface roughness conditions as compared to no-slip and smooth surfaces, respectively.
Asphaltenes, CFD, Crude Oil, Fouling, Heat Transfer.
Crude oil comprises of different components such as saturates, aromatics, resins and asphaltenes. Crude oil fouling is attributed to various factors but asphaltenes are generally considered as the main precursors of fouling on heat transfer surfaces. Asphaltenes are partly in dissolved state and partly in colloidal dispersion form in crude oil [1]. Asphaltenes tend to precipitate upon changes in temperature and pressure conditions; and agglomerate and deposit on the heat transfer surfaces in the processing equipment causing fouling [2]. Fouling reduces the heat transfer between fluids, affecting the delicate balance of heat integration in crude preheat trains in refineries [3-6]. Fouling also leads to the reduction in cross sectional area for fluid-flow due to the increase in the thickness of the fouling layer requiring additional pumping power [7].
A generalized fouling mechanism is perceived to happen in a three-step process [8]. In the first step, suspended asphaltenes particles from crude oil form as aggregates and undergo chemical reactions in the bulk and/or on the wall and form as soluble precursors. The soluble precursors react to form insoluble foulant species in the second step. Due to the higher surface temperatures, insoluble foulant species undergo physical and chemical changes to form coke deposits on the wall.
Coke formations from asphaltenes cracking are associated with thermal or catalytic reactions [2, 9, 10]. During the process of thermal cracking, asphaltenes become more aromatic and undergo phase separation by breaking of colloidal equilibrium of crude oil which leads to the occurrence of chemical reactions to form as coke [11]. The reactions associated with coke formation due to the thermal/catalytic cracking of asphaltenes are described by poly-condensation reactions. The following reactions represent the simplest form of the reactions associated with asphaltenes cracking [12]:
As + As $\rightarrow$ coke + gas
As + n. Ar $\rightarrow$coke + gas
As + n. olefins $\rightarrow$coke + gas
The rate of coke formation with asphaltenes and/or any other unsaturated hydrocarbons cracking is more intense compared with saturated hydrocarbons [13-15]. This is due to the fact that the saturated hydrocarbons undergo various other reactions before reacting into coke. A wide variety of other reactions might occur with various components of the crude oil. However, the formation of coke is associated mainly through asphaltenes cracking [13].
Coke formation starts near the wall and then propagates towards the center of the pipeline or heat exchanger tube. The coke near the wall was found to be hard and difficult to be removed [16]. As the fouling deposit layer builds up, the thermal efficiency drops and pressure drop increases significantly, the heat exchanger must be shut down and mechanical or chemical cleaning is required to recover unit performance [10]. Frequent cleaning of heat exchangers results in huge economic losses in terms of loss in production, cleaning costs and associated issues. The concerns of fouling can be avoided only through preventing coke from being formed on the heat transfer surfaces.
Over the last decade, the petroleum industries have moved from treating fouling as a chronic problem to one which should be treated and, where possible, eliminated. A general solution adopted to mitigate fouling in the heat exchangers is to increase tube side velocities, thus, wall shear stress increases [17] and hence, decreases the accumulated fouling material [18, 19]. Wall shear stress depends on the velocity gradient near the wall and it is acknowledged that by increasing the fluid-flow velocity, the shear stress increases. Mechanically, wall shear stress can be enhanced by increasing the flow inclination angle. The flow inclination relative to the tube axis of 20 degree or more is equivalent to the increase of flow velocities up-to 2.5 times near the wall [20]. Also, the rotating or swirling flow at the pipe entrance increases the velocity near the wall and consequently the shear stress which reduces the fouling rate on heat transfer surfaces [21]. Studies also reported that, imposing small amplitude sound waves on a turbulent boundary-layer flow will create oscillations and increase the wall shear stress [22]. While the fluids with high tendency of fouling are processed in the heat exchangers, wall shear stress of 50 Pa or above is required to mitigate the fouling [23]. Thus, the effect of wall shear stress needs to be investigated for a better understanding of fouling mitigation efforts.
Computational Fluid Dynamics (CFD) is one of the branches of fluid mechanics that uses numerical methods and algorithms to solve and analyze various problems that involve fluid flow and heat transfer. CFD is an emerging simulation tool for predicting the fluid flow and heat transfer behavior in various industries such as automotive, aerospace, power generation, process industries, etc. [24-27]. Several CFD studies have been performed on the thermal cracking using kinetic modeling of asphaltenes and coke deposition [2, 9, 10, 28-31]. The effects of shear stress, fluid velocity and surface temperature were predicted [10] based on the kinetic model presented by Koseoglu and Phillips [32]. The coke formation in a petrochemical preheater tube due to the thermal cracking process using two-phase gas–liquid flow models has been investigated and reported high concentrations of coke near higher surface temperature regions [30]. A multi-phase CFD model has been developed to predict the phase change and coke deposition by varying the inlet velocities in a straight pipe and reported less coke formation rate for higher velocities [33]. Discrete phase CFD model has been developed to predict the asphaltenes mass depostion from crude oil in a shell and tube heat exchanger [34] and heat exchanger tube [35]. Various parameters such as fluid velocity, shear stress and surface roughness were varied and reported that the asphaltenes mass deposition decreases with an increase in fluid velocity, shear stress and surface roughness.
Being time-dependent in nature, fouling is a process that should be monitored continuously. As such, fouling experiment are time-consuming and often difficult to perform. In view of the above, CFD has been used as one of the predominant approaches to investigate crude oil fouling phenomena. The crude oil fouling process involves momentum transfer, mass transfer, heat transfer, flow turbulence and chemical reactions. The effects of various operating conditions on fouling resistance with crude oil fouling through CFD simulations have not been well explored till date. The present work develops an elaborate CFD methodology to predict the coke deposition rate and fouling resistance in a heat exchanger tube. The effects of shear stress and surface roughness on fouling resistance and rate of coke deposition at different flow velocities have been investigated.
The present paper is divided into five sections. Section two presents the description of the fouling mechanism. Section three presents the CFD methodology to investigate the effects of various operating conditions on fouling resistance and coke deposition rate. The results obtained from the CFD simulations are discussed in section four. The conclusions drawn from this study are summarized in section five.
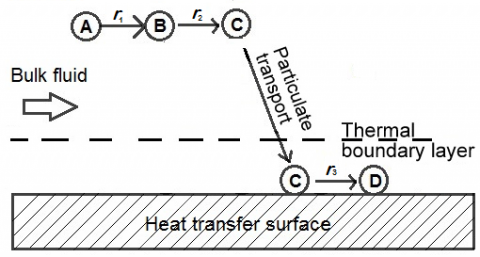
Crude oil fouling mechanisms are still unclear. However, the fouling mechanisms proposed in the literature are accepted to be close to reality. The fouling mechanisms are classified into three possible cases based on the location of fouling precursor formation. The fouling mechanisms follow a three-step reaction fouling process with molecular and/or particulate transport [8] as shown in Figure 1:
Figure 1. Fouling mechanisms [8]
2.1 Precursors generation in the bulk
The soluble precursors are formed in the bulk via one or more reactions among different species in the crude oil before and/or after the crude enters the heat exchanger. A part of these precursors gets transported to the heat transfer surface due to the fluid flow where they further react to form insoluble foulants on the heat transfer surface (Case 1a). The other part of precursors may react in the bulk itself to produce the foulant particles which when transported to the heat transfer surface deposits on the wall (Case 1b). The foulant species either formed on the surface or transported from the bulk is converted to coke due to the high temperature of the surface which is the last step of the coking (fouling) process.
2.2 Precursors generation in the thermal boundary layer
The soluble precursors may also be formed in the thermal boundary layer and subsequently form insoluble foulants on the heat transfer surface (Case 2a) or in the thermal boundary layer itself (Case 2b).
2.3 Precursors generation on the heat transfer surface
The soluble precursors are formed on the heat transfer surface and reacts to form insoluble foulants on the heat transfer surface (Case 3). This mechanism is reported as the simplest fouling mechanism compared with the other cases [36].
The rate at which fouling occurs depends on chemical and physical phenomena such as reaction rates of precursor and foulant formations and mass transport rates of precursors/foulant particles from the bulk of the crude oil to the heat transfer surface. It was observed by other researchers that precursors formed before the crude oil enters the heat exchanger have more significant effect on the rate of fouling [37]. The presence of fouling precursors in the crude oil can be thought of going through instantaneous reactions in the bulk as the crude oil enters the heat exchanger.
The present research assumes that the foulant particles are already present/formed in the bulk of the crude oil (Case 1b) and the fouling process follows a simplified two-step process namely transportation and reaction at the heat transfer surface to form coke as shown in Figure 2. The study aims at understanding the effect of velocity, shear on the wall and wall roughness, all of which affect the net rate of transportation of foulant particles from the bulk to the heat transfer surface. The foulant particles transported to the wall may also be transported back to the bulk due to the turbulence created by the wall shear and surface roughness.
Figure 2. Simplified two-step fouling mechanism
A single horizontal tube in a typical shell and tube heat exchanger is considered in this study, the geometry of which is shown in Figure 3. A three-dimensional model of the heat exchanger tube is developed in CFD to investigate the effect of various operating conditions on crude oil fouling. The basic equations which together form the model of the heat exchanger tube are explained below. The fluid-flow in the heat exchanger domain is governed by incompressible Navier-Stokes equations for mass, momentum and energy. All the governing equations (1) – (9) together form a complete mathematical model of the heat exchanger tube undergoing chemical reaction fouling. The equations are then solved on each node to obtain a numerical solution.
Figure 3. Heat exchanger tube
The basic CFD equations are as follows:
Continuity equation:
$\frac{\partial \rho}{\partial t}+\nabla \cdot \overline{(\rho v)}=0$ (1)
Momentum equation:
$\frac{\partial(\overline{\rho v )}}{\partial t}+\nabla \cdot(\overline{\rho v v )}=-\nabla p+\nabla \cdot(\overline{\tau})+\rho \overline{g}$ (2)
Energy equation:
$\frac{\partial\left(\rho C_{P} T\right)}{\partial t}+\nabla \cdot\left(\rho C_{P} \vec{u} T\right) )=\nabla \cdot(k \Delta T)+H$ (3)
Turbulence model:
In order to analyze the flow fields involving turbulence, a set of Reynolds-Averaged Navier-Stokes (RANS) equations, which are developed by adapting suitable time-averaging techniques on Navier-Stokes equations, are assembled. Several turbulence models such as k-ɛ, k-ω, Reynolds Stress Model (RSM), etc., are available within the RANS equations to approximate the influence of turbulent fluctuations in the flow domain. In k-ɛ turbulence model, the energy in the turbulence is computed from the turbulent kinetic energy (k) and the rate of dissipation of the turbulent kinetic energy is computed from the turbulent dissipation (ɛ). The k-ω turbulence model predicts the turbulence with turbulent kinetic energy (k) with a specific rate of dissipation (ω). RSM is a higher-level turbulence model which is considered for predicting the complex interactions in the turbulence flow fields. The most common turbulence model considered in the field of crude oil fouling is k-ɛ model [9, 28, 31, 33] which assumes that the turbulence is isotropic and requires less computational time for simulation. Therefore, in the present work, the RANS k-ɛ turbulence model is used to analyze the fluid-flow in the heat exchanger tube.
The turbuent kinetic energy, k is described as:
$\frac{\partial k}{\partial t}+\left(u_{i} \cdot \nabla\right) k-\nabla \cdot\left(\frac{\mu_{t}}{\sigma_{k}} \nabla \cdot k\right)=P^{k}-\varepsilon+S_{k}$ (4)
and dissipation rate, ɛ is given by
$\frac{\partial \varepsilon}{\partial t}+\left(u_{i} \cdot \nabla\right) \varepsilon-\nabla \cdot\left(\frac{\mu_{t}}{\sigma_{\varepsilon}} \nabla \varepsilon\right)=\frac{\varepsilon}{k}\left(C_{1} P^{k}-C_{2} \varepsilon\right)+S_{\varepsilon}$ (5)
Species-transport equation:
Petroleum, asphaltenes, non-asphaltenes and coke are considered as species in the crude oil and the transport mechanism is studied through species-transport mathematical tool available in the commercial CFD software Ansys FLUENT version 16.2. Gravitational force is enabled for all the species, which is the main reason for the species to transport from the bulk to the heat transfer surface.
Species transport equation for species j is given as:
$\frac{\partial}{\partial t}\left(\rho \Upsilon_{i}\right)+\nabla \cdot\left(\rho \Upsilon_{i} \overline{u}\right)=-\nabla \cdot \overline{j_{i}}+R_{i}+S_{i}$ (6)
Reaction kinetics equations:
The reaction of C, the foulant particles, to form D, coke is considered in this study. The foulant particles are assumed to be made of precipitated asphaltenes particles and the coking reaction is given by:
2C→D (7)
Further, the coking reaction is assumed to take place on the heat transfer surface only. The reaction rate is given by:
$-r_{3}=k_{1}[a s]$ (8)
the reaction rate constant, k, is given by:
$k_{1}=A \exp \left(\frac{-E}{R T}\right)$ (9)
where, frequency factor (A) is 9.12 x 10¹¹ (s-1) and activation energy (E) is 1.6 x 10⁵ (J/mol).
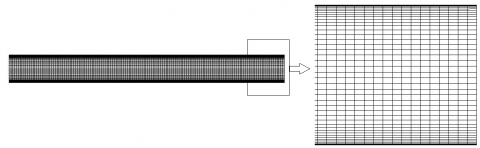
All the governing equations of the fluid flow are then solved numerically by discretizing all the above equations of the model. The discretization process is commonly performed through three methods, namely: (1) finite difference method, (2) finite element method and (3) finite volume method. The most popular is finite volume method and is considered in the present study. The discretized governing equations are solved on a structured mesh generated for the heat exchanger tube as shown in Figure 4.
Figure 4. Heat exchanger tube mesh
The final mesh after the mesh dependence study consists of 0.198 million quadrilateral cells. The choice of very fine mesh near the heat exchanger tube surface was aimed at considering the capability to capture the thin coke deposition layers. The number of mesh elements required to obtain mesh independent simulation results has been determined by performing steady-state simulations on different grids.
Table 1. Operating conditions
|
Description |
Value/condition |
|
Flow velocity (m/s) |
0.14-3.7 |
|
Wall temperature (K) |
397 |
|
Bulk temperature (K) |
358 |
|
Asphaltenes mass fraction |
0.02 |
|
Petroleum and non-asphaltenes mass fraction |
0.98 |
Table 2. Crude oil species properties
|
Parameters |
Petroleum and non-asphaltenes [38] |
Asphaltenes [38] |
Coke [2] |
|||||
|
|
Density (kg/m3) |
860 |
1200 |
900 |
|
|||
|
|
Specific heat (J/kg·K) |
213 |
920 |
1500 |
|
|||
|
|
Thermal conductivity (W/m·K) |
0.120 |
0.75 |
1.5 |
|
|||
The governing equations together with the turbulence model and species-transport equations of the fluid flow will result in a solution with the precise boundary and operating conditions. The common boundary conditions are usually observed in the fluid flow probems are inlets, solid walls, symmetric boundaries, pressure boundary conditions and outflow. At the inlet, fluid enter the heat exchanger domain and therefore, inlet suface is specied with velocity inlet boudanry condition. The outlet surface is specified with outflow boundary condition. The inlet and outlet boundary conditions are specified from the boundary conditions panel available in the commercial CFD software Ansys FLUENT version 16.2. Initially, the wall boundary condition is specified as no-slip and smooth surface wall. Once the coke deposition rate and fouling resistance were calculated, the effects of wall shear and surface roughness on coke deposition rate and fouling resistance are investigated by varying the wall boundary conditions. The operating and boundary conditions of flow through the heat exchanger tube are detailed in Table 1. The properties of crude oil species are given in Table 2.
The simulation methodology followed in this study is shown in flow chart in Figure 5:
Figure 5. Flow chart – simulation methodology
The governing equations for fluid flow, turbulence, heat transfer and chemical reactions are solved through finite volume method. Often times, the governing equations solved with low-order discretization schemes can impair the quality of CFD simulations. Accuracy of the results can be a major problem with first-order schemes particularly for complex naure of fluid flows. As the simulation involves complex crude oil fouling phenomena, the discretization of convective transport terms was performed through a high-order differencing scheme i.e. Quadratic Upstream Interpolation for Convective Kinematics (QUICK) and second-order upwind scheme for momentum, turbulent kinetic energy and dissipation rate. The Second-order upwind schemes are one of the most stable discretization schemes and highly used for CFD simulations involving chemical reactions [9].
Once the heat exchanger tube geometry and mesh are developed, the operating and boundary conditions are specified for mesh dependence study. The chosen mesh was used to perform the non-reacting flow simulation with crude oil species except asphaltenes. The simulation is iterated till the desired convergence criteria of tolerance 1x10⁻⁶ is achieved. Then, the species-transport is activated and the petroleum species are introduced into the bulk-fluid and surface reactions are activated. The reacting flow is simulated for 190 h of flow-time.
The coke particles stick to the heat transfer surface and grow in thickness over a period of time. As the thickness of the coke layer increases, the resistance to heat transfer increases. The fouling resistance is calculated by:
$R_{f}=\frac{1}{U_{d}}-\frac{1}{U_{c}}$ (10)
The process of crude oil fouling through coking reactions is simulated at different wall boundary conditions (shear stress and surface roughness). The simulations were repeated at 0.14, 0.31 and 0.47 m/s flow velocities for Cases 2 – 5 in Table 3 in which the matrix of wall boundary conditions is given.
Table 3. Matrix of wall conditions
|
Case |
Shear Stress |
Surface roughness |
|
1 |
No-slip |
Smooth surface |
|
2 |
0.03 Pa |
Smooth surface |
|
3 |
0.05 Pa |
Smooth surface |
|
4 |
No-slip |
0.03 mm |
|
5 |
No-slip |
0.05 mm |
All the governing equations are numerically computed at thousands of discrete points (computational mesh) in the heat exchanger tube. In this context, the validation of the developed CFD model and the methodology is highly necessary to predict the accuracy of the results with realistic models. Validation of the CFD model provides evidence that the conceptual computational model is computed accurately compared to the reality. The validation of the CFD model is performed by predicting the heat transfer coefficients with crude oil as fluid medium in the heat exchanger tube. Steady state CFD simulations are performed and heat transfer coefficients are evaluated at different flow velocities. The calculated HTC’s from CFD simulations are compared with the existing theoretical heat transfer correlations. The graphical representation of heat transfer coefficients at various crude oil velocities calculated through the CFD simulations and following empirical correlations are shown in Figure 6.
Dittus and Boelter correlation [39]:
$N u=0.023 R e^{0.8} \operatorname{Pr}^{0.3}$ (11)
Colburn correlation [40]:
$N u=0.023 R e^{0.8} P r^{0.4}\left(\frac{\mu}{\mu_{w}}\right)^{0.14}$ (12)
The HTC’s calculated from the simulation results were impressively correlated with the Colburn correlation with maximum 9.81 % deviation. Therefore, the CFD code and the mathematical model can be considered validated.
Figure 6. Heat transfer coefficients vs flow velocity
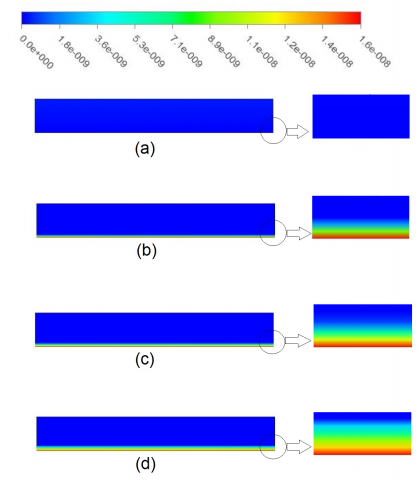
The simulations of Cases 1 to 5 were performed and the results are analyzed. Contours of coke formation on the tube wall at different operation periods for Case 1 at 0.14 m/s fluid velocity are shown in Figure 7. It is observed that the coke thickness on the heat transfer surface increases with time.
Figure 7. Coke deposition contour plot at 0.14 m/s flow velocity with no-slip conditions and smooth surface (Case 1):
(a) at 20.6 h, (b) 90.5 h, (c) 143.6 h, (d) 190 h
The rate of coke deposition and fouling resistance at different flow velocities for Case 1 are shown in Figures 8 and 9 respectively. It is observed that the coke deposition rate and fouling resistance decreases with an increase in flow velocity. This result is very obvious as the flow velocity increases, the particles are carried away by the fluid before they settle by gravity to the heat transfer surface. An increase in the flow velocity is also expected to promote the dislodging of the deposition on the surface through increased shear stress. The increased flow velocity reduces the residence time of the fouling precursors in the heat exchanger, thus, the probability of getting deposited on the heat transfer surface is less. An increased fluid velocity induces turbulence near the wall that decreases the thermal boundary layer thickness leading to higher heat transfer coefficients and reduced temperature difference between the bulk and the surface. The lower temperature difference decreases the thermophoretic force acting on the foulant particles and results in decreased fouling. Therefore, higher fluid velocities will favor less mass deposition and fouling rates.
Figure 8. Coke deposition vs flow velocity at different operation periods with no-slip condition and smooth surface (Case 1)
Figure 9. Fouling resistance after 190 hours on a smooth surface with no slip conditions vs flow velocity (Case 1)
Various experimental studies have been performed to investigate the effects of flow velocities on coke deposition rate and fouling resistance and reported that the deposition rate and fouling resistance decreases with increased flow velocities [41-43]. The present CFD simulation results were also observed to follow the same trend with experimental studies.
4.1 Effect of shear stress
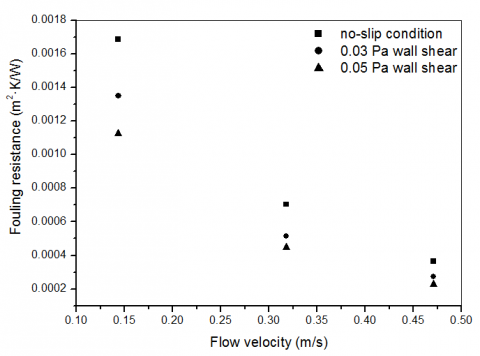
The coke mass deposition contour for 0.14 m/s flow velocity with no slip condition, at 0.03 Pa and 0.05 Pa wall shear stresses are shown in Figure 10. The coke deposition rate and fouling resistance reduces gradually with an increase in shear stress at different flow velocities, as observed from Figures 11 and 12 respectively.
The coke deposition rate (Md) and fouling resistance (Rf) for all simulation runs are summarized in Table 4. The percent decrease in coke deposition rate and fouling resistance as compared to the no-slip conditions with smooth surface are given in Table 5.
Figure 10. Coke mass deposition contour at 190 h with smooth surface and shear stress conditions at 0.14 m/s flow velocity (Cases 2 and 3)
(a) no-slip condition, (b) 0.03 Pa wall shear, (c) 0.05 Pa wall shear
Figure 11. Coke deposition after 190 hours on a smooth surface with shear stress conditions vs flow velocity (Cases 2 and 3)
Figure 12. Fouling resistance after 190 hours on a smooth surface with shear stress conditions vs flow velocity (Cases 2 and 3)
Table 4. Coke deposition rate and fouling resistance for wall shear conditions and smooth surface at different flow velocities
|
Case |
Wall shear (Pa) |
Flow velocity (m/s) |
|||||
|
0.14 |
0.31 |
0.47 |
|||||
|
Md x109 |
Rf x103 |
Md x109 |
Rf x103 |
Md x109 |
Rf x103 |
||
|
kg/m2·s |
m2·K/W |
kg/m2·s |
m2·K/W |
kg/m2·s |
m2·K/W |
||
|
1 |
No-slip |
10.16 |
1.68 |
8.36 |
0.7 |
7.59 |
0.36 |
|
2 |
0.03 |
9.11 |
1.35 |
7.25 |
0.5 |
6.4 |
0.25 |
|
3 |
0.05 |
8.44 |
1.12 |
6.31 |
0.4 |
5.72 |
0.22 |
The formation of coke on the heat transfer surface is higher under low-velocity conditions. Higher velocity and shear stress are expected to promote dislodging of the deposited foulant species on the surface. From the simulation results, it can be concluded that the coke deposition rate and fouling resistance decreases with increase in both flow velocity and wall shear stress.
Table 5. Percentage decrease in coke deposition rate and fouling resistance as compared with no-slip conditions
|
Case |
Wall shear (Pa) |
Flow velocity (m/s) |
|||||
|
0.14 |
0.31 |
0.47 |
|||||
|
% Md |
% Rf |
% Md |
% Rf |
% Md |
% Rf |
||
|
1 |
0.03 |
10.3 |
19.2 |
13.2 |
26.9 |
15.6 |
30.6 |
|
2 |
0.05 |
16.9 |
33.34 |
24.1 |
36.53 |
25.2 |
37.9 |
4.2 Effect of surface roughness
The coke deposition rate and fouling resistance reduces gradually with an increase in surface roughness at different flow velocities, as observed from Figures 13 and 14 respectively.
The coke deposition rate (Md) and fouling resistance (Rf) for all simulation runs are summarized in Table 6. The percent decrease in coke deposition rate and fouling resistance as compared to the smooth wall at no-slip condition are given in Table 7.
The surface roughness plays an important role on fouling resistance under turbulent flows. The rough surface causes a disruption of the viscous sublayer that increases the turbulence level near the heat transfer surface and thus, increases the heat transfer coefficients. As discussed, the increased heat transfer coefficients will result in decreased fouling rates. The surface roughness also increases the shear force near the wall, thus, helps in inducing momentum to the deposits on the heat transfer wall. It can be concluded from the simulation results that the coke deposition rate and fouling resistance decreases with increase in surface roughness.
Figure 13. Coke deposition after 190 hours at no-slip conditions with roughness conditions vs flow velocity (Cases 4 and 5)
Figure 14. Fouling resistance after 190 hours at no-slip conditions with roughness conditions vs flow velocity (Cases 4 and 5)
Table 6. Coke deposition rate and fouling resistance for surface roughness conditions at no-slip condition at different flow velocities
|
Case |
Surface roughness (mm) |
Flow velocity (m/s) |
|||||
|
0.14 |
0.31 |
0.47 |
|||||
|
Md x109 |
Rf x103 |
Md x109 |
Rf x103 |
Md x109 |
Rf x103 |
||
|
kg/m2·s |
m2·K/W |
kg/m2·s |
m2·K/W |
kg/m2·s |
m2·K/W |
||
|
1 |
0 |
10.16 |
1.68 |
8.36 |
0.7 |
7.59 |
0.36 |
|
2 |
0.03 |
8.99 |
1.24 |
7.09 |
0.48 |
6.16 |
0.24 |
|
3 |
0.05 |
8.21 |
0.99 |
6.18 |
0.41 |
5.09 |
0.20 |
Table 7. Percentage decrease in coke deposition rate and fouling resistance as compared with smooth surface
|
Case |
Surface roughness (mm) |
Flow velocity (m/s) |
|||||
|
0.14 |
0.31 |
0.47 |
|||||
|
% Md |
% Rf |
% Md |
% Rf |
% Md |
% Rf |
||
|
1 |
0.03 |
11.48 |
26.00 |
15.17 |
30.76 |
18.84 |
33.10 |
|
2 |
0.05 |
19.18 |
40.95 |
26.07 |
41.15 |
32.93 |
43.12 |
A three-dimensional Computational Fluid Dynamics study was performed to investigate the effect of flow velocity, shear stress and surface roughness on coke deposition rate and fouling resistance in a heat exchanger tube. The fouling resistance and coke deposition rate at various operating conditions are studied through species-transport CFD approach at different time-steps. Flow velocity, wall shear stress and surface roughness are found to have a high impact on mitigation of fouling. The thermal efficiency of the heat exchanger tube is enhanced though increasing the fluid velocity, wall shear and surface roughness, which minimizes the fouling resistance. Further, the developed CFD methodology can be employed to understand the coke mass deposition in an industrial shell and tube heat exchanger.
Authors of the paper greatly acknowledge the support and facilities provided by Crude Oil Fouling Research Centre (CROFREC), Universiti Teknologi PETRONAS.
|
A |
frequency factor, (1/s) |
|
Ar |
aromatics |
|
As |
asphaltenes |
|
C1 |
empirical constant, 1.44 |
|
C2 |
empirical constant, 1.92 |
|
Cp |
specific heat, J/kg·K |
|
D |
mass diffusion coefficient, m2/s |
|
E |
rate of deformation, in eqs. (4 and 5) |
|
E |
activation energy, J/mol, in eq. (9) |
|
G |
gravitational acceleration, m/s2 |
|
H |
source term |
|
J |
diffusion flux of species |
|
k |
thermal conductivity, W/m·K in eq. (3) |
|
k |
turbulent kinetic energy, J/kg in eq. (4) |
|
k1 |
reaction rate constant |
|
Md |
mass deposition rate, kg/m2·s |
|
P |
pressure, Pa |
|
Pr |
Prandtl number |
|
Pk |
shear production of turbulence, Pa/s |
|
R |
rate of production of species in eq. (6) |
|
R |
universal gas constant, J/mol·K |
|
Re |
Reynolds number |
|
Rf |
fouling resistance, m2·K/W |
|
r |
intrinsic reaction rate of species |
|
S |
rate of creation |
|
T |
temperature, K |
|
U |
overall heat transfer coefficient, W/m2·K |
|
v |
velocity, m/s |
|
Greek symbols |
|
|
ρ |
density, kg/m3 |
|
τ |
shear stress, Pa |
|
ϒ |
mass fraction of species |
|
ɛ |
dissipation rate, J/kg·s |
|
ω |
specific dissipation rate, J/kg·s |
|
µ |
viscosity, kg/m·s |
|
σk |
empirical constant, 1.00 |
|
σ€ |
empirical constant, 1.30 |
|
Subscripts |
|
|
eff |
effective |
|
j |
species |
|
s |
surface |
|
c |
clean tube |
|
d |
dirty tube |
|
w |
wall |
[1] Chandio Z.A., Ramasamy M., Mukhtar H.B. (2015). Temperature effects on solubility of asphaltenes in crude oils, Chemical Engineering Research and Design, Vol. 94, pp. 573-583. DOI: 10.1016/j.cherd.2014.09.018
[2] Bayat M., Aminian J., Bazmi M., Shahhosseini S., Sharifi K. (2012). CFD modeling of fouling in crude oil pre-heaters, Energy Conversion and Management, Vol. 64, pp. 344-350. DOI: 10.1016/j. enconman.2012.05.003
[3] Ho T.C. (2016). A study of crude oil fouling propensity, International Journal of Heat and Mass Transfer, Vol. 95, pp. 62-68. DOI: 10.1016/j.ijheat masstransfer.2015.11.086
[4] Yang J., Serratos M.G.J., Fari-Arole D.S., Muller E.A., Matar O.K. (2015). Crude oil fouling: fluid dynamics, reactions and phase change, Procedia IUTAM, Vol. 15, pp. 186-193. DOI: 10.1016/j. piutam.2015.04.026
[5] Nasr M.R.J., Givi M.M. (2006). Modeling of crude oil fouling in preheat exchangers of refinery distillation units, Applied Thermal Engineering, Vol. 26, pp. 1572-1577. DOI: 10.1016/j.Applthermaleng .2005.12.001
[6] Mozdianfard M.R., Behranvand E. (2013). A field study of fouling in CDU preheaters at Esfahan refinery, Applied Thermal Engineering, Vol. 50, pp. 908-917. DOI: 10.1016/j.applthermaleng.2012.08. 025
[7] Bohnet M. (1987). Fouling of heat transfer surfaces, Chemical Engineering & Technology, Vol. 10, pp. 113-125. DOI: 10.1002/ceat.270100115
[8] Coletti F., Crittenden B.D., Macchietto S. (2014). Basic science of the fouling process, Crude Oil Fouling, Elsevier, Oxford, U.K., pp. 23-50. DOI: 10.1016/ B978-0-12-801256-7.00002-6
[9] Emani S., Ramasamy M., Shaari K.Z.B.K. (2016). Effect of shear stress on crude oil fouling in a heat exchanger tube through CFD simulations, Procedia Engineering, Vol. 148, pp. 1058-1065. DOI: 10.1016/j.proeng.2016.06.592
[10] Haghshenasfard M., Hooman K. (2015). CFD modeling of asphaltene deposition rate from crude oil, Journal of Petroleum Science and Engineering, Vol. 128, pp. 24-32. DOI: 10.1016/j.petrol.2015.01. 037
[11] Sawarkar A., Pandit A., Joshi J. (2007). Studies in coking of Arabian mix vacuum residue, Chemical Engineering Research and Design, Vol. 85, pp. 481-491. DOI: 10.1205/cherd06159
[12] Simanzhenkov V., Idem R. (2003). Crude Oil Chemistry, CRC Press. DOI: 10.1201/9780203014 042
[13] Ancheyta J., Trejo F., Rana M.S. (2010). Asphaltenes: Chemical Transformation during Hydroprocessing of Heavy Oils, CRC Press. DOI: 10. 1201/9781420066319
[14] Jambor B., Hajekova E. (2015). Formation of coke deposits and coke inhibition methods during steam cracking, Petroleum & Coal, Vol. 57, pp. 143-153.
[15] Ancheyta J. (2016). Deactivation of Heavy Oil Hydroprocessing Catalysts: Fundamentals and Modeling, John Wiley & Sons. DOI: 10.1002/ 9781118769638
[16] Ancheyta J. (2013). Modeling of Processes and Reactors for Upgrading of Heavy Petroleum, CRC Press. DOI: 10.1201/b13879
[17] Pichitra U. (2009). Numerical simulation and wall shear stress analysis of pulsed flow in plate heat exchanger, PhD Thesis, Suranaree University of Technology.
[18] Caro C.G. (2009). Discovery of the role of wall shear in atherosclerosis, Arteriosclerosis, Thrombosis, and Vascular Biology, Vol. 29, pp. 158-161. DOI: 10.1161/ATVBAHA.108.166736
[19] Coletti F., Diaz-Bejarano E., Martinez J., Macchietto S. (2015). Heat exchanger design with high shear stress: Reducing fouling or throughput, International Conference on Heat Exchanger Fouling and Cleaning. Enfield (Ireland).
[20] Bremhorst K. (1997). Wall pressure and effective wall shear stresses in heat exchanger tube inlets with application to erosion-corrosion, Journal of Fluids Engineering. DOI: 10.1115/1.2819522
[21] Palsson H., Beaubert F., Lalot S. (2013). Inducing swirling flow in heat exchanger pipes for reduced fouling rate, Heat Transfer Engineering, Vol. 34, pp. 761-768. DOI: 10.1080/01457632.2012.741503
[22] Ronneberger D., Ahrens C. (1977). Wall shear stress caused by small amplitude perturbations of turbulent boundary-layer flow: An experimental investigation, Journal of Fluid Mechanics, Vol. 83, pp. 433-464. DOI: 10.1017/S0022112077001281
[23] Hjalmars A. (2014). Biofouling on plate heat exchangers and the impact of advanced oxidizing technology and ultrasound, Master of Science Thesis, Analytical Chemistry KTH.
[24] Lin G., Dan B., Wen Z., Xinduan W. (2017). Evaluation of numerical simulation accuracy for two-ways mixed flow drip irrigation emmitter based on CFD, International Journal of Heat and Technology, Vol. 35, No. 2, pp. 384-392. DOI: 10.18280/ijht.350222
[25] Ramponi R., Blocken B. (2012). CFD simulation of cross-ventilation for a generic isolated building: Impact of computational parameters, Building and Environment, Vol. 53, pp. 34-48. DOI: 10.1016/j. buildenv.2012.01.004
[26] Kaliakatsos D., Cucumo M., Ferraro V., Mele M., Gallloro A., Accorinti F. (2014). CFD analysis of a pipe equipped with twisted tape, International Journal of Heat and Technology, Vol. 34, No. 2, pp. 172-180. DOI: 10.1016/j. jngse.2014.10.001
[27] Galindo J., Fajardo P., Navarro R., Garcia-Cuevas L.M. (2013). Characterization of a radial turbocharger turbine in pulsating flow by means of CFD and its application to engine modeling, Applied Energy, Vol. 103, pp. 116-127. DOI: 10.1016/j. apenergy.2012.09.013
[28] Souza B., Matos E., Guirardello R., Nunhez J. (2006). Predicting coke formation due to thermal cracking inside tubes of petrochemical fired heaters using a fast CFD formulation, Journal of Petroleum Science and Engineering, Vol. 51, pp. 138-148. DOI: 10.1016/j.petrol.2005.11.013
[29] Mahulkar A.V., Heynderickx G.J., Marin G.B. (2012). Simulation of coking in convection section of steam cracker, Chemical Engineering Transaction, Vol. 29, pp. 1375-1380. DOI: 10.330 3/CET1229230
[30] Fontoura D., Matos E., Nunhez J. (2013). A three-dimensional two-phase flow model with phase change inside a tube of petrochemical pre-heaters, Fuel, Vol. 110, pp. 196-203. DOI: 10.1016/j.fuel.2012.09.065
[31] Li X.G., Zhang L.H., Zhang R.Y., Sun Y.L., Jiang B., Luo M.F., Li X.G. (2015) CFD modeling of phase change and coke formation in petroleum refining heaters, Fuel Processing Technology, Vol. 134, pp. 18-25. DOI: 10.1016/j.fuproc.2015.03.005
[32] Koseoglu R.O., Phillips C.R. (1987). Kinetics of non-catalytic hydrocracking of Athabasca bitumen, Fuel, Vol. 66, pp. 741-748. DOI: 10.1016/00162361 (87)90117-7
[33] Fouzia D., Park T.S. (2016). Effect of inlet velocity on the crude oil coking and gas phase formation in a straight pipe, Journal of Applied Mathematics and Physics, Vol. 5, pp. 17-25. DOI: 10.4236/ jamp.2017.51003
[34] Emani S., Ramasamy M., Shaari K.Z.K. (2017). CFD modelling of shell-side asphaltenes deposition in a shell and tube heat exchanger, AIP Conference Proceedings, Vol. 1859, pp. 20118:1-7. DOI: 10. 1063/1.4990271
[35] Emani S., Ramasamy M., Shaari K.Z.K. (2017). Transportation and adhesion of asphaltenes in a heat exchanger tube through CFD simulations, AIP Conference Proceedings, Vol. 1859, pp. 20119:1-7. DOI: 10.1063/1.4990272
[36] Bott T.R. (1995). Fouling of Heat Exchangers, Elsevier. DOI: 10.1002/cite.330680323
[37] Panchal C., Watkinson A. (1994). Development of an analytical model for organic-fluid fouling, Argonne National Lab., IL (United States). DOI: 10.2172/74132
[38] Mirzayi B., Mousavi Dehghani S.A., Chakan M.B. (2013). Modeling of asphaltene deposition in pipelines, Journal of Petroleum Science and Technology, Vol. 3, pp. 15-23. DOI: 10.22078/ jpst.2013.302
[39] Dittus F., Boelter L. (1930). Heat Transfer in Automobile Radiators of the Tubular Type, University of California Publications in Engineering: University of California, University of California Press.
[40] Colburn A.P. (1993). A method for correlating forced convection heat transfer data and a comparison with fluid friction, Trans. AIChE, Vol. 29, pp. 174-210.
[41] Scarborough C.E., Cherrington D.C., Diener R., Golan L.P. (1979). Coking of crude oil at high heat flux levels, Chemical Engineering Progress, Vol 75, No. 7, pp. 41-46.
[42] Saleh Z.S., Sheikholeslami R., Watkinson A.P. (2005). Fouling characteristics of a light Australian crude oil, Heat Transfer Engineering, Vol. 26, No. 1, pp. 15-22. DOI: 10.1080/01457630590890049
[43] Watkinson A.P. (2011). Deposition from crude oils in heat exchangers, Heat Transfer Engineering, Vol. 28, No. 3, pp. 177-184. DOI: 10.1080/01457630601064 413