OPEN ACCESS
This paper aims to identify the model that can accurately predict the liquid holdup under specific conditions. For this purpose, 431 sets of test data were obtained from a 60mm-diameter pipe and a 75mm-diameter pipe, and six existing models were evaluated against these data with the pipes in the horizontal direction or at small inclined angles. Three statistical parameters were introduced to select the best-performing model. The test data were also adopted to explore the effects of pipe diameter, gas-liquid ratio, liquid types and pipe inclination on liquid holdup. It is concluded that he modified-Hughmark correlation boasted the best accuracy for air-water mixture in the horizontal direction and at small inclination angles, while the Beggs-Brill model outperformed the other models for white oil-air flow; the increase in liquid holdup is proportional to pipe diameter at the same gas-liquid ratio; as long as the gas-liquid ratio is lower than 100, the inclined angle in the range of 0~30° had little effect on liquid holdup, and the effect gradually decreased with the increase in the gas-liquid ratio; the liquid holdup is positively correlated with the viscosity and the content of heavy components, and negatively with density; the gas-liquid ratio had a great impact on liquid holdup. The research findings provide a valuable reference for studies in similar fields.
liquid holdup, liquid-gas two-phase flow, horizontal and inclined pipe, gas-liquid ratio, pipe diameter, liquid type, pipe inclination
Multiphase flow, a commonplace phenomenon in pipes, has attracted much attention from the petroleum industry thanks to its immense economic benefit. The existing research has been concentrated on the effect of the actual working conditions on such parameters as flow pattern, pressure gradient and liquid holdup. The pressure gradient prediction for multiphase flow Among them, the liquid holdup is essential to the design of multiphase flow pipe, due to its close correlation with the pressure gradient of the pipe, which is an important theoretical foundation for the design and analysis of oil and gas wells [1-2] .
This is particularly true to gas-liquid two-phase flow pipe. For this type of pipe, liquid holdup reflects the amount of effusion of the pipe, an existential threat to transmission reliability. The effusion not only drags down the gas transmission efficiency, but also pushes up the risk of pipe corrosion [3]. Therefore, it is of practical significance to explore the influencing factors of liquid holdup.
In most oil and gas gathering stations and the plain regions, most pipes are laid in the horizontal or near-horizontal direction [4]. In this case, the liquid holdup varies with the gas-liquid ratio, pipe diameter, liquid type and pipe inclination angle [5].
Since Lockhart and Martinelli (1949) established the first empirical liquid holdup equation [6], many scholars have proposed classical correlations for liquid holdup. For example, Hughmark (1962) tested the mixture of different liquid mediums and the air in vertical pipes (ID: 16mm~63.5mm), calculated liquid holdup in light of the test results, and applied the calculation method to horizontal pipes [7]. Hughmark’s method was modified by Garcia in 2005 [8].
In 1967, Guzhov et al. developed the correlation for liquid holdup based on the data for liquid-gas mixture in pipes with an inclination angle between -9° to 9° [9]. Six year later, Beggs and Brill studied two-phase flow in pipes tilted at -90° ~ +90°, presented the correlation between liquid holdup and pressure drop, and derived the correlation for different pipe inclination angles based on that for horizontal pipes [10].
In the past decades, many other scholars, such as Eaton et al. [11], Abdul-Majeed [12], Minami-Brill [13], Ansari [14] and Xiao [15], have developed liquid holdup correlations for implementation in the petroleum industry. Despite these achievements, these liquid holdup correlations fail to realize desirable accuracy across different experimental or field conditions [16]-[17]. This conclusion is drawn through numerous evaluations.
In 1964, Dukler evaluated the correlations of Hoogeendoom, Hughmark and Lockhart-Martinelli with the AGA/API database, and discovered that even the best-performing Hughmark’s correlation cannot achieve the desired accuracy [16].
In 1975, Vohra tested the correlations of Beggs-Brill, Dukler, Eaton et al., Guzhov, Hughmark and Lockhart-Martinelli. The test data include 58 groups from Beggs’ research on a horizontal pipe and 238 groups from that of Eaton et al. The results show that the correlation of Eaton et al. enjoyed the highest accuracy with an average percent error (APE) of -5.9%, followed by the Beggs-Brill model (18.9%) [17]. This is because most of the data came from Eaton et al.
In the same year, Mandhane et al. assessed the liquid holdup correlation presented by Beggs-Brill, Eaton et al. and Hughmark based on 2,685 measured values of liquid holdup in horizontal gas-liquid two-phase flow, and recommended a calculation method in view of the flow pattern [18] (Table 1).
Table 1. Liquid holdup calculation method recommended by Mandhane et al.
|
Flow Pattern |
Recommended Method |
The Mean-Percentage Absolute Error |
The Mean-Percentage Error |
|
Bubble Flow, Elongated Bubble Flow |
Hughmark |
7.2% |
1.8% |
|
Stratified Flow |
Agrawal et al. |
34.8% |
26.8% |
|
Wavy Flow |
Jorah |
45.8% |
30.2% |
|
Slug Flow |
Hughmark |
62.2% |
-0.2% |
|
Annular Flow, Mist Flow |
Lockhart-Martinelli |
6.0% |
0.4% |
|
Dispersed Bubble |
Beggs-Brill |
29.2% |
5.7% |
In 1993, Abdul-Majeed made some improvements to the Beggs-Brill correlation, and compared the improved method with 11 related correlations (e.g. Eaton et al, Minami-Brill Ⅰ and Ⅱ) under horizontal, inclined and vertical conditions. The scholar proved that the modified method had the smallest APE of 6.8% [19].
Based on the data from various horizontal pipe experiments, Garcia et al. (2005) created a theoretical model for liquid holdup prediction in a horizontal pipe, and verified that the model is more accurate than 25 existing methods [20]
In 2008, Cheng et al. compared the Hughmark correlation and Garcia’s modified-Hughmark correlation based on the test data from the National Engineering Laboratory for Pipeline Safety in China University of Petroleum (Beijing). They recommended to forecast the liquid holdup in horizontal pipes with Garcia’s modified model [21].
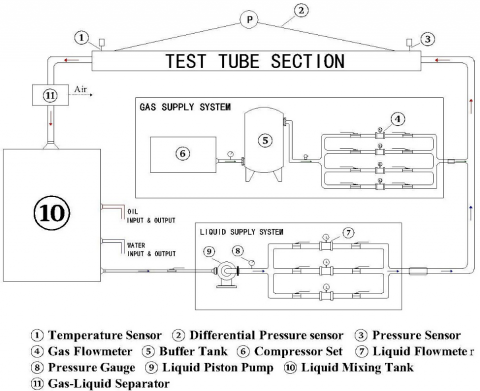
The experiment was carried out in the Laboratiry of Multiphase Pipe Flow, Gas Lift Innovation Center, China National Petroleum Corp. The laboratory supports the dynamic analysis of single-phase flow, gas-liquid two-phase flow and oil-gas-water three-phase flow under different inclination angles (from horizontal to vertical), diameters and temperatures [22].
Figure 1. The test platform
As shown in Figure 1, the test platform consists of nine parts, including but not limited to a wellbore, an oil-water steady flow system, a gas steady flow system and a cooling water system. The platform has a gas flow metering module (accuracy: ±1%), a liquid flow metering module (accuracy: ±0.3%) and some piston metering devices. The test pipes are 40mm, 60mm and 75mm in diameter. During the test, the flow pattern was observed and recorded through a 7m-long transparent heat-resistant and high-voltage-resistance pipe section. The pipe section is installed with high-precision sensors of flow, moisture content, pressure, pressure difference and temperature, in addition to a high-speed camera system. The central control system monitors the temperature, liquid level and stirring device in the mixing tank, as well as the pressure, temperature, pressure gradient and velocity of the liquid and gas in the test section. It also controls the closing valves in the test section[23].
According to the test requirements, white oil or water was selected as the liquid phase input of the oil-water mixing tank. The input was pressurized by the liquid pump, stabilized by the regulator and measured. Then, the liquid was mixed with the air from the compressor unit before entering the pipe section. Finally, the gas was separated from the mixture in the gas-liquid separator, and the liquid returned to the mixing tank to complete a cycle.
The liquid inflow was adjusted by the power of the liquid pump and the opening of the regulation valve. The air inflow was adjusted in the same manner. The average liquid holdup was measured in an 8.65m-long QCV pipe section.
The test medium and flow conditions are listed in Table 20.
Table 2. Test medium and flow conditions
|
Diameter(mm) |
Angle (°) |
Angle (°) |
liquid viscosity (cp) |
Liquid volume flow (m³/h) |
Air volume flow (m³/h) |
Temperature (℃) |
|
60 |
0,15,30 |
0,15,30 |
1.2 |
6.25~20 |
200~2000 |
8~14 |
|
0 |
10~11 |
0.62~2.1 |
30~600 |
21~24 |
||
|
75 |
0 |
0,15, 30 |
1.2 |
6.25~20 |
200~2000 |
7~9.5 |
|
0,15, 30 |
Angle (°) |
10~11 |
0.62~2.1 |
30~600 |
28~29 |
Overall, the test was designed such that the effect of pipe diameter, liquid type and inclination angle can be easily investigated. The liquid holdups under different conditions were obtained for further analysis.
4.1 Evaluation of liquid holdup correlations based on air-water mixture
The six most popular models, including Beggs-Brill, Mukherjee-Brill, Eaton et al., modified-Hughmark, Minami-Brill I and Minami-Brill II, were evaluated against 261 sets of test data on air-water mixture at the inclination angles of 0°, 15° and 30°.
To predict the liquid holdup at the varied inclinations, the Beggs-Brill inclination modifications were applied to the Eaton et al. and the modified-Hughmark correlations.
The accuracy of each method was tested by three statistical parameters: the average relative error ε1, the absolute relative average error ε2 and the standard deviation of relative error ε3:
$e_{i}=\frac{\left(H_{L}\right)_{i p r e}-\left(H_{L}\right)_{i e x p}}{\left(H_{L}\right)_{i e x p}} \times 100 \%$ (1)
$\varepsilon_{1}=\frac{1}{N} \sum_{i=1}^{N}\left(e_{i}\right)$ (2)
$\varepsilon_{2}=\frac{1}{N} \sum_{i=1}^{N}\left|e_{i}\right|$ (3)
$\varepsilon_{3}=\sqrt{\frac{\sum_{i=1}^{N}\left(e_{i}-\varepsilon_{1}\right)^{2}}{N-1}}$ (4)
The average relative error ε1 reflects the difference between the predicted value and the measured value. A positive value indicates over-prediction and the inverse is also true. However, the true average error might be concealed as the individual errors could offset each other in the summation process. That is why the absolute average relative error ε2 was introduced. The standard deviation of relative error ε3 reveals the degree of dispersion between the predicted value and the measured value. The verification results are shown in Table 3.
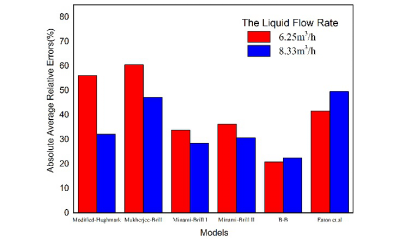
Figure 2. Accuracy of the existing models at liquid flow rates of 6.25 m³/h and 8.33 m³/h
From Table 3, it can be seen that the modified-Hughmark model outperformed the other models with the lowest absolute average relative errors at 0°, 15° and 30° for the 60mm-diameter pipe, while Minami-Brill I correlation boasted the best accuracy for the 75mm-diameter pipe. Except for these two models, the other four models underwent significant increases in liquid holdup prediction errors with the expansion of the pipe diameter. When the liquid flow rate grew from 6.25m3/h to 8.33m3/h, Mukherjee-Brill, Minami I, Minami II and modified-Hughmark correlations all enjoyed better accuracy under horizontal and inclined conditions (Figure 2). Therefore, the accuracy of liquid holdup correlation is yet to be improved at low liquid flow rates. It is also observed that the accuracy of Beggs-Brill model and Eaton et al. model degenerated with the increase in liquid flow rate. The error difference was more pronounced in Eaton et al. model, indicating the need for improvement at high liquid flow rates.
Table 3. Verification results of the six models based on air-water mixture
|
Models |
Error types |
Errors (%) |
|||
|
Pipe Diameter ID=60mm |
Pipe Diameter ID=75mm |
||||
|
0° |
15° |
30° |
0° |
||
|
Beggs-Brill |
ε1 |
- 14.443 |
- 23.551 |
- 19.433 |
- 53.434 |
|
ε2 |
28.830 |
30.702 |
29.702 |
57.257 |
|
|
ε3 |
4.065 |
3.166 |
3.706 |
0.125 |
|
|
Mukherjee-Brill |
ε1 |
- 44.414 |
- 33.019 |
- 29.619 |
- 49.366 |
|
ε2 |
44.414 |
33.019 |
29.670 |
49.366 |
|
|
ε3 |
1.447 |
1.520 |
1.770 |
1.625 |
|
|
Eaton et al |
ε1 |
- 60.558 |
- 23.396 |
- 28.351 |
- 64.701 |
|
ε2 |
60.558 |
40.572 |
45.417 |
64.701 |
|
|
ε3 |
0.932 |
6.601 |
8.315 |
0.793 |
|
|
Modified - Hughmark |
ε1 |
5.424 |
- 10.382 |
- 20.021 |
1.208 |
|
ε2 |
20.065 |
20.604 |
25.275 |
22.386 |
|
|
ε3 |
3.128 |
2.351 |
1.521 |
3.492 |
|
|
Minami-Brill Ⅰ |
ε1 |
- 20.511 |
- 19.554 |
- 21.844 |
- 27.692 |
|
ε2 |
24.400 |
26.144 |
27.018 |
20.821 |
|
|
ε3 |
2.103 |
2.771 |
2.36 |
1.710 |
|
|
Minami-Brill Ⅱ |
ε1 |
-17.511 |
- 16.628 |
-19.454 |
- 29.060 |
|
ε2 |
24.098 |
25.761 |
26.522 |
29.578 |
|
|
ε3 |
2.623 |
3.314 |
2.978 |
1.929 |
|
4.2 Evaluation of liquid holdup correlations based on air-oil mixture
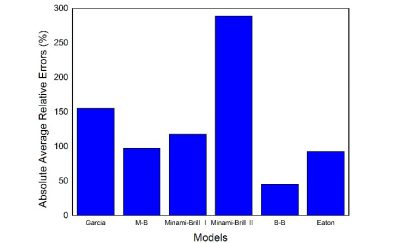
The six models were also tested with 170 sets of data on air-white oil two-phase flow. According to the absolute average relative errors, all models other than the Beggs and Brill model exceeded 100% in terms of the error (Figure 3).
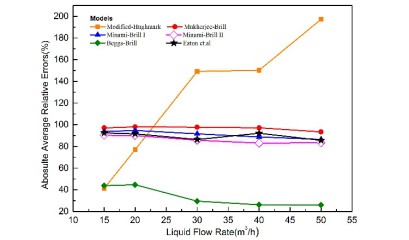
As shown in Figure 4, the absolute average relative errors of the modified-Hughmark model rocketed up with the increase in liquid flow rate, while the accuracy of Beggs-Brill correlation was enhanced when the liquid flow rate climbed up from 15m³/h to 30m³/h. Comparing Figure 3 and Figure 4, it is clear that the Beggs-Brill model outshined the other correlations for the white oil-air two phase flow. The statistical errors of liquid holdup by this method are shown in Table 4. It can be seen that the accuracy of Beggs-Brill correlation under the horizontal condition differed greatly from that under the inclined condition. Meanwhile, when the predicted liquid holdups for water-air flow (Table 3) were contrasted with those of white oil-air flow (Table 4), the model was subject to less error for the inclined pipe. Furthermore, the model was less accurate for the 75mm-diameter pipe than the 60mm-diameter pipe at all inclination angles.
To sum up, the modified-Hughmark model performs well in predicting liquid holdup of water-air two-phase flow in the horizontal direction and at small inclination angles (0~30°), while the Beggs-Brill correlation is applicable to the cases that the measurement accuracy is inadequate for the physical properties of the liquid.
Figure 3. Absolute average relative errors of the existing models
Figure 4. Absolute average relative errors of the existing models at different liquid flow rates
Table 4. Statistical errors of liquid holdup by Beggs-Brill method
|
|
Error types |
Errors |
|||||
|
Pipe Diameter ID=60mm |
Pipe Diameter ID=75mm |
||||||
|
0° |
15° |
30° |
0° |
15° |
30° |
||
|
Beggs-Brill |
ε1 |
-38.741 |
-28.134 |
-8.7179 |
-63.972 |
-38.711 |
-27.999 |
|
ε2 |
53.390 |
36.657 |
28.8495 |
62.016 |
37.021 |
41.982 |
|
|
ε3 |
9.446 |
4.5499 |
5.52790 |
1.525 |
2.607 |
7.7427 |
|
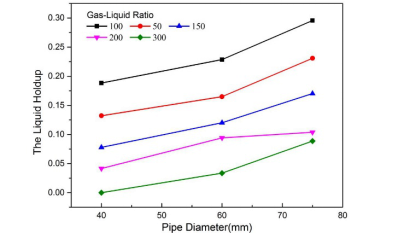
4.3 Effect of pipe diameter
Figure 5. Measured liquid holdup at different pipe diameters and gas-liquid ratios
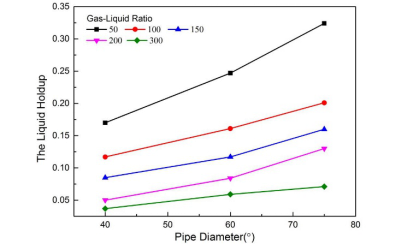
Figure 6. Measured liquid holdup at different pipe diameters and gas-liquid ratios at the inclination angle of 15°
Figure 7. Measured liquid holdup at different pipe diameters and gas-liquid ratios at the inclination angle of 30°
In this section, three different inner diameters (40mm, 60mm and 75mm) of the pipe were selected to investigate the effect of pipe diameter on liquid holdup. As shown in Figure 5, the liquid holdup is positively correlated with the pipe diameter at the same gas-liquid ratio. This means the liquid flow area increases with the diameter, and occupies a greater portion in the pipe section. In addition, with the increase of gas-liquid ratio, the influence of pipe diameter on liquid holdup was rather small at the same liquid flow rate. As the gas picked up speed, the liquid carrying capacity increased, and the liquid holdup at each pipe diameter gradually moved to zero.
Similar patterns were observed in the tests at the inclination angles of 15° and 30° (Figures 6 and 7). Therefore, a smaller pipe diameter or higher gas-liquid ratio is recommended to reduce liquid holdup in gas transmission pipe and to balance the throughput and flow rate.
4.4 Effect of liquid medium
Before the test on the effect of liquid medium, a theoretical analysis was conducted on the assumption that the physical properties of the liquid medium vary independently. The analysis was made in reference to the modified-Hughmark correlation. According to the correlation, Equations (5)~(10) are true:
$H_{L}=1-K \frac{U_{s g}}{U_{s g}+U_{s l}}$ (5)
$K=0.1746-0.1301(\ln Z)+0.7508(\ln Z)^{2}-0.4308(\ln Z)^{3}$$+0.09553(\ln Z)^{4}-0.007452(\ln Z)^{5}$ (6)
$Z=\frac{R e^{1 / 6} F r^{1 / 8}}{\lambda_{L}^{1 / 4}}$ (7)
$F r=\frac{\left(U_{s g}+U_{s l}\right)^{2}}{g D}$ (8)
$R e=\frac{\left(\rho_{g} U_{s g}+\rho_{l} U_{s l}\right) D}{\lambda_{L} \mu_{L}+\left(1-\lambda_{L}\right) \mu_{g}}$ (9)
$\lambda_{L}=\frac{U_{s g}}{U_{s g}+U_{s l}}$ (10)
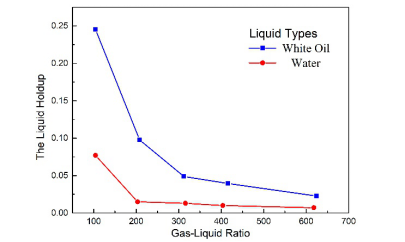
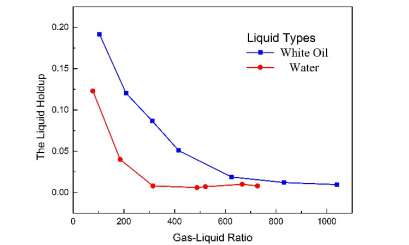
Equation (6) increases monotonically when the value of ln(Z) is greater than 1. According to the test data, the values of ln(Z) in this research always exceed 1. Following this equation, any increase in viscosity will lead to the decline in Reynolds number, provided that all the other parameters are constant. In this scenario, the Z in Equation (7) and K in Equation (6) will also decrease. As can be seen from Equation (5), the liquid holdup will grow in magnitude, revealing that viscosity is proportional to liquid holdup. Diffusion is retarded by an increase in viscosity ratio at a fixed fluidity for the dispersed phase[24]. It is also deduced that density is negatively correlated with liquid holdup. Moreover, the liquid holdup in the pipe will increase with the proportion of heavy components [25]. Under the same gas-liquid volume flow, it is expected that liquid holdup will be relatively high if the liquid medium has a small density, high viscosity and high content of heavy components. According to the test results in Figure 8, it is clear that the white oil-air two-phase flow had a higher liquid holdup than the water-air mixture under the same gas-liquid volume flow. Since the former has a smaller density, higher viscosity and higher content of heavy components than the latter, the test results are consistent with the predicted results.
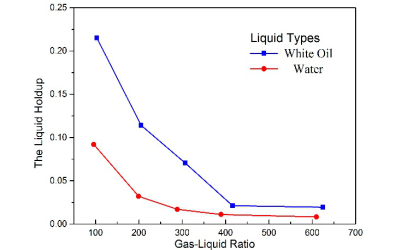
Then, the relationship between the gas-liquid ratio and the liquid holdup at the inclined angle of 15° was compared with that at 30°. The comparison shows that the liquid holdups varied in a similar pattern with those for the horizontal pipe at the same liquid flow conditions (Figure 9 and Figure 10).
Figure 8. Measured liquid holdups at different gas-liquid ratios for white oil-air two-phase flow and water-air mixture in the horizontal pipe
Figure 9. Measured liquid holdups at different gas-liquid ratios for white oil-air two-phase flow and water-air mixture in a pipe with the inclined angle of 15°
Figure 10. Measured liquid holdups at different gas-liquid ratios for white oil-air two-phase flow and water-air mixture in a pipe with the inclined angle of 30°
4.5 Effect of pipe inclination
According to the theoretical liquid holdup calculated by Beggs and Brill, the correlations for horizontal pipe cannot be directly applied to the inclined pipe. This implies the importance of inclination on liquid holdup.
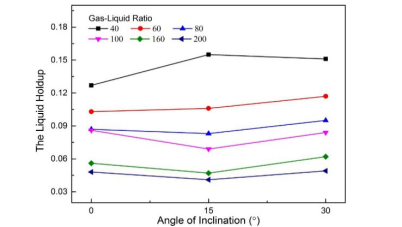
Figure 11. Measured liquid holdups at different inclined angles and gas-liquid ratios under the liquid flow of 10.42 m³/h
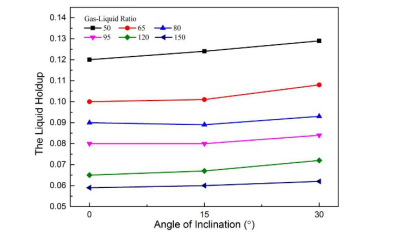
Figure 12. Measured liquid holdup at different inclined angles and gas-liquid ratios under the liquid flow of 12.5 m³/h
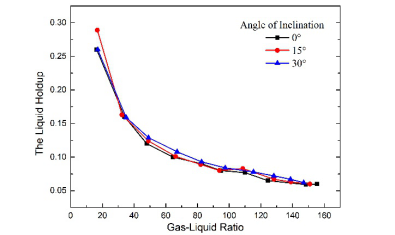
As shown in Figure 11, under the liquid flow rate of 10.42m³/h and the gas-liquid ratio of 40, the liquid hold decreased as the inclined angle shifted from 0° to 15°, and increased as the angle expanded from 15° to 30°. By contrast, when the liquid flow rate increased to 12.5 m³/h in Figure 12, the liquid holdup rose slightly as the inclined angle increased from 0° to 30°. To sum up, the liquid holdup varied insignificantly when the inclined angle fell between 0° and 30°.
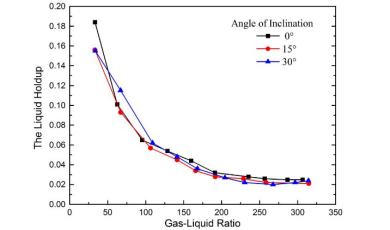
Figure 13. Measured liquid holdups at different gas-liquid ratios and inclined angles at the liquid flow of 10.42 m³/h
Figure 14. Measured liquid holdups at different gas-liquid ratios and inclined angles at the liquid flow of 12.5 m³/h
As can be seen in Figures 13 and 14, with the increase in the liquid flow rate, the liquid holdup curves of three inclined angles overlapped each other. This phenomenon reveals that the liquid holdup is not heavily affected by small variation in the inclined angle under a low gas-liquid ratio (<100), and the influence will further decrease with the growth of the gas-liquid ratio.
4.6 Effect of gas-liquid ratio
It can be seen from Figure 13 and 14 that the liquid holdup decreased with increase in gas-liquid ratio. The rate of decrease was rapid at low gas-liquid ratios, and slows down as the ratio increased. Eventually, the liquid holdup stabilized at a certain value and grew with the increase in the liquid flow. Hence, the gas-liquid ratio has a great impact on liquid holdup in a certain range.
In this test, it is observed that when the gas-liquid ratio was less than 200, the liquid holdup decreased at a rather fast pace; when the ratio fell between 200 and 300, the decrease rate gradually slowed down; when the ratio was greater than 300, the liquid holdup curves became asymptotic.
Through the simulation of the actual working conditions (gas volume: 4×10⁵ m3/d; liquid volume: 8~200 m3/d), the author discovered that the effect of the gas-liquid ratio on liquid holdup was minimal when the former exceeded 20,000 [26]. The simulation results under other working conditions show that the effect was no longer obvious after the gas-liquid ratio surpassed 1,000 [27]. Therefore, the range of gas-liquid ratio has a significant impact on the liquid holdup, and the exact impact depends on the specific conditions.
This paper experimentally explores the liquid holdup of liquid-gas two-phase flow in horizontal pipes with small inclined angles. The following results can be highlighted:
Six existing liquid holdup models were evaluated against the test data from the Laboratory of Multiphase Pipe Flow, Gas Lift Innovation Center, China National Petroleum Corp. The evaluation results show that the modified-Hughmark correlation boasted the best accuracy for air-water mixture in the horizontal direction and at small inclination angles, while the Beggs-Brill model outperformed the other models for white oil-air flow.
The increase in liquid holdup is proportional to pipe diameter at the same gas-liquid ratio. To reduce the pipe effusion, the liquid holdup should be suppressed by reducing the pipe diameter if conditions permit.
As long as the gas-liquid ratio is lower than 100, the inclined angle in the range of 0~30° had little effect on liquid holdup, and the effect gradually decreased with the increase in the gas-liquid ratio.
The liquid holdup is influenced by such physical properties as viscosity, density and content of heavy components. Specifically, the liquid holdup is positively correlated with the viscosity and the content of heavy components, and negatively with density. This is proved by the test results that the white oil-air flow had a greater liquid holdup than the water-air mixture at the same gas and liquid flow rates.
It is also observed that the gas-liquid ratio had a great impact on liquid holdup. When the ratio fell between 0 and 300, the liquid holdup declined rapidly; when the ratio exceeded 300, the impact was weakened and the liquid holdup curves became asymptotic.
Thanks for Luo Wei of the corresponding author for the article. This work is supported by the National Natural Science Found Project (NO. 61572084) and National Key Scientific and Technological Project (2016ZX05056004-002, 2016ZX05046004-003)
|
e |
the absolute error, dimensionless |
|
HL |
liquid holdup, dimensionless |
|
N
|
the number of the whole group under horizontal or inclinations respectively |
|
Us |
superficial velocity, m.s-1 |
|
Greek Symbols |
|
|
ε1 |
the average relative error |
|
ε2 |
the absolute relative average error |
|
ε3 |
the standard deviation of relative error |
|
$\lambda$ |
liquid holdup of no-slippage |
|
$\rho$ |
density, kg.m3-1 |
|
$\mu$ |
dynamic viscosity, kg. m-1.s-1 |
|
Subscripts |
|
|
i |
No. i set data,dimensionless |
|
ipre |
the predict values |
|
iexp |
the experimental values |
|
g |
gas |
[1] Osman E.S.A. (2001). Flow regimes and liquid holdup in horizontal multiphase flow, Journal of Petroleum Technology, Vol. 53, No. 10, pp. 42-42. DOI: 10.2118/1001-0042-JPT
[2] Lei Y., Liao R.Q., Li M.X., Li Y., Luo W. (2017). Modified Mukherjee-brill prediction model of pressure gradient for multiphase flow in wells, International Journal of Heat and Technology, Vol. 35, No. 1, pp. 103-108. DOI: 10.18280/ijht.350114
[3] Qin J. (2011). Detection of gas pipeline effusion and analysis of safe operation. M.S., Dissertation, College of Mechanical and Electronic Engineering, China University of Petroleum (East China), Qingdao, China.
[4] Chen J.L., (2010). The gas-liquid two-phase flow in horizontal pipes, Gas-liquid two-phase pipe flow in Petroleum Industry, Chen J.L., Chen T.P. (Eds.), Petroleum Industry Press, Beijing, pp. 170-170.
[5] Sarica C., Pereyra E.J., Brito R. (2013). Effect of medium oil viscosity on two phase oil gas flow behavior in horizontal pipes, Offshore Technology Conference, Huston, pp. S1-S18
[6] Lockhart R.W. (1949). Proposed correlation of data for isothermal two-phase, two-component flow in pipes, Chem.eng.prog , Vol. 45, pp. 39-48.
[7] Hughmark G.A. (1962). Holdup in gas–liquid flow, Chem. Eng. Prog, Vol. 58, pp. 62–65.
[8] García F., García R., Joseph D.D. (2005). Composite power law holdup correlations in horizontal pipes, International Journal of Multiphase Flow, Vol. 31, No. 12, pp. 1276~1303. DOI: 10.1016/j.ijmultiphaseflow.2005.07.007.
[9] Guzhov A.I., Mamaev V.A., Odisharii︠a︡ G.E. (1967). Some study of transportation in gas-liquid systems: Une étude sur le transport des systèmes gaz-liquides, International Gas Union.
[10] Beggs D.H., Brill J.P. ( 1973). An experimental study of two-phase flow in inclined pipes, Journal of Petroleum Technology, Vol. 25, No. 5, pp. 607-617. DOI: 10.2118/4007-PA
[11] Eaton A.B., (1967). The prediction of flow patterns, liquid holdup and pressure losses occurring during continuous two-phase flow in horizontal pipelines, Journal of Petroleum Technology, Vol. 19, No. 6, pp. 815-828.
[12] Abdul-Majeed G.H. (1996). Liquid holdup in horizontal two-phase gas-liquid flow, Journal of Petroleum Science & Engineering, Vol. 15, No. 2-4, pp. 271-280. DOI: 10.1016/0920-4105(95)00069-0
[13] Minami K., Brill J.P. (1987). Liquid holdup in wet-gas pipelines, Spe Production Engineering, Vol. 2, No. 1, pp. 36-44. DOI: 10.2118/14535-PA
[14] Ansari A.M., Sylvester N.D., Shoham O. (1990). A comprehensive mechanistic model for upward two-phase flow in wellbores, The 65th SPE Annual Technical Conference and Exhibition, New orleans, pp. S1-S8.
[15] Xiao J., Shoham O., Brill J. (1990). A comprehensive mechanistic model for two-phase flow in pipelines, The 65th SPE Annual Technical Conference and Exhibition, New Orleans, LA, Paper SPE 20631, pp. 167–180.
[16] Dukler A.E., Iii M.W., Cleveland R.G. (1964). Frictional pressure drop in two-phase flow: A. A comparison of existing correlations for pressure loss and holdup, Aiche Journal, Vol. 10, No. 1, pp. 38-43. DOI: 10.1002/aic.690100117
[17] Vohra I.R., Hernandez F., Marcano N. (1975). Comparison of liquid-holdup and friction-factor correlations for gas-liquid flow, Journal of Petroleum Technology, Vol. 27, No. 5, pp. 564-568. DOI: 10.2118/4690-PA
[18] Mandhane J.M., Gregory G.A., Aziz K. (1975). Critical evaluation of holdup prediction methods for gas-liquid flow in horizontal pipes, Journal of Petroleum Technology, Vol. 29, No. 10, pp. 1348-1358. DOI: 10.2118/5140-PA
[19] Abdul-Majeed G.H. (1993). Liquid holdup correlation for horizontal, vertical and inclined two-phase flow, Society of Petroleum Engineers.
[20] García F., García R., Joseph D.D. (2005). Composite power law holdup correlations in horizontal pipes, International Journal of Multiphase Flow, Vol. 31, No. 12, pp. 1276-1303. DOI: 10.1016/j.ijmultiphaseflow.2005.07.007
[21] Cheng X.J., Yu D., Gong J. (2008). Research on calculation method of liquid holdup of ga -liquid two - phase flow in horizontal, Oil-Gasfield Surface Engineering, Vol. 11, pp. 14-15.
[22] Fu T.T., Liu J., Liao R.G. (2017). Water holdup in no-slip oil-water two-phase stratified flow, International Journal of Heat and Technology, Vol. 35, No. 2, pp. 306-312. DOI: 10.18280/ijht.350211.
[23] Liao R.Q., Li Y., Song J.P. (2014). The eestablishment of mutiphase flow exiperiment platform in gas lift test base, Journal of Oil and Gas Technology, Vol. 36, No. 9, pp. 129-131.
[24] Lamorgese A., Mauri R. (2017). Effect of viscosity ratio on structure evolution during mixing/demixing of regular binary mixtures, Chemical Engineering Transactions, Vol 57, pp. 1225-1230 DOI: 10.3303/CET1757205
[25] Li Y.X., Feng S.C. (1998). Study on distribution law of fluid composition in wet natural gas transmission pipeline, Oil & Gas Storage and Transportation, Vol. 17, No. 2, pp. 1-5.
[26] Yao L.Y., Lei W., Chen H.L. (2013). Analysis of the influence of liquid holdup of the gas-liquid mixing pipeline under the undulating terrain, China Oil and Gas Field Ground Engineering Technology Conference Proceedings, pp. 1528-1532.
[27] Zhuang Z.H. (2016). Study on liquid holdup prediction and the law of pigging of undulating natural gas pipeline. M.S., Dissertation, School of petroleum and gas engineering, Southwest Petroleum University, Chengdu, China.