OPEN ACCESS
Methane represents an attractive energy source for power production generated by internal combustion engines because of its renewable nature and environmental friendly characteristics. The most suitable way to utilize methane in compression ignition engines is the dual fuel (DF) technology. In diesel/methane DF operation the gas is injected into the intake manifold to mix uniformly with air; the premixed air-methane mixture is drawn into the cylinder and it is ignited by diesel fuel injected directly in the chamber. This paper deals with the energetic potentiality of a small compression ignition engine modified to run in diesel/methane DF mode. The engine is a three-cylinder, 1.0 L, equipped with a common rail injection system. Experiments were performed at different speeds and loads. For each operating condition, a part of the total energy was supplied by the diesel combustion and the remaining by methane. Combustion process was analyzed by in-cylinder pressure signal. Optical diagnostics were applied to investigate the effect of methane addiction to diesel fuel on combustion evolution and pollutant formation. Pollutant emissions were measured at exhaust. It was found out that DF operation represents a feasible way to reduce both particulate matter and nitrogen oxides emissions.
Combustion, Dual-fuel engine, Methane, Nitrogen oxides, Particulate matter.
Compression ignition (CI) engines take on a dominant position around the world in stationary applications for energy production thanks to their efficiency, reliability and adaptability [1]. However, due to the nature of combustion process, which is characterized by locally rich as well as high temperature regions, diesel engines are the main source of particulate matters (PM) and nitrogen oxides (NOx) [2]. Environmental and human health problems associated with diesel emissions led to intensified efforts for reducing the pollutants formation within the combustion process itself [3].
The use of methane in CI engines represents an attractive way to face the issue of exhaust emissions. Methane clean burning qualities are mainly due to the higher hydrogen-to-carbon ratio with respect to diesel fuel. Methane can be used in existing CI engine through dual fuel (DF) technology. Because of the high auto-ignition temperature and low cetane number (CN), methane does not auto-ignite with typical CI engines compression ratios but needs a source of controlled ignition that is usually provided by another high CN liquid fuel [4]. In diesel/methane DF operation, in fact, the gas fuel is injected into the intake manifold to mix uniformly with air; the premixed air-methane mixture is drawn into the cylinder and it is ignited by diesel fuel injected directly in the chamber around the top dead center (TDC) [5].
Several studies have investigated the effects of DF combustion on engine performance, efficiency and exhaust emissions [4-6]. A better understanding of the effect of methane addiction to diesel fuel on combustion evolution and pollutant formation can be reached through optical investigation [7]. Among several optical techniques, endoscopy is particularly suitable for spray and combustion diagnostics in production engines. Endoscopes require a very small area for optical access into the chamber thus allowing to detect in-cylinder phenomena, in real engine geometries and under wide range of load and speed conditions, without significant mechanical modifications and with minimal interference to the combustion process [8-9].
This paper aims to analyze the combustion evolution and pollutant formation, through endoscope based optical diagnostics, in a small CI engine modified to run in diesel/methane DF mode. Experiments were performed at different engine speeds and loads. In order to not burden the paper, only the data acquired at the engine speed of 1600 rpm at 30 and 50% of the rated torque output are shown. The engine was first operated in conventional mode with neat diesel fuel and then in diesel/methane DF configuration. The DF combustion behavior was analyzed through indicating data. Flame images were detected and they were post-processed by two-color pyrometry method to assess the flame temperature and the soot concentration. In-cylinder data were correlated to NOx and PM emissions measured at exhaust.
2.1 Experimental apparatus
2.1.1. Test engine
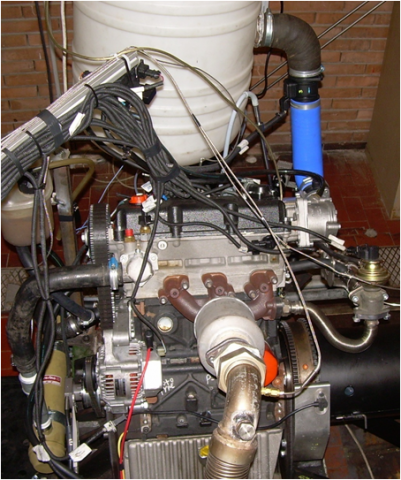
The investigation was carried out on a three-cylinder, six valves, 1.0 L, CI engine (Figure 1). The main engine specifications are listed in Table 1. In order to carry out diesel/methane DF experiments, the intake manifold was modified to set up a 4 holes injector for gaseous fuels characterized by dynamic flow rate of 2000 cm3/min at 4 bar. Methane was charged in a compressed bottle at 200 bar and decompressed to 4 bar through a regulator and, then, supplied to the intake manifold. The injector was managed by a control unit developed in Istituto Motori while the original electronic control unit (ECU) for diesel injection control was retained.
Figure 1. Test engine
Table1. Engine specifications
|
Engine |
Compression ignition |
|
Number of cylinders |
3, in-line |
|
Bore [mm] |
75.0 |
|
Stroke [mm] |
77.6 |
|
Displacement [cm³] |
1028 |
|
Compression Ratio |
17.5:1 |
|
Max. power [kW] |
15 @ 3600 rpm |
|
Max. torque [Nm] |
60 @ 2000 rpm |
|
Injection system |
Direct, CR |
|
Max. injection pressure [bar] |
1400 |
|
Aspiration |
Naturally Aspirated |
|
IVO [CAD BTDC] |
13 |
|
IVC [CAD ATDC] |
39 |
|
EVO [CAD BTDC] |
38 |
|
EVC [CAD ATDC] |
14 |
In order to have an optical access in the combustion chamber, a hole for endoscope was realized in the first cylinder of the engine. The endoscope allows a 100° field of view as shown in Figure 2. The endoscope accesses the cylinder via a protection sleeve equipped with a 5 mm diameter sapphire window. Endoscope was coupled to a Charge Couple Device (CCD) camera (640x480 pixels) equipped with a c-mount adaptor and a 25 mm lens for the acquisition of combustion phase images. The housing of the endoscope was cooled with compressed air to operate in a system at high pressure and temperature. Images were detected with an exposure time of 1 crank angle degree (CAD), corresponding to 104 µs at the engine speed of 1600 rpm, and high gain. Exposure time and gain were properly set to detect the flame as bright as possible without causing saturation. The synchronization between the camera and the engine was made by a crank angle shaft encoder through a delay unit. For each image, five repetitions were detected to take into account the cycle-to-cycle variability. All the images were stored in the PC device and post-processed by the AVL-ThermoVision® program that allows to apply the two-color pyrometry to evaluate the flame temperature and the soot concentration.
Figure 2. Endoscope field of view
2.1.3. Experimental facilities
The engine torque was measured with a resolution of 1 Nm by a dynamometer load cell (STIPAF L3B160M). The temperatures of engine coolant, air inlet and exhaust were measured by type K thermocouples (OGDEN series 121HT MGO) with a resolution of 1 K. Diesel fuel consumption was measured by a gravimetric balance (AVL730) at a frequency of 10 Hz and with an accuracy of 0.12%. Methane fuel consumption was measured by thermal mass flow meters (Brooks SLA 5861) with an accuracy of 1%. In order to monitor the combustion evolution, in-cylinder pressure signals were detected by quartz transducers (AVL GH14P) characterized by sensitivity of 15.6 pC/bar and natural frequency of 130 kHz. They were flush-mounted in the head in all the cylinders by means of glow plug adaptors. The pressure signals of 500 cycles were recorded with a resolution of 0.2 CAD by a high-speed data acquisition system (AVL Indimodul) synchronized with the crankshaft position through the signals transmitted by an optical shaft encoder (AVL365C).
Gas emissions were measured at the exhaust by Horiba MEXA 7100 DEGR test bench.
An AVL smoke meter 415S was used to measure the filter smoke number (FSN) that was converted in PM concentration (mg/m3) through empirical relations.
Particle number and size distributions were measured by means of the Engine Exhaust Particle Sizer 3090 (EEPS) developed by TSI through electrical mobility methods. The EEPS measures particle sizes from 5.6 to 560 nm at rate of 10 Hz. Before entering the EEPS, the sample of exhaust gas was taken by a 1.5 m long line heated at 150°C and it was diluted by means of the Dekati Engine Exhaust Diluter (DEED), a Particle Measurement Programme (PMP) compliant conditioning system.
2.2 Experimental procedures
2.2.1. Test fuels
Engine was fueled with commercial diesel fuel in conventional operation mode and, simultaneously, with diesel and methane in DF mode. Table 2 shows the main fuel properties.
Table 2. Fuel properties
|
Properties |
Diesel |
Methane |
|
Chemical formula |
CnH1.8n |
CH4 |
|
Density @ 15°C [kg/m3] |
834.5 |
0.678 |
|
Viscosity @ 40°C [mm2/s] |
3.34 |
- |
|
Lower Heating Value [MJ/kg] |
42.8 |
50.0 |
|
AFRst |
14.2 |
17.2 |
|
Auto-ignition temperature [°C] |
220 |
650 |
|
Flammability limits [% vol] |
0.6-7.5 |
5-15 |
|
Cetane Number |
55.1 |
- |
|
Octane Number |
- |
>120 |
|
Carbon [% mass] |
84.71 |
75 |
|
Hydrogen [% mass] |
13.89 |
25 |
|
Oxygen [% mass] |
1.24 |
- |
|
Nitrogen [% mass] |
0.16 |
- |
2.2.2. Test method
Before starting the experiments, the engine was warmed up until the coolant temperature reached 80°C. For all test cases, the inlet air temperature and humidity were about 23°C and 45%, respectively. Experiments were performed at different engine speeds and loads. In the next sections, the data acquired at 1600 rpm at 30 and 50% of maximum load are shown. Details about the operating conditions are shown in Table 3. Under DF mode, 10% of the full load, about 5 Nm, was provided by diesel combustion while the remaining load was supplied by methane. In particular, the amount of gas fuel was changed, by controlling the injection duration, in order to reach the torque output of 16 and 26 Nm at 30 and 50% of full load, respectively.
Table 3. Operating conditions.
|
Fuel |
D |
DF |
D |
DF |
|
Engine speed [rpm] |
1600 |
1600 |
1600 |
1600 |
|
Torque/Torquemax [%] |
30 |
30 |
50 |
50 |
|
Torque [Nm] |
26 |
26 |
16 |
16 |
|
ṁdiesel [kg/h] |
0.87 |
0.50 |
1.15 |
0.45 |
|
ṁCH4 [kg/h] |
- |
0.56 |
- |
0.76 |
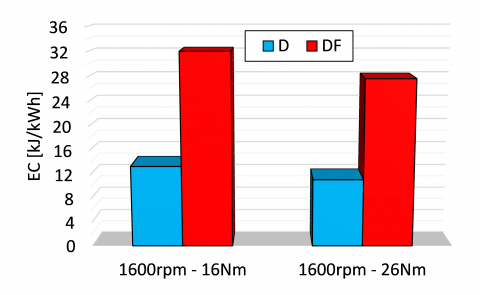
In order to evaluate the energy performance of DF operation, the energy consumption (EC) was calculated as follows:
$E C=\frac{\dot{m}_{C H_{4}} \cdot L H V_{C H_{4}}+\dot{m}_{\text {diesel}} \cdot L H V_{\text {diesel}}}{P_{b}}$(1)
where ṁCH4 and ṁdiesel are the mass flow rate of methane and diesel fuel, respectively; LHVCH4 LHVdiesel are the lower heating value of methane and diesel, respectively and Pb is the brake power output.
It can be noted, Figure 3, that DF combustion is characterized by higher EC with respect to conventional diesel operation due to the bad methane combustion in poor air-methane mixture.
In diesel/methane DF mode, combustion evolution is strongly affected by the different physicochemical properties of the fuels: high CN liquid fuel and the high octane number (ON) gas fuel. DF operation, in fact, shows both the diffusive behavior typical of diesel combustion and the premixed characteristic of methane combustion [10].
Figure 3. Energy consumption for D and DF mode at 1600 rpm, at 30 and 50% of load.
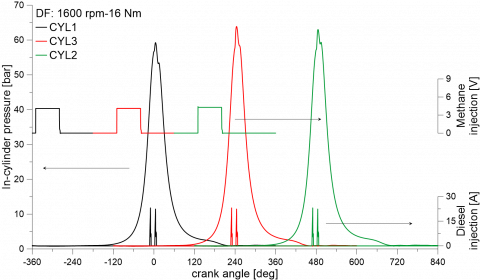
Figure 4. In-cylinder pressure histories detected in the three cylinders in DF mode at 1600 rpm and 30% of load
Figure 5. a) pmax and b) CAD of pmax for D and DF mode at 1600 rpm, at 30 and 50% of load.
Figure 4 shows the pressure histories detected in the three cylinder for dual fuel operation in the test point at 1600 rpm and 30% of load. The injection signal of diesel fuel and methane for each cylinder are also shown. In order to simplify the paper reading, pressure traces detected in the other test cases are not reported since they have similar behavior. Pressure traces reveal two peaks due to the combustion of the premixed air/methane charge induced by two different ignition sources, the pilot and main diesel injection.
In order to analyze the effect of methane on combustion, the maximum pressure (pmax) and the crank angle at which it occurs (CAD pmax) were calculated and displayed in Figure 5 for diesel (D) and DF operation. It can be observed that the maximum pressure in DF mode is reduced and delayed with respect to conventional diesel operation. In particular, in DF mode pmax decreases of more than 2 bar at 30% of load; lower reduction, about 1 bar, is detected at 50% of load. Moreover, it arises that in DF mode the maximum pressure occurs 1.5 and 2.5 CAD later than diesel fueling at 30 and 50% of load, respectively. This trend can be ascribed to the higher specific heat capacity ratio of methane with respect to air that lowers the temperature and, hence, the pressure during the compression stroke. As consequence, in DF mode the combustion peak is lower and retarded with respect to conventional diesel operation.
Figure 6. CAD10, CAD50 and CAD90 for D and DF mode at 1600 rpm, at 30 and 50% of load
The heat release (HR) can be calculated from the pressure profile by means of the perfect gas law and the first law of thermodynamics. The CADs for 10, 50 and 90% of mass fraction burned (CAD10, CAD50 and CAD90, respectively) were calculated from HR curves as fraction of fuel energy released, according to the Wiebe function [2]. In particular, CAD10 and CAD90 are identified as the start (SOC) and the end of combustion (EOC), respectively. The time between CAD10 and CAD90 is defined as combustion duration. These parameters are shown in Figure 6, for both operations, in the investigated conditions. The start and the end of each vertical bar represent CAD10 and CAD90, respectively, the middle line represents CAD50. These data were calculated for both pilot and main combustion. It can be observed that DF mode has 1.6 and 2 CAD retarded SOC of pilot event for the condition at 30 and 50% of load respectively. This trend could be ascribed to the methane presence that lowers the temperature in the chamber thus inhibiting the diesel ignition in DF operation. The longer diesel ignition delay in DF mode could also be ascribed to chemical factors: the methane mixed with air, in fact, alters the properties of the charge, the oxygen concentration and the pre-ignition reaction activities during compression [11]. Moreover, the pilot combustion duration in DF mode is about 1.4 CAD longer of conventional diesel mode at both operating conditions. As a consequence, the time between the pilot EOC and the main SOC is reduced in DF mode. This behavior could be due to the slower flame propagation of the methane charge, ignited by the pilot diesel fuel, and, then, further promoted by main diesel injection [12]. Concerning the main combustion, the CAD10 and CAD50 occurs at about the same time for both diesel and DF operation. However, DF combustion has about 1.5 and 2.5 CAD longer duration with respect to conventional diesel mode at 30 and 50% of load, respectively. This trend could be ascribed to the slower burning rate of methane at lean mixture conditions that causes the combustion phase to be shifted towards the expansion stroke.
Figure 7. Flame images for D and DF mode at 1600 rpm and 30% of load
A more comprehensive analysis of combustion evolution can be obtained by optical measurements.
Figure 7 shows a selection of images of combustion process for diesel and DF operation in the test point at 1600 rpm and 30% of load. For conventional diesel fueling, the first luminous spots are distinguishable at TDC due to the pilot combustion. For DF operation, instead, the first visible flames appear 2 CAD later as expected by indicating data. At 10 CAD after TDC (ATDC) two jets of the main injection are visible, for both diesel and DF operation. These jets are visible with respect to the ones of pilot event because lightened by the first flames occurring in the bowl. The jets spread along the spray axis and impinge towards the bowl wall. Concerning diesel mode, at 13 CAD ATDC, very luminous flames fed by the main fuel appear in the endoscope field of view. At 18 CAD ATDC, some flames rise from the bowl because of the air motions that guarantee the burning of the impinged fuel. Then, at 25 CAD ATDC, the flames spread out over the entire field of view showing very high luminous intensity. With regards to DF operation, the flame luminosity from 13 CAD ATDC, after the main injection, are less intense with respect to diesel operation. The combustion flame characterization is a valuable way to evaluate the in-cylinder soot concentration since the flame emissions are due to soot radiation.
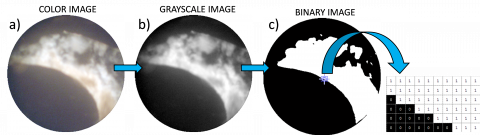
Flame images were post-processed, as shown in Figure 8, to evaluate the temporal evolution of the flame area. Firstly, true color images of the combustion phase were converted to 8 bit format with 255 grayscale of intensities representing the luminous levels. Then, grayscale images were transformed to binary by thresholding level of 0.5. This conversion is made by replacing all pixels in the input image with luminance greater than level with the value 1 (white) and replacing all other pixels with the value 0 (black). Each image includes 131.769 pixels; a pixel corresponds to a combustion chamber area of about 0.1x0.1mm2. For each images the number of pixel with the value 1, corresponding to flame presence, was counted and the sum was divided for the total number of pixels of the image in order to better investigate the flame distributions in the chamber
.
Figure 8. Image processing sequence for flame image:
(a) raw image, (b) gray scale image, (c) binary image.
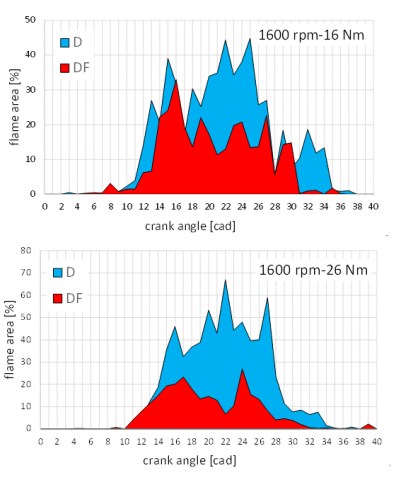
Figure 9. Flame area for D and DF mode at 1600 rpm, at 30% (up) and 50% of load (down)
Figure 9 shows the percentage of the flame area in the chamber versus the crank angle degrees. It can be observed that DF operation is characterized by smaller flame area with respect to conventional diesel fueling for all the combustion duration since in DF mode the amount of diesel fuel injected in the chamber is lower. Graves et al. [13], in fact, found out that soot aggregates from DF combustion have similar primary particle size, aggregate size, and effective density as diesel soot suggesting that the main source of soot production in DF mode is the liquid fuel. This behavior affects the pollutant formation: the smaller is the flame area the smaller should be the locations where particles are formed.
In order to improve the knowledge about the in-cylinder pollutant formation, flame images were post-processed by two-color pyrometry method to quantify the flame temperature and the in-cylinder soot concentration that provide information about the two main exhaust emissions of a diesel engine, NOx and PM, respectively. The two-color method consists in measuring the radiation emitted at two wavelengths by the incandescent soot particles generated during the combustion process. Appropriate assumptions about the nature of the soot allow to estimate the instantaneous flame temperature and the soot concentration [14].
Figure 10 shows a typical temperature and soot concentration distribution resulting from post processing of flame images. About temperature images, the color scale was set to 1500-2700 K to allow the reading of the temperature gradients. For the same reason, the color scale of soot concentration was set to 0-105 arbitrary unit (a.u.).
Figure 10. Image processing sequence for flame image: (a) raw image, (b) temperature, (c) soot
Soot images were processed to calculate the soot concentration produced during the whole combustion phase. Soot is formed from unburned fuel, which nucleates from the vapor to a solid phase in fuel-rich regions at high temperatures. Hydrocarbons or other available molecules could condense on, or be absorbed by soot. PM is the combination of soot and other liquid or solid phase materials that are collected during expansion and exhaust stroke. Therefore, the higher is the in-cylinder soot concentration the higher are expected the particulate emissions at exhaust.
Figure 11 shows the integral soot concentration measured by optical techniques for diesel and DF operation in the investigated conditions. In-cylinder data are correlated to particle number measured at exhaust; information about particle diameter are also provided. It can be observed that DF operation allows about a 35% reduction of soot concentration in the chamber since a part of diesel fuel is replaced by methane that should not have a primary role in the soot formation. The lower C/H ratio and the absence of C-C bonds of methane, in fact, reduce the soot formation tendency for the gaseous fuel. In-cylinder data shows good agreement with the particles measurements at exhaust. By assuming that particles emitted in both operations have similar density and by considering the low particles diameter, it results that lower is the in-cylinder soot concentration, lower is the particle number measured at exhaust. In the condition at 30% of load, in fact, particle number decreases from 1.3E8 for diesel fuel down to 6.9E7 for DF. Particles emitted by DF operation have larger diameter than those emitted by conventional diesel mode due to a different mechanism of particle formation. The cooling effect of methane, in fact, could worsen the pilot liquid fuel vaporization, as evidenced by the delayed ignition in
Figure 6, leading to larger soot precursor formation. Even if DF emits bigger particles, their number is sufficient low to reduce the total PM concentration with respect to diesel operation (1.6 mg/m3 for DF versus 2.4 mg/m3 for diesel fuel). In the condition at 50% of load, DF combustion emits 4.0E7 particles versus 6.1E7 of diesel operation. However, even if DF combustion emits lower number of particles, their size is larger than diesel fuel thus leading to quite similar mass concentration, about 1.8 mg/m3, for both operations.
Figure 11. In-cylinder soot concentration (left) and particle number and diameter at exhaust (right) for D and DF mode at 1600 rpm, at 30% and 50% of load
Figure 12. Average combustion temperature for D and DF mode at 1600 rpm, at 30% (up) and 50% of load (down).
Temperature images (Figure 10) were processed to calculate the average temperature during the combustion process, as shown in Figure 12. The curves were obtained by averaging pixel-by-pixel the temperature map and the black area, such as the one corresponding to the engine head, were excluded. In the condition at 30% of the load, DF and diesel operation has quite same temperature in the angular range 5-11 CAD ATDC. Then, DF operation exhibits a peak of temperature of about 2540 K at 16 CAD ATDC with respect to 2480 K detected at the same time for conventional diesel fueling. However, from 20 CAD ATDC up to the end of combustion process, DF shows lower temperature than diesel mode. Similar consideration can be done also at 50% of load where in the first phase of combustion, up to 18 CAD ATDC, DF and diesel operation has similar temperature. Then, DF combustion is characterized by lower temperature (even 100 K lower) with respect to diesel operation.
It is known from literature [2] that the reactions of thermal nitrogen monoxide (NO) formation occur at high temperature in presence of oxygen. Tests with diesel and DF mode were done with relative air-fuel ratio greater than 2 revealing high oxygen availability for both fueling. It can be deduced that the in-cylinder temperature is the main parameter affecting the NO formation in the analyzed test cases. Due to the triple bond of nitrogen molecule (N2), temperatures of about 2000 K must be reached in order to split the molecules and to enable the formation of NO according to the Zeldovich mechanism. However, as soon as these temperatures are reached, the NO production increases exponentially with temperature. Therefore, the higher is the flame temperature, the higher is expected the NO formation. This observation is confirmed by exhaust measurements.
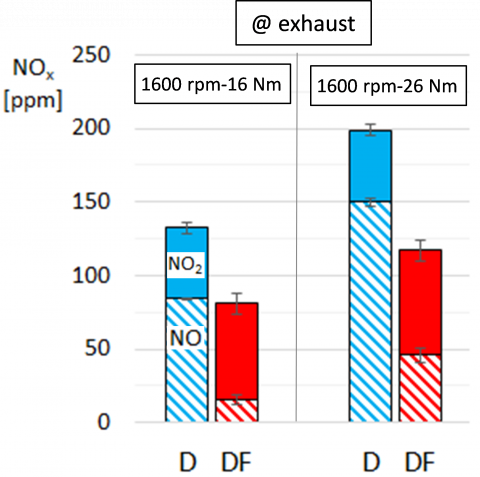
Figure 13. NO and NO2 emissions for D and DF mode at 1600 rpm, at 30% and 50% of load
Figure 13 shows the NO, NO2 and NOx emissions measured for diesel and DF combustion in the investigated conditions. It can be observed that NO emissions in DF mode are reduced of about 80 and 70% with respect to diesel mode at 30 and 50% of load, respectively. This trend could be ascribed to the lower in-cylinder temperature reached in DF operation as found out by optical measurements. Another thing to take into account is that methane/air combustion occurs later in the expansion stroke, as evidenced by indicating data (Figure 6), where the NO formation rate is slowed down. DF combustion emits 35 and 45% higher NO2 at 30 and 50% of load, respectively. However, by considering both NO and NO2, it can be argued that DF combustion allows a 40% reduction of total NOx with respect to diesel operation.
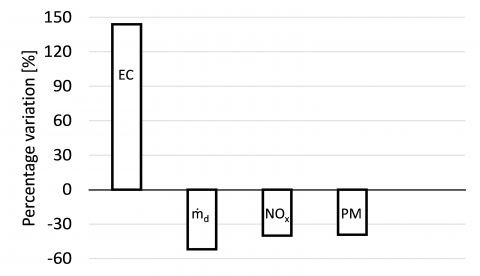
In order to summarize the results of the experimental investigation, the percentage variation of some characteristics parameters of engine performance, consumption and emissions was calculated. Figure 14 shows the percentage variation, averaged for all investigated conditions, of EC, ṁdiesel, NOx and PM. It can be argued that DF combustion is a good alternative to diesel operation. Even if DF mode is characterized by higher energy consumption, it allows to reduce the diesel fuel dependence with benefit effects on exhaust emissions.
Figure 14. Percentage variation of EC, ṁdiesel, NOx and PM between diesel and DF operation
This study aims to analyze the performance, combustion evolution and exhaust emissions of a 1.0 L compression ignition engine modified to run in diesel/methane DF mode. Experiments were carried out at steady state conditions, at the engine speed of 1600 rpm and at 30 and 50% of full load. Indicating data were detected in order to investigate the differences in combustion evolution between DF and conventional diesel operation. NOx and PM emissions were measured at exhaust; particles were also characterized in terms of number and size. Non-intrusive optical measurements were performed for a comprehensive analysis of combustion evolution and pollutant formation.
It was found out that DF combustion is characterized by higher energy consumption than diesel operation. However, this drawback is compensated by the reduced fossil fuel consumption.
Indicating data have shown that DF operation is characterized by lower and delayed pressure peak with respect to conventional diesel fueling. Moreover, the lower flame propagation of methane makes the combustion phase longer with respect to diesel fuel. Optical investigation has evidenced that DF combustion is characterized by lower in-cylinder soot formation and temperature than diesel operation resulting in lower particle and NOx emissions.
Authors thank Mr. Carlo Rossi and Mr. Bruno Sgammato for the engine assessment and for the support in the experimental activity.
|
AFRst |
Stoichiometric Air Fuel Ratio |
|
a.u. |
Arbitrary Unit |
|
ATDC |
After Top Dead Center |
|
BTDC |
Before Top Dead Center |
|
CAD |
Crank Angle Degree |
|
CAD10 |
CAD of 10% Mass Fraction Burned |
|
CAD50 |
CAD of 10% Mass Fraction Burned |
|
CAD90 |
CAD of 10% Mass Fraction Burned |
|
CCD |
Charge Couple Device |
|
CH4 |
Methane |
|
CI |
Compression Ignition |
|
CN |
Cetane Number |
|
D |
Diesel |
|
DEED |
Dekati Engine Exhaust Diluter |
|
Dm |
Mean Particle Diameter |
|
DF |
Dual Fuel |
|
EC |
Energy Consumption |
|
ECU |
Electronic Control Unit |
|
EEPS |
Engine Exhaust Particle Sizer |
|
EOC |
End of Combustion |
|
EVC |
Exhaust Valve Closing |
|
EVO |
Exhaust Valve Opening |
|
FSN |
Filter Smoke Number |
|
HR |
Heat Release |
|
IVC |
Intake Valve Closing |
|
IVO |
Intake Valve Opening |
|
$\dot{m}$ |
Mass Flow Rate |
|
N2 |
Nitrogen molecule |
|
NO |
Nitrogen Monoxiede |
|
NO2 |
Nitrogen Dioxide |
|
NOx |
Nitrogen Oxides |
|
ON |
Octane Number |
|
Pb |
Brake power output |
|
PM |
Particulate Matter |
|
pmax |
Maximum pressure |
|
PMP |
Particle Measurement Programme |
|
SOC |
Start of Combustion |
|
TDC |
Top Dead Center |
[1] B. Challen and R. Baranescu, “Diesel Engine Reference Book,” Butterworth Heinemann, Oxford, 1999.
[2] J. B. Heywood, Internal Combustion Engine Fundamentals, McGraw-Hill, New York, 1988.
[3] A. Magno, E. Mancaruso and B. M. Vaglieco, “Analysis of combustion phenomena and pollutant formation in a small compression ignition engine fuelled with blended and pure rapeseed methyl ester,” Energy, vol. 106, pp. 618-630, 2016. DOI: 10.1016/j.energy.2016.03.106.
[4] T. Korakianitis, A. M. Namasivayam and R. J. Crookes, “Natural-gas fueled spark-ignition (SI) and compression-ignition (CI) engine performance and emissions,” Prog. Energy Combust. Sci., vol. 37, pp. 89-112, 2011. DOI: 10.1016/j.pecs.2010.04.002.
[5] L .Wei and P. Geng, “A review on natural gas/diesel dual fuel combustion, emissions and performance,” Fuel Process. Technol., vol. 142, pp. 264-78, 2016. DOI: 10.1016/j.fuproc.2015.09.018.
[6] B. B. Sahoo, N. Sahoo and U. K. Saha, “Effect of engine parameters and type of gaseous fuel on the performance of dual-fuel gas diesel engines-A critical review,” Renew Sustain Energ Rev, vol. 13, pp. 1151-84, 2009. DOI: 10.1016/j.rser.2008.08.003.
[7] A. Magno, E. Mancaruso and B. M. Vaglieco, “Performance, combustion analysis of dual fuel operation in single cylinder research engine fuelled with methane and diesel,” SAE paper 2015-24-2461. DOI: 10.4271/2015-24-2461.
[8] A. Magno, E. Mancaruso and B. M. Vaglieco, “Endoscopic investigation of combustion process in a small compression ignition engine fuelled with rapeseed methyl ester,” SAE paper 2014-01-2649. DOI: 10.4271/2014-01-2649.
[9] S. Kong, M. Ricart and R. D. Reitz, “In-cylinder diesel flame imaging compared with numerical computations,” SAE paper 950455, 1995. DOI: 10.4271/950455.
[10] W. Li, Z. Liu and Z. Wang, “Experimental and theoretical analysis of the combustion process at low loads of a diesel natural gas dual-fuel engine,” Energy, vol. 94, pp. 728-41, 2016. DOI: 10.1016/j.energy.2015.11.052.
[11] N. N. Mustafi, R. R. Raine and S. Verhelst, “Combustion and emissions characteristics of a dual fuel engine operated on alternative gaseous fuels,” Fuel, vol. 78, pp. 669-78, 2013. DOI: 10.1016/j.fuel.2013.03.007.
[12] S. Di Iorio, A. Magno, E. Mancaruso and B. M. Vaglieco, “Characterization of particle number and mass size distributions from asmall compression ignition engine operating in diesel/methane dual fuel mode,” Fuel, vol. 180, pp. 613-23, 2013. DOI: 10.1016/j.fuel.2016.04.108.
[13] B. Graves, B. Patychuk, R. Dastanpour and S. Rogak, “Characterization on particulate matter morphology and volatility from a compression-ignition natural-gas direct-injection engine,” Aerosol Sci. Technol., vol. 49, pp. 589-98, 2015. DOI: 10.1080/02786826.2015.1050482.
[14] H. Zhao and N. Ladommatos, “Optical diagnostic for soot and temperature measurement in diesel engines,” Prog. Energy Combust. Sci., vol. 24, pp. 221-55, 1998. DOI: 10.1016/S0360-1285(97)00033-6.