OPEN ACCESS
This work examines the operation of a residential building-integrated micro-trigeneration system during the whole year by means of a dynamic simulation software. The investigated system was based on a 6.0 kWel natural gas-fuelled internal combustion engine-based cogeneration unit for heating purposes during the winter and domestic hot water production during the whole year; auxiliary thermal energy was supplied by a natural gas-fired boiler. The cogeneration device, coupled with a combined storage tank, fed a 7.5 kW electric air-cooled water chiller for cooling purposes during the summer. The plant served a multi-family house composed of three floors, located in South Italy and compliant with the thermal transmittances suggested by the Italian Law. The primary energy consumption, the equivalent carbon dioxide emissions and the operating costs of the proposed system were evaluated based on the simulation results according to the Italian scenario and compared with those associated to a conventional system composed of a natural gas-fired boiler coupled with the same air-cooled water electric chiller fed by the electric grid. The performed analyses allowed to assess the energy, environmental and economic suitability of the proposed scheme and its potential benefits in comparison to the reference plant based on separate energy production.
Cogeneration, Trigeneration, Carbon dioxide emissions, Energy saving, TRNSYS.
Population growth along with the desire for higher living standards and comfort levels, have led to an unprecedented increase in energy consumption and global energy-related carbon dioxide emissions worldwide; the contribution of buildings in the European Union is about 40% of the total energy demand and generate 40-50% of the total emissions of greenhouse gases [1-2]. The depletion of resources as well as an environmental conscience regarding global warming and climate change have urged the need for a complete change in energy production, supply and consumption patterns [3]. In many countries, there has been an increasing demand of cooling energy during the warm season, which is generally satisfied by electrically-driven units; this trend contributed to electrical load peaking and subsequent network congestion as well as failure events in different power systems worldwide. This has strengthened the awareness of governments, manufacturers and communities of energy issues, pushing forward the search for innovative systems for local cooling energy generation.
Wide-ranging options exist on the supply side for the provision of electricity and heat. Among these options, micro-cogeneration (combined production of electrical and thermal energy from a single fuel source with an electric output lower than 50 kWel) is considered by the European Community as one of the most effective measures to save primary energy and reduce greenhouse gas emissions in domestic and small-scale applications. There are several technologies being developed for micro-cogeneration including internal combustion engines, gas and steam turbines, fuel cells and external combustion Stirling engines. Among the available alternatives, reciprocating internal combustion engine-based cogeneration systems are usually the best choice for residential applications thanks to their well-proven technology, robust nature and reliability [4-6]. The presence of a threefold energy demand (namely, electricity, heat and cooling) leads to the possibility of profitably combining micro-cogeneration units with various technologies currently available for cooling. Among the technologies for composing trigeneration systems, the combination of micro-cogeneration units with electric chillers is one of the most promising thanks to the fact that it allows to (i) run the cogeneration device for a longer time at higher average loads, (ii) reduce the electrical load peaking and subsequent network congestion and failure events, and (iii) profitably exploit the excess electrical production from renewable sources when the selling of the surplus electricity to the grid is not convenient.
Several papers [7-10] evaluating the performance of a micro-cogeneration device feeding an electric chiller are available in current literature. These studies have highlighted how the incorporation of electric chillers to the traditional micro-cogeneration scheme represents an efficient and economical alternative to traditional systems. However, most of the work were performed by using a theoretical/modelling approach based on steady-state manufacturer data at full-load operation, while neglecting the dynamic response of the units under part-load operation; in addition, the analyses were generally carried out only from an energy point of view without considering the operating/capital costs and the equivalent carbon dioxide emissions; finally, the operation of proposed micro-trigeneration schemes coupled with a residential multi-family house have never been analyzed [11].
In this paper, the energy feasibility of a micro-trigeneration system serving an Italian residential application for both heating/cooling purposes and domestic hot water production was investigated by means of dynamic simulations. The system under investigation was based on a natural gas-fuelled internal combustion engine cogeneration unit (with 6.0 kW as rated nominal electric output and 11.7 kW as rated nominal thermal output) for heating purposes during the winter and domestic hot water production during the whole year; auxiliary thermal energy was supplied by a natural gas-fired boiler. The cogeneration device, coupled with a combined storage tank, fed a 7.5 kW electric air-cooled water chiller for cooling purposes during the summer. The plant was coupled with a typical three-dwellings multi-family house located in Naples (south of Italy) compliant with the Italian Law in terms of the thermal transmittance values of both the walls and windows. The analysis was carried out by means of the dynamic simulation environment TRNSYS 17 [12]; this software is widely used in current literature to evaluate the energy performance of micro-cogeneration systems upon varying the operating scenarios [13-17]. A detailed model, calibrated and validated based on experimental results [18, 19], was used to simulate the micro-cogeneration device under heat load-following control strategy during both steady-state and transient operation; the simulation model for the electric chiller was calibrated based on manufacturer data. The transient nature of the building and occupant driven loads, as well as the updated Italian tariffs and incentives associated to both fuel consumption and electric energy purchased or fed to the grid were also taken into account. The primary energy consumption, the equivalent carbon dioxide emissions as well as the operating costs of the proposed system were evaluated based on the simulation results and compared with those associated to a conventional system composed based on separate energy production.
The Figure 1 shows the scheme of the system configuration analyzed in this study. The whole plant consists of a micro-cogeneration device (MCHP), an electric air-cooled water chiller (ACWC), an auxiliary boiler (BOILER), a combined storage tank (TANK) with three internal heat exchangers (IHE1, IHE2, IHE3), a plate-fin heat exchanger (PHE), four pumps (P1, P2, P3, P4), six thermostats (T1, T2, T3, T4, T5, T6), three 3-way valves (V1, V2, V3), three flow diverters (D1, D2, D3), and a group of fan-coils installed in the building. Four different main circuits can be easily distinguished in Figure 1: (1) micro-cogeneration device circuit; (2) natural gas-fired boiler circuit; (3) space heating/cooling circuit; (4) domestic hot water circuit.
Both the natural gas and electricity lines are also highlighted in Figure 1. The system under investigation is devoted to satisfying the space heating and cooling sensible loads, the domestic hot water (DHW) requirements and the electric demand of a multi-family house composed of three floors during the whole year. The heating purposes and domestic hot water demands are satisfied by heating up the water contained within the tank. The MCHP system and natural gas-fired boiler co-operate in order to guarantee a given water temperature level (55 °C) within the hot water storage. The group of fan-coils is supplied by the combined tank (used for both space heating purposes and domestic hot water production). According to the European Standard EN12831:2003 [20], 20 °C was assumed as the set-point indoor air temperature during heating period (from November 15th to March 31st). The cooling purposes are satisfied by the electric air-cooled water chiller. The ACWC operates in order to guarantee 26 °C as the set-point indoor air temperature during the cooling period (from April 1st to November 14th). The group of fan-coils is supplied by the combined tank during the winter, and by the ACWC during the summer. Domestic hot water is produced by means of the internal heat exchanger IHE3 located in the tank; in the case of the temperature of the water exiting IHE3 is lower than 45°C, the required additional heat is provided by the auxiliary natural gas-fired boiler and transferred to the domestic water by means of the plate heat exchanger PHE. The electricity generated by the cogeneration device is either used directly in the building for the ACWC, lighting systems, domestic appliances, auxiliaries or exported to the electric grid; the electric grid is also used to cover the peak demands. Each component of the whole system was simulated using the dynamic software TRNSYS 17 [12].
In the following sections the main features of each plant component are described in detail.
2.1 MCHP unit
The micro-cogeneration device is the model GECC60A2 (NR-P) commercialized by the AISIN SEIKI company [21]. The system is based on a natural gas-fuelled reciprocating internal combustion engine with three cylinders, four strokes and a total displacement of 952 cm3. The engine drives a synchronous generator to deliver electrical power up to a nominal value of 6 kWel; at the same time, the cogeneration unit allows to recover the heat otherwise dissipated by the engine with a nominal thermal output of 11.7 kWth.
The system can operate under both electric and thermal load following logics. In this paper, the proposed system was analysed by operating the MCHP device under thermal load-following control strategy. In this case, the system operates according to the external temperature signal coming from the thermostat T1 (Figure 1) placed on the tank near the exit of the internal heat exchanger IHE1: then this temperature is lower than the set-point value Tset,T1 (55°C), the unit provides its maximum electric and thermal outputs; when the water temperature in the storage exceeds the set-point value, the unit is turned off. Any unused excess of electricity is sent to the power line; the electric grid is used to cover the peak load. The MCHP unit was allowed to operate up to 24 hours per day depending on the thermal requirements.
The cogeneration unit was simulated by using the detailed dynamic model [22, 23] calibrated and validated for the AISIN SEIKI unit on the basis of several laboratory tests performed by the authors [18, 19].
Figure 1. Scheme of the proposed system analysed in this study.
2.2 ACWC
The air-cooled water chiller is the model CRA/K/SP 25 commercialized by the company CLINT [24]. The unit has a nominal cooling capacity of 7.5 kW, with a nominal power of the compressor equal to 2.4 kWel; it is equipped with a single rotary compressor and uses R410A as a refrigerant. The water circuit, in copper tubing, includes a storage tank (0.05 m3), water gauge, safety water valve, expansion vessel (0.002 m3), electrical pump P4, water differential pressure switch, manual air release valve, plant charge and discharge shut off valve. The refrigerant flowing into the ACWC thermally interacts with water at the evaporator side, and is condensed by means of an air flow at the condenser side.
The ACWC is activated when the indoor air temperature is greater than a given set-point value (26°C) for one of the three thermostats installed in the building (T4, T5, T6). During the summer, the hot water storage is bypassed, through the three-port valve V3, allowing the full ACWC output to be utilized for cooling purposes; otherwise the three-port valve V3 redirects the flow back to its usual route.
The ACWC unit was simulated by using Type655 available in TRNSYS 17 library.
2.3 Hot water storage
The combined tank for both heating purposes and domestic hot water production was modelled in this study by means of the Type60f included in TRNSYS 17 library. In this study, ten temperature levels (nodes) were used in the tank; a uniform tank loss coefficient per unit area equal to 3.0 kJ/hm2K was assumed [25].
A vertical cylindrical hot water storage unit (0.503 m3) [26] with one flow inlet (IF in Figure 1) and one flow outlet (OF in Figure 1) was considered: the cold water coming from the building enters the tank through the flow inlet IF, while hot water going towards the fan-coils installed within the building exits the tank through the flow outlet OF.
The tank was equipped with three internal heat exchangers: the hot water coming from the MCHP unit flows through the internal heat exchanger located in the lower part of the tank (IHE1 in Figure 1); the hot water coming from the natural gas-fired boiler goes towards the internal heat exchanger located in upper part of the tank (IHE2 in Figure 1); the third internal heat exchanger (IHE3 in Figure 1) allows heat to be extracted for the domestic hot water production.
2.4 Boiler
A 20.0 kWth natural gas-fired boiler [25] was considered in this study. The boiler was modelled in TRNSYS 17 by using the Type6 included in TRNSYS 17 library and assuming the efficiency values suggested by the manufacturer [25]. The auxiliary heater is activated only in the case of (i) the water temperature in the tank (sensed by the thermostat T2 in Figure 1) is lower than a given set-point value Tset,T2 (55°C), or when (ii) the domestic hot water temperature at the outlet of the internal heat exchanger IHE3 (sensed by the thermostat T3 in Figure 1) is lower than Tset,T2 (45°C). In the case of the temperature measured by thermostat T3 being lower than 45 °C, demand from the central heating is bypassed (through the three-port valve V1) allowing the full boiler output to be utilized for hot water through the plate heat exchanger PHE; otherwise, the three-port valve V1 redirects the boiler flow back to its usual route. A maximum daily operation time for the heating system was assumed [28]. In particular the boiler was allowed to operate only during the following time intervals: (i) week day: from 7:30 to 11:00 and from 15:00 to 21:30 and (ii) weekend: from 8:30 to 11:00 and from 15:00 to 22:30. Out of these periods, the boiler was turned off for heating purposes; the boiler was allowed to operate up to 24 hours a day in the case of thermal energy is required for producing domestic hot water at 45°C.
2.5 Building characteristics and loads
The geometrical layout of the building is basically a multiplication of a single family house type building geometry located in Naples. All three floors have the same useable floor area (96.0 m2), while the net height of each floor is 3.0 m; five windows were considered for each floor for a total area of 10.8 m2. The Italian standard code [29] specifies the threshold values of thermal transmittance for both walls and windows of new buildings depending on (i) the climatic zone where the building is located, and (ii) the wall type (external wall, ground and roof). In this study, the thermal transmittance values of the walls and windows are equated to the given threshold values required by the Italian standard code [28]: 0.40 W/m2K for the external walls; 0.38 W/m2K for the roof; 0.42 W/m2K for the ground and 2.6 W/m2K for the windows.
For each single flat, a single daily electric demand profile resulting from the operation of both lighting systems and other domestic appliances was assumed according to the reference values suggested in [30]. The daily electric demand profile for the whole building was generated through the superposition of three simplified daily single flat profiles. The electric demand profile considered in this study corresponds to an electric consumption for the whole building equal to about 109.7 Wh/m2 a day. Heat coming from occupants, personal computers and lighting systems was assumed to contribute to the internal gains. Sensible heat coming from each occupant (maximum four occupants for each single flat) was assumed equal to 75 W. The operation of one personal computer (providing 140W as sensible heat) was also considered for each single flat. Light sources with high luminous efficiency were assumed, with an installed total electric capacity of 294 W for each single flat; thermal power coming from each lighting system was considered equal to the 75% of its nominal electric capacity. The internal gains associated to occupants, personal computers and lighting appliances for the whole building were generated through the superposition of three single flat profiles. Sets of yearly load profiles for the domestic hot water demand in the time scales of 1 minute, 6 minutes, and 1 hour were specified within IEA-SHC Task 26 [31, 32]. Each set of load profiles contains profiles with different average basic load and different initial random values. In this study, the domestic hot water demand profile with an average basic load of 400 l/day in the time scale of 1 minute was used to estimate the domestic hot water demand of each single flat during the whole year. The number of interior volume air changes that occur per hour, induced by wind and stack effect on the building envelope, was assumed equal to 0.28 h-1 for each single flat according to the European Standard EN 12831:2003 [20].
In the following a conventional system composed of a natural gas-fired boiler (for thermal energy production), an electric air-cooled water chiller for cooling purposes [24] (the same ACWC used in the proposed system) and a power plant connected to the electric grid (for electricity production) is considered for the comparison with the proposed system (PS).
A 32.0 kWth boiler [27] was selected for the thermal energy production in the conventional system. A nominal thermal output of the boiler slightly larger than the maximum thermal output of the proposed system (31.7 kWth) was selected. The boiler efficiency of the conventional system was evaluated according to the manufacturer data [27]. Concerning the efficiency of the power plant connected to the national electric grid hPP, a figure of 0.461 was assumed: this value represents the power plant average efficiency in Italy, including transmission losses [33].
The simulation data were used to compare the performance of the proposed scheme with the conventional system from both energy, environmental and economic point of views by assuming for the conventional system the same energy output of the proposed system.
4.1 Energy analysis
The proposed system was firstly compared with the conventional system from an energy point of view. This energy comparison was performed by using the so-called Primary Energy Saving (PES):
$P E S=\frac{E_{p, T O T}^{C S}-E_{p, T O T}^{P S}}{E_{p, T O T}^{C S}}$ (1)
where $\mathrm{E}_{\mathrm{p}, \mathrm{TOT}}^{\mathrm{PS}}$ is the primary energy consumed by the proposed system and $\mathrm{E}_{\mathrm{p}, \mathrm{TOT}}^{\mathrm{CS}}$ is the primary energy consumed by the conventional system for supplying the same energy output of the proposed system. A positive value of PES indicates that the MCHP system allows for a primary energy saving in comparison to the conventional system.
The values of $\mathrm{E}_{\mathrm{p}, \mathrm{TOT}}^{\mathrm{PS}}$ and $\mathrm{E}_{\mathrm{p}, \mathrm{TOT}}^{\mathrm{CS}}$ indicated in the Eq. 1 were computed as reported below:
$E_{p, T O T}^{P S}=E_{p, M C H P}^{P S}+\frac{E_{t h, B}^{P S}}{\eta_{B}^{P S}}+\frac{E_{e l, b u y}^{P S}}{\eta_{P P}}$(2)
$E_{p, T O T}^{C S}=\frac{E_{t h, M C H P}^{P S}+E_{t h, B}^{P S}}{\eta_{B}^{C S}}+\frac{E_{e l, M C H P}^{P S}+E_{e l, b n y}^{P S}}{\eta_{P P}}$ (3)
where $\mathrm{E}_{\mathrm{p}, \mathrm{MCHP}}^{\mathrm{PS}}$ is the primary energy consumed by the cogeneration unit; $E_{\mathrm{th}, \mathrm{B}}^{\mathrm{PS}}$ is the thermal energy supplied by the boiler of the proposed system; $E_{\text { el,buy }}^{\mathrm{PS}}$ is the electric energy purchased from the national grid by the proposed system; $\mathrm{E}_{\mathrm{th}, \mathrm{MCHP}}^{\mathrm{PS}}$ is the thermal energy supplied by the cogeneration unit; $\mathrm{E}_{\mathrm{el}, \mathrm{MCHP}}^{\mathrm{PS}}$ is the electric energy supplied by the cogeneration unit; $\eta_{\mathrm{B}}^{\mathrm{PS}}$ and $\eta_{\mathrm{B}}^{\mathrm{CS}}$ represent, respectively, the boiler efficiency of the proposed system and the boiler efficiency of the conventional system suggested by the manufacturer [27]; $\eta_{\mathrm{pp}}$ is the power plant average efficiency in Italy, including transmission losses (assumed equal to 0.461 [33]).
The values of $\mathrm{E}_{\mathrm{p}, \mathrm{MCHP}}^{\mathrm{PS}}, \mathrm{E}_{\mathrm{th}, \mathrm{B}}^{\mathrm{PS}}, \mathrm{E}_{\mathrm{el}, \mathrm{buy}}^{\mathrm{PS}}, \mathrm{E}_{\mathrm{th}, \mathrm{MCHP}}^{\mathrm{PS}},$ and $\mathrm{E}_{\mathrm{el}, \mathrm{MCHP}}^{\mathrm{PS}}$ were calculated based on the simulation results.
4.2 Environmental analysis
The comparison between the proposed and conventional systems is also performed by assessing their environmental impact. With respect to this point, it should be highlighted that a comprehensive evaluation of micro-trigeneration technology should take into account also the impact due to the presence of plants spread over the territory that could increase the local pollution, in particular due to nitrogen oxides and carbon monoxide, and thus could worsen the local air quality [34]. A simplified approach is adopted in this paper by neglecting the local effects and performing the environmental comparison in terms of global carbon dioxide equivalent emissions based on the following formula:
$\Delta C O_{2}=\frac{C O_{2}^{c s}-C O_{2}^{p s}}{C O_{2}^{c S}}$(4)
The term $\mathrm{CO}_{2}^{\mathrm{PS}}$ represents the carbon dioxide equivalent emissions associated to the proposed system, while the term $\mathrm{CO}_{2}^{\mathrm{cs}}$ represents the carbon dioxide equivalent emissions associated to the system assumed as a reference. According to its definition, a positive value of DCO2 indicates that the system based on micro-trigeneration technology allows to reduce the carbon dioxide emissions in comparison to the conventional system. The assessment of the carbon dioxide equivalent emissions is carried out through an energy output-based emission factor approach [35]. According to this approach, the mass m of a given pollutant x emitted while producing the energy output E can be worked out as:
$m_{x}=\mu_{x}^{E} \cdot E$(5)
where $\mu_{\mathrm{x}}^{\mathrm{E}}$ is the energy output-based emission factor, that is, the specific emissions of x per unit of E. This factor depends upon several operating and structural variables, such as the specific equipment, partial load operation, age, state of maintenance, outdoor conditions, pollutant abatement systems, and so forth.
According to the values suggested in [17,36,37], in this study the CO2 emission factor associated to the natural gas consumption is assumed equal to 200 gCO2/kWhp: this value represents the equivalent CO2 emissions for a primary energy unit consumed by burning out natural gas. The average CO2 emissions for producing electricity depend on the technology mix adopted. Italy has a power generation system with no nuclear power and with about 20% hydro-electricity; the main part is thermal-based, with a mix of fuels from coal to oil. According to the values suggested in [17,36,37], in this work the CO2 emission factor for electricity production is assumed equal to 525 gCO2/kWhel: this value represents the equivalent CO2 emissions for an electric energy unit consumed with reference to the Italian scenario. According to the above-mentioned approach, the values of $\mathrm{CO}_{2}^{\mathrm{PS}}$ and $\mathrm{CO}_{2}^{\mathrm{cs}}$ can be calculated by means of the following formulas:
$C O_{2}^{P S}=\left(E_{p, M C H P}^{P S}+\frac{E_{t h, B}^{P S}}{\eta_{B}^{P S}}\right) \cdot \beta+E_{e l, b u y}^{P S} \cdot \alpha$(6)
$C O_{2}^{C S}=\left(\frac{E_{t h, M C H P}^{P S}+E_{t h, B}^{P S}}{\eta_{B}^{C S}}\right) \cdot \beta+\left(E_{e l, M C H P}^{P S}+E_{e l, b u y}^{P S}\right) \cdot \alpha$(7)
where $\alpha$ is the CO2 emission factor for electricity production and $\beta$ represents the CO2 emission factor associated to the natural gas consumption.
4.3 Economic analysis
The comparison between the proposed in this paper, the operating costs due to both natural gas and electric energy consumptions were evaluated in detail according to the Italian scenario; the revenue from selling the electric energy surplus was also taken into account.
The operating costs of both the proposed system and the conventional system, respectively, were calculated by using the following formulas and assuming the same energy output for both systems:
$O C^{P S}=C U_{n g, M C H P} \cdot \frac{E_{p, M C H P}^{P S}}{L H V_{n g} \cdot \rho_{n g}}+C U_{n g, B} \cdot \frac{E_{t h, B}^{P S}}{\eta_{B}^{P S} \cdot L H V_{n g} \cdot \rho_{n g}}$$+C U_{e l, b u y} \cdot E_{e l, b u y}^{P S}-C U_{e l, s e l l} \cdot E_{e l, s e l l}^{P S}$(8)
$O C^{C S}=C U_{n g, B} \cdot \frac{E_{t h, M C H P}^{P S}+E_{t h, B}^{P S}}{\eta_{B}^{C S} \cdot L H V_{n g} \cdot \rho_{n g}}$$+C U_{e l, b u y} \cdot\left(E_{e l, M C H P}^{P S}+E_{e l, b u y}^{P S}\right)$(9)
where CUng,MCHP is the unit cost of natural gas consumed by the cogenerator; CUng,B is the unit cost of natural gas consumed by the boiler; LHVng is the lower heating value of natural gas (assumed equal to 49599 kJ/kg); rng is the density of natural gas (assumed equal to 0.72 kg/m3); CUel,buy is the unit cost of the electric energy purchased from the national central grid; CUel,sell is the unit cost of the electric energy sold to the national central grid; $\mathrm{E}_{\mathrm{el}, \mathrm{sell}}^{\mathrm{SP}}$ is the electric energy sold to the national central grid by the proposed system.
In Italy, the total unit cost of natural gas for residential applications [33] depends on both the region of Italy where the natural gas is consumed as well as the level of cumulated natural gas consumption. In addition it should be highlighted that the excise tax is lower for cogenerative use in comparison to applications other than combined heat and power production taking into account that micro-cogeneration system would require a higher investment for the user.
Three different types of incentive were adopted by the Italian government for MCHP units to be financially feasible [38]:
Regarding the operating cost of the electric energy, a simplified analysis has been performed by assuming the following unit costs according to the Italian scenario:
The operating costs of the proposed system were compared with those of the conventional system by using the following parameter:
$\Delta O C=\frac{O C^{C S}-O C^{P S}}{O C^{C S}}$(10)
A positive value means that the conventional system is characterized by larger operating costs in comparison to the proposed system, and so the proposed system is more convenient from an economic point of view.
In the following, the comparison between the proposed and conventional systems is also performed in terms of the Simple Pay Back (SPB) period; this indicator represents the number of years required to recover the initial investment cost and is calculated as follows:
$S P B=\frac{C C^{P S}-C C^{C S}-G C G}{O C^{C S}+M C^{C S}+T W C-O C^{P S}-M C^{P S}}$(11)
where CCPS is the capital cost of the MCHP unit (18,000 € [21]), the ACWC unit (2,700 €) [24], the boiler (1,700 €) [27] and the hot water storage tank (3,000 €) [26] of the proposed system; CCCS is the capital cost of the ACWC unit (2,700 €) [24] and the boiler (2,200 €) [27] of the conventional system; GCG is the Government Capital Grants on the capital cost of the MCHP unit [38]; TWC is the Tradable White Certificates [39]; MCPS is the yearly maintenance cost of both the MCHP unit and the boiler of the proposed system; MCCS is the yearly maintenance cost of the boiler of the conventional system.
The AISIN SEIKI unit [21] is characterized by a scheduled maintenance every 10,000 hours, with a maintenance cost of about 0.016 €/kWhel [21]; a maintenance cost equal to 80.0 €/year was assumed for the boilers [27].
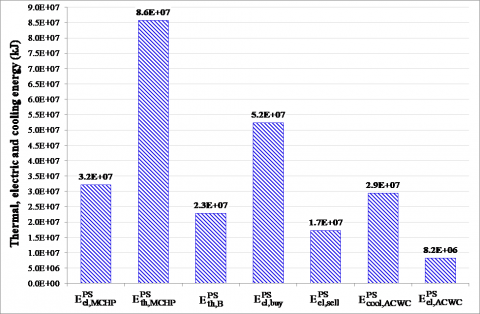
The most important simulation data and the results of comparison between the proposed system and the conventional system are reported and commented in detail in this section. Figure 2 shows the thermal, electric and cooling energy flows associated to the proposed system with reference to the whole year. This figure highlights that:
Figure 2. Values of thermal, electric and cooling energies for the proposed system during the whole year.
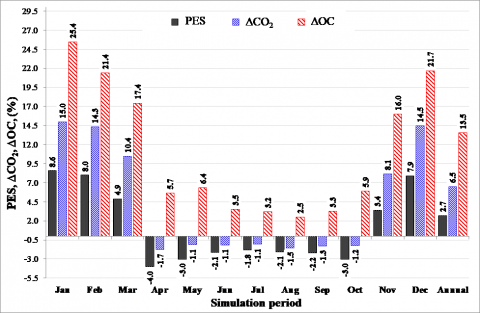
Figure 3. Values of PES, DCO2 and DOC as a function of the simulation period.
Figure 3 compares the performance of the proposed system with those associated to the conventional system. The comparison has been performed from energy, environmental and economic point of views by assuming that the conventional system is producing the same thermal output ($E_{\mathrm{th}, \mathrm{MCHP}}^{\mathrm{PS}}+\mathrm{E}_{\mathrm{th}, \mathrm{B}}^{\mathrm{PS}}$) and electric output ($\mathrm{E}_{\mathrm{el}, \mathrm{MCHP}}^{\mathrm{PS}}+\mathrm{E}_{\mathrm{el}, \mathrm{buy}}^{\mathrm{PS}}$) of the proposed systems. Figure 3 reports the values of PES (Eq. 1), DCO2 (Eq. 4) and DOC (Eq. 10) as a function of the simulation period. This figure highlights how:
The proposed system allows to recover the larger investment cost associated to the proposed system thanks to the reduced operating costs in comparison to the conventional system. The estimation of time the proposed system will take to recover the larger capital costs thanks to the reduction of operating costs in comparison to the reference system can be performed by calculating the simple pay-back period according to the Eq. 11.
The value of the SPB calculated based on the manufacturer data and simulation results is about 15 years. This period is quite long mainly due to the large capital cost of the micro-cogeneration unit (18,000 €).
In the present paper, the yearly operation of a building-integrated micro-trigeneration system was investigated by means of transient simulations. Simulations were performed for the whole year with 1-min simulation time step, by considering a multi-family house located in Naples (south of Italy) compliant with the Italian Standards in terms of the transmittance values of both walls and windows. The transient nature of building and occupant driven loads, the part-load characteristics of the trigeneration system, the interaction between the loads and the system output and system energy management were considered in the analysis. The simulation data were used to compare the performance of the proposed system were compared with those of a conventional system based on separate energy production from energy, environmental and economic point of views.
The main results of the comparison can be summarized as follows:
[1] Directive 2004/8/EC of the European Parliament and of the Council of the 11 February 2004 on the promotion of cogeneration based on the useful heat demand in the internal energy market and amending Directive 92/42/EEC, Official Journal of the European Union, 2004.
[2] Biserni, C. and Garai, M., “Energy balance and second law analysis applied to buildings: an opportunity for Bejan’s theory,” Int. J. Heat & Technol., vol. 34, no. Special Issue 1, pp. S185-S187, 2016. DOI: 10.18280/ijht.34S125.
[3] Mazzeo, D., Matera, N., Bevilacqua, P., Arcuri, N., “Energy and economic analysis of solar photovoltaic plants located at the university of Calabria,” Int. J. Heat & Technol., vol. 33, no. 4, pp. 41-50, 2015. DOI: 10.18280/ijht.330406.
[4] Final Report of Annex 42 of the International Energy Agency’s Energy Conservation in Buildings and Community Systems Programme, an Experimental and Simulation-based Investigation of the Performance of Small-scale Fuel Cell and Combustion-based Cogeneration Devices Serving Residential Buildings, 2008.
[5] Sonar, D., Soni, S. L. and Sharma, D., “Micro-trigeneration for energy sustainability: technologies, tools and trends,” Appl. Therm. Eng., vol. 71, no. 2, pp. 790-796, 2014. DOI: 10.1016/j.applthermaleng.2013.11.03.
[6] Rosato, A., Sibilio, S. and Ciampi, G., “Energy, environmental and economic dynamic performance assessment of different micro cogeneration systems in a residential application,” Appl. Therm. Eng., vol. 59 no. 1-2, pp. 599-617, 2013. DOI: 10.1016/j.applthermaleng.2013.06.022.
[7] Cooper, S. J. G., Hammond, G. P., McManus, M. C., Ramallo-Gonzlez, A. and Rogers J. G., “Effect of operating conditions on performance of domestic heating systems with heat pumps and fuel cell micro-cogeneration,” Energy Build., vol. 70, pp. 52-60, 2014. DOI: 10.1016/j.enbuild.2013.11.077.
[8] Malinowska, W. and Malinowski, L., “Parametric study of exergetic efficiency of a small-scale cogeneration plant incorporating a heat pump,” Appl. Therm. Eng., vol. 23, no. 4, pp. 459-472, 2003. DOI: 10.1016/S1359-4311(02)00216-8.
[9] Mancarella, P., “Cogeneration systems with electric heat pumps: energy shifting properties and equivalent plant modelling,” Energy Convers. Manage., vol. 50, no. 8, pp.1991-1999, 2009. DOI: 10.1016/j.enconman.2009.04.010.
[10] Smith, M. A. and Few, P. C., “Modelling of a domestic-scale co-generation plant thermal capacitance considerations,” Appl. Energy, vol. 68, no. 1, pp. 69-82, 2001. DOI: 10.1016/S0306-2619(00)00042-8.
[11] Ciampi, G., Rosato, A., Scorpio, M. and Sibilio, S., “Experimental analysis of a micro-trigeneration system composed of a micro-cogenerator coupled with an electric chiller,” Appl. Therm. Eng., vol. 73, no. 1, pp. 1309-1322, 2014. DOI: 10.1016/j.applthermaleng.2014.09.018.
[12] Solar Energy Laboratory, TRNSYS, A transient system simulation program, Tech. rep., University of Wisconsin, Madison, USA, 2004.
[13] Ciampi, G., Rosato, A. and Sibilio, S., “Yearly operation of a building-integrated microcogeneration system in south Italy: energy and economic analyses,” Int. J. Low Carbon Technol., vol. 9, no. 4, pp. 331-346, 2014. DOI: 10.1093/ijlct/ctt074.
[14] Ciampi, G, Rosato, A, Scorpio, M. and Sibilio, S., “Energy performance of a residential building-integrated micro-cogeneration system upon varying thermal load and control logic,” Int. J. Low Carbon Technol., vol. 11, no. 1, pp. 75-88, 2016. DOI: 10.1093/ijlct/ctt075.
[15] Rosato, A., Sibilio, S. and Ciampi, G., “Dynamic performance assessment of a building-integrated cogeneration system for an Italian residential application,” Energy Build., vol. 64, pp. 343-358, 2013. DOI: 10.1016/j.enbuild.2013.05.035.
[16] Rosato, A., Sibilio, S. and Scorpio, M., “Dynamic performance assessment of a residential building-integrated cogeneration system under different boundary conditions, Part I: Energy analysis,” Energy Convers. Manage., vol. 79, pp. 731-748, 2014. DOI: 10.1016/j.enconman.2013.10.001.
[17] Rosato, A., Sibilio, S. and Scorpio, M., “Dynamic performance assessment of a residential building-integrated cogeneration system under different boundary conditions, Part II: environmental and economic analyses,” Energy Convers. Manage., vol. 79, pp. 749-770, 2014. DOI: 10.1016/j.enconman.2013.09.058.
[18] Rosato, A. and Sibilio, S., “Calibration and validation of a model for simulating thermal and electric performance of an internal combustion engine-based micro-cogeneration device,” Appl. Therm. Eng., vol. 45–46, pp. 79–98, 2012. DOI: 10.1016/j.applthermaleng.2012.04.020.
[19] Rosato, A. and Sibilio, S., “Energy performance of a micro-cogeneration device during transient and steady-state operation: experiments and simulations,” Appl. Therm. Eng., vol. 52, no. 2, pp. 478–491, 2013. DOI: 10.1016/j.applthermaleng.2012.12.028.
[20] [18] EN 12831:2003. Heating systems in buildings - Method for calculation of the design heat load.
[21] AISIN SEIKI, TECNOCASA CLIMATIZZAZIONE, <www.tecno-casa.com/EN/Default.aspx?level0=prodotti&level1=mchp> (retrieved on 12/03/2015).
[22] N. Kelly and I. Beausoleil-Morrison, “Specifications for modeling fuel cell and combustion-based residential cogeneration devices within whole-building simulation programs,” IEA/ECBCS Annex 42 report; 2007. ISBN No. 978-0-662- 47116-5.
[23] Ferguson, A., Kelly, N., Weber, A. and Griffith, B., “Modelling residential-scale combustion-based cogeneration in building simulation,” J. Build. Perform. Simul., vol. 2, no. 1, pp. 1-14, 2009. DOI: 10.1080/19401490802588424.
[24] Clint, <http://www.clint.it/index.php?m¼00&m2¼01&lang¼en> (retrieved on 12/04/2014).
[25] Calise, F., “Thermoeconomic analysis and optimization of high efficiency solar heating and cooling systems for different Italian school buildings and climates,” Energy Build., vol. 42, no. 7, pp. 992–1003, 2010. DOI: 10.1016/j.enbuild.2010.01.011.
[26] CORDIVARI, <http://www.cordivari.it/product.aspx?id=2gid=137lng=0> (retrieved on 12/03/2015).
[27] Vaillant, <http://www.vaillant.co.uk/> (retrieved on 12/03/2015).
[28] Decree of President of Italian Republic n.412/93 <http://efficienzaenergetica.acs.enea.it/doc/dpr412-93.pdf> (retrieved on 12/03//2015).
[29] Italian Decree n. 311/06 <http://www.artechint.com/attestato-energetico.pdf> (retrieved on 12/03/2015).
[30] Richardson, I., Thomson, M., Domestic electricity demand model - simulation example, Loughborough University’s Institutional Repository, <http://hdl.handle.net/2134/5786> (retrieved on 12/03/2015).
[31] <http://sel.me.wisc.edu/trnsys/trnlib/library15.htm#IEA26Load> (retrieved on 12/03/2015).
[32] <http://sel.me.wisc.edu/trnsys/trnlib/iea-shc-task26/iea-shc-task26-load-profiles-description-jordan.pdf> (retrieved on 12/03/2015).
[33] Italian Regulatory Authority for Electricity and Gas, <www.autorita.energia.it> (retrieved on 12/03/2015).
[34] Angrisani, G., Rosato, A., Roselli, C., Sasso, M., Sibilio, S. and Unich, A., “Influence of climatic conditions and control logic on NOx and CO emissions of a micro-cogeneration unit serving an Italian residential building,” Appl. Therm. Eng., vol. 71, no. 2, pp. 858-871, 2014. DOI: 10.1016/j.applthermaleng.2013.12.037.
[35] Chicco, G. and Mancarella, P., “Assessment of the greenhouse gas emissions from cogeneration and trigeneration systems, Part I: Models and indicators,” Energy, vol. 33, no. 3, pp. 410-417, 2008. DOI: 10.1016/j.energy.2007.10.006.
[36] Intergovernmental Panel on Climate Change, Working Group III. Data on carbon dioxide intensities, <http://arch.rivm.nl/env/int/ipcc/pages_media/SROC-final/Tables/t0305.pdf> (retrieved on 20/12/2012).
[37] Mancarella, P. and Chicco, G., “Assessment of the greenhouse gas emissions from cogeneration and trigeneration systems, Part II: Analysis techniques and application cases,” Energy, vol. 33, no. 3, pp. 418-430, 2008. DOI: 10.1016/j.energy.2007.10.006.
[38] Arteconi, A., Brandoni, C. and Polonara, F., “Distributed generation and trigeneration: Energy saving opportunities in Italian supermarket sector,” Appl. Therm. Eng., vol. 29, no. 8-9, pp. 1735-1743, 2009. DOI: 10.1016/j.applthermaleng.2008.08.005.
[39] GSE, <http://www.gse.it/it/Qualifiche%20e%20certificati/Certificati%20Bianchi%20e%20CAR/Pages/default.aspx> (retrieved on 12/03/2015).
[40] GSE, <http://www.gse.it/it/Ritiro%20e%20scambio/Ritiro%20dedicato/Pages/default.aspx> (retrieved on 12/03/2015).