OPEN ACCESS
With the growing concern for environmental protection, many countries commit to mitigate the climate change and to reduce the global warming associated with carbon dioxide emissions. Global efforts to reduce greenhouse gas (GHG) emissions have led to the adoption of a series of climate protection programs. In Europe an integrated policy on climate protection has been structured in conformity with the guidelines of the Plan 20 20 20, contained in Directive 2009/29/EC. Specifically, as emerged from the fifth Assessment Report of the International Panel for Climate Change (IPCC), a strong contribution on greenhouse gas emissions results from cities. In this regard, the European Parliament Resolution OJ 2010/C349E/16 promotes initiatives based on energy efficiency and renewable sources, as well as smart distribution networks in urban areas. A detailed knowledge of the urban energy demand plays an important role in order to develop strategies for the implementation of efficient energy management plans. For this purpose, the proposed paper aims at developing a mathematical model derived from the complex network theory and able to represent the energy demand of an urban area. Moreover, the structural properties of the obtained network are highlighted through the degree centrality measure.
(Presented at the AIGE Conference 2015)
Energy mapping, Complex networks, Cities, Climate change.
Climate change and global warming represent serious threats fundamentally associated with energy consumption and GHG emissions.
The residential sector, representing the 67% of energy consumption (IEA, 2008) and the 71% of CO2 emissions (IPCC, 2013), has a considerable role in tackling climate change [1, 2]. Therefore, the European Commission has launched several initiatives to address this problem [3, 4], as the well-known Plan 20 20 20 [5], oriented towards the implementation of mitigation measures and adaptation strategies.
Energy use in cities has been the subject of significant research in recent years. However, such a broad topic inevitably results in a great number of interpretations of the problem dealing with the energy demand estimation in a built environment [6] or with the urban planning and policy [7, 8]. Anyway, in order to define energy efficiency measures, a proper action plan has to develop planning strategies. From this viewpoint, an appropriate energy audit allows the definition of urbanization trajectories and urban forms of modern cities. Therefore, energy models considering the efficiency in the use of sources and the minimization of GHG emissions are considering for the energy planning of cities.
In this context, a detailed knowledge of the energy demand in urban areas plays an important role in order to develop efficient energy management plans. Considering the modern cities as complex systems and, in particular, as networks where nodes represent significant structures of the city (depending on the level of the description, buildings, agglomerates of buildings, street intersections and so on may be considered), the energy flows are represented as interactions and connections between the network nodes [9]. Moreover, the structural properties of networks, considered as one of the main topic in the field of complex network analysis, can be transferred to the concept of cities as networks. Among all the structural properties analyzed in literature, one of the most relevant is centrality [10]. The centrality quantifies the importance of the each node among the rest of nodes.
Models for handling ways in which interactions relate to energy use in urban areas are barely emerged [11]. Thus, the aim of this paper is to develop a flexible tool for the characterization of the energy profile of an urban area. The proposed mathematical tool is based on the network theory and permits proper scenario analysis for the definition of energy planning strategies focused on the installation of cogeneration systems and in favor of renewable sources. Moreover, a deeper characterization of the network structure is obtained through the centrality measure.
The developed mathematical model is based on the complex networks theory [10]. Graph theory is the formalism adopted for the mathematical treatment of complex networks [12]. Considering the city as a complex network, the urban area is divided into connected municipalities characterized by an energy profile and represented with the aid of a graph. In the developed model, nodes represent the municipalities and edges are transmission lines. In particular, the nodes indicate points of consumption and potentially points of production of electrical energy.
A graph $G=(V, L)$ consists of two set $V$ and $L$ , such that $V=\{0, \ldots, N\}$ are the nodes of the graph $G$ , while $L=\{(i, j): i, j \in V, i \neq j\}$ are its arcs. Nodes are pairwise joined by an arc. A graph can be visually represented by drawing a dot for each node; two dots are joined by a line if the corresponding nodes are connected by a link. A graph can be completely described by its adjacency matrix $A$ , i.e. a $N x N$ square matrix defined as
$a_{i j}=\left\{\begin{array}{c}1, \text {if the link } l_{i j} \text { exists} \\ 0, \text { otherwise }\end{array}\right.$ (1.1)
In the model, a weighted matrix to account for the direction of the flow is used, so that $l i j=-l j i$ .
For each node of the graph, the following assumptions are formulated. Every node is connected directly to the node 0. More specifically, node 0 represents the power plant and is hereinafter called central node. A node $i$ , being $i=1, \dots, N$ , in addition to the connection to the node 0, can also be linked to a node $j$ , with $i \neq j$ . Each node $i$ , being $i \in V-\{0\}$ is characterized by two energy quantities, i.e. the electrical demand Edi expressed in kWh and the electrical autonomous production Egi due to the exploitation of renewable energy sources or to the installation of combined heat and power systems. Relatively to node 0, Ed0=0. The production of a node $i$ aims, firstly, to meet its energy demand Edi. Hence, the energy profile of the node can be represented by the value of the surplus parameter
$S_{i}=E_{g_{i}}-E_{d_{i}}$ (1.2)
If $S_{i}>0$ , the node $i$ has an electrical surplus that can be allocated in the network and consequently node $i$ is a source node. Opposite is the case for $S_{i}<0$ in which the node behaves as a destination node as it has fulfilled only partially its electrical demand and has therefore to interact with the network in order to purchase electricity. Finally, for the condition $S_{i}=0$ the node could met its energy demand through its autonomous production.
The weighted adjacency matrix is constructed starting from the unweighted one and taking into account the sign of $S_{i}$ . In fact, the sign of $a_{i j}$ depends on the nature of the energy exchange between the node i and the node j, and is indicated by the direction on the arc. In this model, the convention has been chosen to assume $a_{i j}=+1$ if the energy flow is ingoing toward the node destination and $a_{i j}=-1$ if the energy flow is outgoing from the node source. The condition $a_{i j}=0$ indicates no connection between node i and node j. With regard to the interaction, the model is built in order to favor the purchase of electricity from the nodes and only subsequently from the central node.
The total output of the central node must be able to satisfy the remaining electrical demand of the nodes. This assumption is expressed as follows.
$P_{C N}=\sum_{j=1}^{N} a_{0 j} l_{0 j}$ (1.3)
The proposed mathematical model is solved using Matlab [13] on a 4 GB dual core 2.20 GHz personal computer.
The described procedure has been tested for the municipality of Catania, a city in southern Italy with about 300,000 inhabitants. According to the regulation of the municipality of Catania [14], the urban area has been subdivided into 6 districts. Table 1 provides the total inhabitants and the yearly electrical energy demand, calculated considering a medium energy demand of $3 \mathrm{kWh} /$day $\cdot$ person [15]. In Table 1, node 0 represents the central node corresponding to the power plant. The central node has a nil energy demand, as explained in the previous paragraph.
Table 1. Inhabitants, energy demand and energy surplus for all nodes of the network representing the municipalities of Catania
|
Nodes |
Inhabitants |
Demand [MWh/y] |
Production [%] |
Energy Generation [MWh/y] |
Energy Surplus [MWh/y] |
|
0 |
- |
0 |
|
|
|
|
1 |
48334 |
52925,73 |
0% |
0 |
-52925,73 |
|
2 |
66887 |
73241,27 |
30% |
21972,38 |
-51268.89 |
|
3 |
44205 |
48404,48 |
10% |
4840.45 |
-43564,03 |
|
4 |
37831 |
41424,95 |
20% |
4142,50 |
-37282,45 |
|
5 |
43011 |
47097,05 |
10% |
4709,70 |
-42387,35 |
|
6 |
53190 |
58243,05 |
130% |
75715,97 |
17472,92 |
According to the existing configuration of the electricity grid, each node is connected to the central node as a star-like configuration. Therefore, the electricity demand of each node $i$ , being $i=1, \ldots, N$ , is entirely satisfied by the central node.
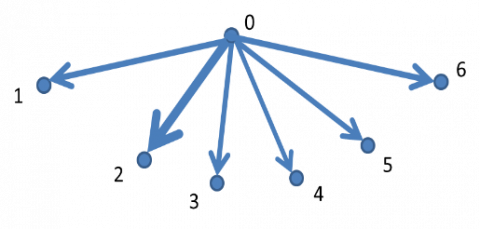
The study compares the energy flows for a network with a star-like configuration, as depicted in Figure 1 a), and for a network with a connection pattern where changes among the network nodes are allowed, as reported in Figure 1 b). The thickness of the arcs in Figure 1 a) and b) depends on the amount of energy that flows among the nodes. To a major electricity flow corresponds a thicker link.
a)
b)
Figure 1. a) Network with the star-like configuration of the municipality of Catania; b) Network where changes among nodes are allowed
In order to apply the mathematical procedure developed in this paper, the following assumptions are formulated. Nodes are linked on the ground of a connection pattern exposed in Table 2.
Table 2. Connection pattern
|
Connection pattern |
||
|
0 |
↔ |
1 |
|
0 |
↔ |
2 |
|
0 |
↔ |
3 |
|
0 |
↔ |
4 |
|
0 |
↔ |
5 |
|
0 |
↔ |
6 |
|
1 |
↔ |
6 |
|
2 |
↔ |
3 |
|
2 |
↔ |
4 |
|
5 |
↔ |
6 |
The model activates the links able to transfer electricity in the direction subjected to the established convention, i.e. from a source node to a destination node and, if necessary, drawing electricity from the central node. The resulting network is shown in Figure 1 b). Each node is characterized by a certain percentage of electricity generation capacity and once the internal energy demand is satisfied, each node may assume two different behaviors according to the sign of its energy surplus $S_{i}$ . If the node has a positive surplus indicated by (+), then it is configured as a source node, vice versa it is configured as a destination node and characterized by the (–) sign. The details of electricity production and of energy surplus are reported in Table 1.
The comparison between the real network and the modeled network shows a strong reduction of electricity flows on each arc. Specifically, the connection among nodes permit the decrease of energy demand at the expend of the central node.
In order to characterize the structural properties of the obtained network, the calculus of the centrality of each node is carried on. Centrality is a measure of the relevance of a node of the network. Despite the fact that there are several centrality measures in literature, the degree centrality is considered in this paper. The degree centrality measures the number of edges attached to each node and is calculated as
$C_{d}(i)=\sum_{j=1}^{N} a_{i j}$ (1.4)
A node with high degree centrality is characterized by several connections and is therefore considered as “important”.
Degree centrality for a directed graph may assume two forms. The former is the in-degree centrality and relates to the number of arcs that are ingoing the node. The latter is the out-degree centrality and is calculated as the totality of arcs that are outgoing the node. In this paper, the out-degree centrality is taken into account. In fact, regarding node 0 the out-degree centrality is important in order to determine the total amount of the electrical production of the power plant that is critical in order to reduce greenhouse gases emissions. On the other hand, a node i presenting a high out-degree is able to transmit electricity, i.e. is able to produce electricity by the exploitation of renewable sources. For all these reasons, the out-degree centrality is a critical measure in order to define if the whole network is efficient from the energetic point of view.
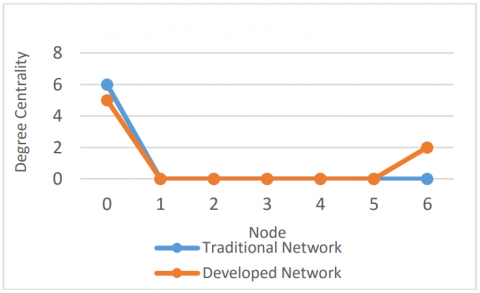
Fig. 2 shows how the degree centralities of each node in the star-like configuration and after the application of the developed mathematical procedure.
Figure 2. Degree Centrality for the standard configuration and after the application of the mathematical procedure
As can be noticed from Fig. 2, the centrality of node 0 decreased from 6 to 5, and the centrality of node 6 increases from zero up to 2. With regard to node 0 the decrease of the degree centrality confirms the reduction of GHG emissions, in fact the electrical demand referred to the power plant is lower. Instead, concerning node 6 the increase of the degree centrality is a measure of the installation of cogeneration systems or of the exploitation of renewable sources, as recommend by the Plan 20 20 20. The other nodes do not present changes in the out-degree centrality.
In this paper the energy mapping of the urban energy flows is studied through the implementation of the network theory in order to permit a scenarios analysis for the elaboration of energy strategies for the promotion and installation of cogeneration systems and in favor of renewable sources.
A flexible tool was developed in order to characterize the energy profile of an urban area and the validity of the proposed model was tested within the municipality of Catania. The developed model is able to define the interactions between nodes and allows the formulation of the urban energy trajectory relatively to the energy demand of each district. Moreover, the obtained network has been characterized from the structural point of view, by emphasizing the degree centrality for each node.
Further in-depth analysis are necessary in order to involve the heat demand of each district and to determine a criterion according to which nodes choose their connections, as for example a cost and environmental criterion. Further direction of the research could refer to the description of how networks may change over time or to analyze scenarios when node or arcs are added or deleted.
1. Fifth Assessment Report, AR5, available at http://www.ipcc.ch/report/ar5/index.shtml
2. Lindseth G., “The cities for climate protection campaign (CCPC) and the framing of local climate policy,” Local Environment, Vol. 9, No. 4, 325 – 336, August 2004.
3. European Commission act COM (2014) 689.
4. European Parliament Resolution OJ 2010/C349E/16.
5. Directive 2009/29/EC.
6. Eskin N., Türkmen H., “Analysis of annual heating and cooling energy requirements for office buildings in different climates in Turkey,” Energy and Buildings, 40 (2008), 763 – 773. DOI: 10.1016/j.enbuild.2007.05.008.
7. Hutchinson E. et al., “Can we improve the identification of cold homes for targeted home energy-efficiency improvements?” Applied Energy, 83 (2006), 1198–1209. DOI: 10.1016/j.apenergy.2006.01.007.
8. Rylatt M. et al., “Using GIS to estimate the replacement potential of solar energy for urban dwellings,” Environment and Planning B: Planning and Design, 30 (2003), 51–68. DOI: 10.1068/b12931.
9. Batty M., “Building a science of cities,” Cities, 29 (2912) S9–S16. DOI: 10.1016/j.cities.2011.11.008.
10. Newman M.E.J., Networks an Introduction, Oxford University Press 2010.
11. Batty M., “Cities as flows, cities of flows,” Environmental and Planning B: Planning and Design, 2011, volume 38, pp. 195–196. DOI: 10.1068/b3802ed.
12. Boccaletti S. et al., “Complex networks: structure and dynamics,” Physics Reports, 424 (2006), 175–308. DOI: 10.1016/j.physrep.2005.10.009.
13. Trial version available at https://it.mathworks.com
14. Data available at www.comune.catania.it
15. Data available at www.autorita.energia.it