OPEN ACCESS
Biomass is an alternative source to fossil fuels as proven by the increase of the primary energy production of 6.1% between 2012 and 2013. In European countries, the biomasses are 3.5% of renewable energy sources and they have a strategic role to reach the objective established by the European Directive 2009/28/CE. However, it is necessary to increase the use of renewable fuels, as syngas and biogas, to satisfy the objectives of the UE in the field of renewable energies and greenhouse gas emissions. The gasification and pyrolysis processes to produce syngas are promising technologies for a practical use of the biomass. In this context, gasification of biomass from agro-forestry activities is considered among the most effective sustainable technologies to recover waste that otherwise would be difficult to dispose. The micro-CHP electrical and thermal power were calculated through a balance of mass and energy based on an input-output model of the overall system. The results of this study demonstrated that it is possible to produce thermal and electrical energy for small agro-industries through the valorization of the residuals biomass deriving by their activities.
(Presented at the AIGE Conference 2015)
Biomass, CHP, Energy performance.
Agricultural and forestry residues can be suitably recovered to produce electrical and thermal energy; otherwise, they have to be processed as wastes [1, 2, 3].
The energy production from the biomass, based on short rotation forestry and other agricultural activities or energy crops, can significantly contribute to reach the target of reduction of greenhouse emissions and restrict the phenomenon of climate changes [4, 5].
The gasification process of biomass allows the production of syngas which is mainly composed of CO, CO2, CH4, H2 e N2 [6], and its specific composition depends on the fuel source and process technology. The substantial variation of the composition and of the lower heating value (LHW) are among main barriers to the use of syngas. The drawback is the low thermal power obtainable using fuels with relatively modest values of LHW. The low thermal heating value of syngas could be partially balanced by turbo-charging engine or other specific technologies [7]. Micro-CHP (Combined Heat and Power) plants, with power of 0÷100 kWel, are realized coupling a reciprocating Internal Combustion Engine (ICE) equipped with a thermal recovery and an electrical generator, which allow the contemporary production of electrical and thermal energy. Several studies and applications have proven that micro-CHP plants fed with syngas have electrical and thermal efficiency respectively in the ranges 20÷25% and 45÷55% [8, 9]. The same plants fueled with natural gas are characterized by an electrical efficiency that varies in the range 25÷28% [10]. Other studies in literature have highlighted that ICE fed with syngas have useful power lower than those fed with natural gas (NG) due to relatively low values of LHV of syngas [8, 9, 10, 11]. Moreover, it is necessary increase the airflow during the combustion process to minimize the reduction of effective power [12, 13, 14]. The ICE fueled with syngas need of an index of excess air (λ) with values variable between 1.25 e 2.50 [7]. In this study, it was evaluated the efficiency of a micro-CHP plant (Pel <100 kWel) that consists of a commercial spark ignition engine fed continuously and at full load with syngas obtained through the gasification of olive kernel. The biomass, specifically olive kernel, was characterized in laboratory for determining the moisture content, ash, volatiles and fixed carbon. A calorimeter was used for measuring the heating value of the biomass. At the downstream of the gasifier, it is necessary install a clean-up system of the syngas in order to remove the impurity and to achieve a fuel gas that is compatible with a commercial ICE.
Moreover, this study proposes a methodology to evaluate the electrical and thermal efficiency, the Energy Utilization Factor (EUF) and the greenhouse gas reductions obtainable from the micro-CHP plant fueled with the produced syngas.
This study was developed within the research project PON02_00451_3362376 named BIO4BIO.
2.1 Gasification process
The gasification process is the thermal conversion of organic materials at elevated temperature and reducing conditions to produce primarily permanent gases, with char, water, and condensable gases as minor products [15, 16].
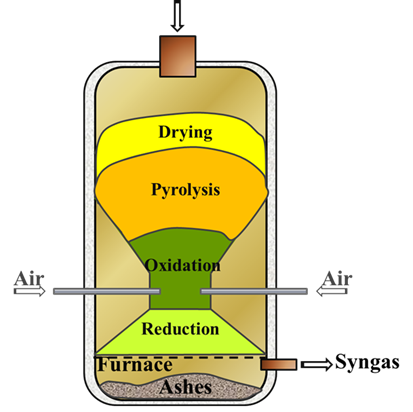
It is a complex and sensitive process, which depends by the chemical composition and moisture content of the biomass; mass flow and temperature of oxidant; temperature and pressure during the process; heating rate; gasifier design and so on. Between the different technologies of gasifier, the downdraft gasifier (Figure 1) is particularly attractive thanks to its ability for producing a syngas with a very low tar content (1%) in comparison with other gasification technologies.
Figure 1. Downdraft gasifier.
The biomass, introduced into the gasifier reactor, is initially subject at the process of drying and pyrolysis. At this stage, the reactor temperature reaches values between 200°C and 500°C so the moisture content of biomass is converted in steam. During this process, char, tar and other volatile species such as CO, CO2, H2, and CH4 are formed. Then, such products flowing in the combustion-reduction zone of the gasifier, where temperatures around 1000°C are reached. At this stage there is the production of ash, char and syngas, which is composed mainly by CO, CO2, H2, CH4, N2 and H2O. Thermodynamic balance models allow to predict with sufficient accuracy the chemical composition of the syngas produced through a downdraft gasifier. Usually, thermodynamic models are based on the following assumptions:
•gasifier operates in steady-state conditions at pressure of 101.13 kPa;
•permanence time of the vapors into the gasifier is sufficient to reach chemical balance in adiabatic conditions;
•air is supplied in dry conditions at temperature of 25°C and pressure of 101.13 kPa;
•ash are inert materials and the produced gas is an ideal gas composed by CO, CO2, H2, CH4, H2O, N2 and tar.
2.2 Mathematical model
In accordance with the previously mentioned assumptions, the overall gasification reaction of one mole of biomass is expressed as follows:
$C H_{h} O_{o} N_{n}+w H_{2} O+a\left(O_{2}+3.76 N_{2}\right) \rightarrow x_{1} H_{2}+x_{2} C O+x_{3} C O_{2}+x_{5} C H_{4}+x_{6} N_{2}+x_{t a r} t a r+x_{c h a r} c h a r$ (1)
Where: “h”, “o” and “n” are the number of atoms of hydrogen, oxygen and nitrogen; “w” is the moles number of H2O; “a” is the moles number of air incoming in the gasifier; the terms “x1,..6”, on the right of the (Eq. 1), indicate the moles number of the chemical components of the produced gas; “xtar” and “xchar” indicate respectively the produced moles number of tar and char.
The unknown quantities of the reaction (1) are the numbers of moles “xi”, from x1 to x5, since nitrogen is considered inert and tar and char moles are input parameters of the model. Considering that also the equilibrium temperature (T) is unknown, globally we have six unknown quantities that can be determined solving a system of six equations. Three mass balance equations; two equations for the equilibrium constants, k1 and k2, of the chemical reactions taken in account; one equation of the gasifier energy balance.
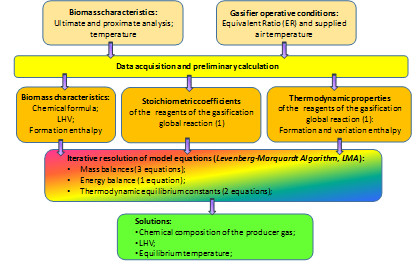
A mathematical model has been developed in Matlab that allows the iterative resolution of those six equations.
Figure 2 shows the algorithm scheme of the numerical model developed in Matlab environment.
Figure 2. Matlab resolution scheme of the developed model
The numerical model of the gasification process was validated comparing the results of the simulation with experimental data [17].
3.1 Chemical and physical characterization
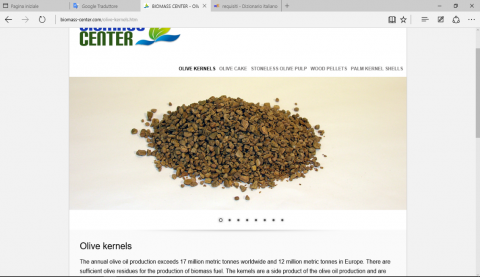
The milling technologies associated with the olive production generate several wastes. Olive kernel and pomace are the residues, which come from processes and treatments of olive oil extraction. Therefore, it is a very interesting challenge exploiting those wastes for producing a syngas and, subsequently of both thermal and electrical energy through a micro-CHP plant [18]. Overall, such process allows reducing the dependence by conventional fuels [17, 18] the agro-industries sector. Figure 3 shows a sample of olive kernel obtained as wastes of agro-industrial processes of the olive oil.
Figure 3. Sample of olive kernel
The laboratory analysis conducted on the sample of olive kernel allowed to obtain its chemical-physical properties. The physical features and chemical composition of the olive kernel are reported in tables 1 (proximate analysis) and 2 (ultimate analysis).
Table 1. Proximate analysis (% weight)
|
Moisture |
7.9 |
wt%wb* |
UNI EN 14774-3 |
|
Ash |
0.4 |
wt%db* |
UNI 14775 |
|
Volatile matter (db) |
77.4 |
wt%db |
UNI 15148 |
|
Ash fusion |
>1500 |
°C |
- |
|
Lower Heating Value (LHV) |
19.31 |
MJ/kg |
UNI EN 14918 |
*wb=Wet basis;**db=dry basis.
Table 2. Ultimate analysis (% weight, DB)
|
C |
51.3 |
wt%db |
UNI 15104 |
|
H |
5.94 |
wt%db |
UNI 15104 |
|
N |
0.3 |
wt%db |
UNI 15104 |
|
S |
0.0 |
wt%db |
UNI EN 15289 |
|
O |
42.06 |
wt%db |
Calculated |
The composition and characteristics of syngas were determined using the calculation code processed in Matlab [17] and they are reported in table 3.
Table 3. Syngas characteristics
|
M(kg/kmole) |
ρn(kg/Nm3) |
LHV(MJ/kg) |
ER |
|||||
|
23.46 |
1.05 |
5.16 |
0.21 |
|||||
|
Syngas Composition (% Molar fraction) |
||||||||
|
H2 |
CO |
CH4 |
CO2 |
N2 |
H20 |
|||
|
13.6 |
22.4 |
3.2 |
6.5 |
37.9 |
16.31 |
|||
The syngas exiting the gasifier has to be subjected to a cooling and cleaning process, before to enter in the ICE as well to be suitably depurated, filtered and condensed in order to remove the impurities that are contained in it.
The condensed tar is partly deposited on surface of the piping of the heat exchangers system-causing fouling consequently it is a potential problem if the syngas has to be compressed, as it may settle in the compressor. Particulate matter, inert solids such as char, ash and sand, produced from gasification process, also have a damaging effect on the parts and organs moving. The syngas quality requirements for ICE are less strict than the ones for gas turbines (GT) [6, 21, 22, 23]. The products of the gasification reaction, which worsen the operation of the engine and the related systems of cleaning, are:
•Char: The engine manufacturers have established that the syngas has to have a char content up 50 mg/m3 [24] consequently bag filter, cyclone, evaporative towers are used to remove the particulate matter contained in the syngas;
•Tar: The maximum permissible content of tar is 50÷100 mg/m3 in the produced gas [25]. The system frequently used is the washing with water that allows to decrease the temperature of syngas in order to cause the condensation of the hydrocarbons contained in the syngas until to their complete removal. The components used for this process are the scrubbers which exploit the direct contact between syngas and water.
For the syngas cleaning are provided the following devices: heat exchanger as temperature reducer, multicyclone dry, bag filter, and scrubber.
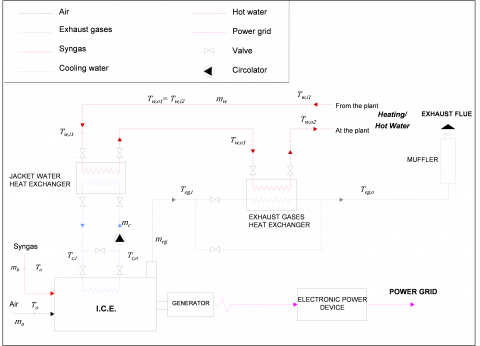
The micro-CHP unit is based on a spark ignition engine fed by the produced syngas. The plant has a circuit of heat recovery on a secondary circuit of heating. Two heat exchangers placed in series with the internal combustion engine constitute the section of heat recovery as depicted in the plant layout in Figure 4.
Moreover, plant layouts that adopt two independent circuits to recover the heat by the exhaust gases and jacket cooling system, can be adopted. In the proposed layout, the engine is cooled with a pipe heat exchanger while the enthalpy content in the exhaust gas is recovered with a plate heat exchanger. The thermal power effectively recoverable from the plant depends on the technology of engine, efficiency and surfaces of the heat exchangers system [26].
The production of electrical energy is achieved connecting the crankshaft to a three-phase generator that converts the DC current in AC current and it is transferred to the distributed electric grid at frequency of 50 Hz by an inverter. The electric generator is switched on angular velocity of the rotor above 1500 (rpm).
Figure 4. Layout of the micro-CHP plant
4.1 Pollutant emissions
The concentration of combustion products as CO, NOx, SOx, and HCl depends by the syngas composition. A syngas with high concentrations of CO and H2 reduces the probability of CO emissions [27]. One of the three formation modes of NOx, “Prompt NOx”, occurs in conditions of rich mixture of fuel, gas at high concentration of CH4, when the N2 reacts with active carbons. The other two processes of formation are “thermal NOx” and “combustible NOx”, as reported in [28].
Hydrogen and carbon monoxide, contained in the syngas, require a high temperature of burning which facilitates the thermal formation of NO and NO2. On the contrary, high temperatures favor the complete combustion and reduce the emissions of volatile organics mainly consisting by low fractions of hydrocarbons. The particulate matter, metallic compounds and other undesirable pollutants are usually removed before that the syngas is burned to produce electrical and thermal energy.
4.2 Operative parameters
The performance of the micro CHP plant were evaluated under the operative parameters reported in table 4.
Table 4. Parameters of gasifier
|
Operative parameters |
|
Unit |
|
p |
1.013 |
bar |
|
Tg |
1000÷1200 |
°C |
|
MC |
< 20% |
- |
|
ṁbio |
120 |
kg/h |
|
LHVsyn |
5.16 |
MJ/kg |
|
ρsyn |
1.05 |
kg/Nm3 |
Further, the technical features of a commercial ICE model Cummins G855G [29] were used in the following calculation. (see table 5) .
Table 5. Data sheet of the engine model
|
Technical data ICE |
Unit |
|
|
Engine model |
- |
Cummins G855G |
|
No. of cylinder |
- |
6 Cylinder |
|
Aspiration |
- |
Natural |
|
Bore x Stroke |
mm |
140 x 152 |
|
Cylinderdisplacement volume |
l |
2.33 |
|
Total displacement |
l |
14 |
|
Engine output prime (Natural gas) |
kW |
125 |
|
Engine speed |
rpm |
1500 |
|
Compression ratio |
- |
12 |
|
Engine strokenumber |
- |
4 |
|
No. of turns of the crank |
- |
2 |
Under stoichiometric combustion, the air-fuel ratio (αs) is equal to 1.43 (kga/kgb), and it is significantly lower than the one of the natural gas (17.0 kga/kgb). Consequently, the specific power per unit of air-fuel mixture decreases [30].
Therefore, considering a process of complete combustion and adiabatic conditions an increase of excess air (EA) reduces the flame maximum temperature and the NOx emissions [31].
We have assumed an index of EA equal to 1.90 since it is within the range suggested for the syngas combustion that ranges between 1.6- 2.5 [31, 32]. The adoption of such value of EA (1.90) determines an air-fuel ratio (α) of 2.72 (kga/kgb).
The characteristics of syngas and the operative conditions previously mentioned for the micro-CHP plant do not involve substantial variations for the engine but it is necessary increase the nozzles section of intake-air and the exhaust gases. These changes are necessary to satisfy the flows of syngas and air that assume higher values than the ones of the natural gas during the combustion [33].
The higher value of LHV of natural gas (46÷50 MJ/kg) compared to syngas involves that thermal power produced by syngas is lower than that natural gas for the same fuel flow rate. To achieve the same thermal power, it is necessary to consider the following ratio:
$\frac{\dot{m}_{syn}}{\dot{m}_{C H_{4}}}=\frac{L H V_{C H_{4}}}{L H V_{syn}}=5 \div 10$ (2)
In order to characterize the behavior and the performance of the engine, we have calculated the effective power (Pe), varying the air-fuel ratio (α), ratio between the volume air-intake and the volume of generated air (λv) and engine speed (1500 - 2400 rpm). All the calculations were carried out considering the engine runs continuously and fully loaded. The effective power (Pe) was calculated using the following expression:
$P_{e}=\eta_{u} \lambda_{V} \frac{\rho_{a} Z V_{u}}{\alpha} L H V_{s y n} \frac{n_{g}}{\varepsilon}$ (3)
Where ηu is useful efficiency; λv is ratio between taken air and generated air; Z is number of cylinder; Vu is cylinder displacement volume; ns is the number of crank rounds; ρa is air density, ε=T/2 is the number of the crank rounds for cycle.
4.3 Energy balances
The thermodynamic model used for the energy analysis of the micro-CHP system is based on the 1st principle of the thermodynamic. The engine operates according to the Otto cycle and it has a mechanical work expressed as difference between expansion work and compression work. The authors used the equation reported in [34] with the assumption that the inlet temperatures of syngas and combustion air are coincident with the outdoor air temperature.
The input and output power were calculated using the equations of energy balance [35].
In table 6 are reported data used in the energy model of the micro-CHP with an electric power of 70 kWel. The cooling water flow rate (ṁc) was assumed equal to 16,000 (kg/h) according to the technical characteristics of the engine manufacturer [29].
Table 6. Operative data
|
Parameter |
Unit |
Value |
|
To, Tsyn, Ta |
°C |
20 |
|
Tc,i |
°C |
85 |
|
Tc,u |
°C |
90 |
|
Tw,i1 |
°C |
55 |
|
ṁsyn |
kg/h |
246 |
|
αs |
kga/kgb |
1.43 |
|
λ |
- |
1.90 |
|
α |
kga/kgb |
2.72 |
|
ṁa |
kga/kgb |
668 |
The mechanical power (Pm) available at the crankshaft was calculated with the Eq. (4) under the following assumptions: heat losses in combustion chamber (Qd) and mechanical losses for friction (Qm) were assumed equal to 7% and 5% of the input power [36]; the losses due to the lubrication oil circuit (Qo) represent 6% of the input power [36].
$\begin{aligned} P_{m} &=\dot{m}_{s y n} L H V_{s y n}-\dot{m}_{c} c_{p, c} \Delta T_{c}-\dot{m}_{e g} c_{p, e g} \Delta T_{e g} -\dot{Q}_{d}-\dot{Q}_{o}-\dot{Q}_{m} \end{aligned}$ (4)
where:
ṁc is the cooling water mass flow rate
cp,c is the specific heat of the cooling water
∆Tc is the difference between inlet and outlet temperature of cooling water
ṁeg is the exhaust gases mass flow rate
cp,eg is the specific heat of exhaust gases
∆Teg is difference between inlet and outlet temperature of exhaust gases.
The electric power (Pel) was calculated considering an efficiency of electric generator of the 96%. In Table 7 are reported the input and output powers of the internal combustion engine (ICE).
Table 7. Input and output powers
|
Parameter |
Unit |
Value |
Percentage (%) |
|
Qsyn |
kW |
351.70 |
100 |
|
Qeg |
kW |
121.08 |
34 |
|
Qc |
kW |
93.33 |
27 |
|
Qd |
kW |
25.00 |
7 |
|
Qo |
kW |
20.00 |
6 |
|
Qm |
kW |
18.00 |
5 |
|
Pm |
kW |
74.23 |
21 |
|
Pel |
kW |
71.26 |
20 |
Globally, the engine reaches an electrical efficiency of 20% that is lower of the efficiency of the same engine fueled with natural gas, which has values of 25÷28%. The thermal power recovered by the heat exchangers of exhaust gases and water cooling are reported in the table 8. These thermal powers were calculated adopting an efficiency for the heat exchanger (εHX) equal to 85%. The water flow rate to provide to the users (ṁw) was established equal to 10,000 (kg/h), in order to guarantee the typical operating conditions of an engine.
Table 8. Recovery thermal power
|
Heat exchanger |
Parameter |
Unit |
Value |
|
Cooling water |
Pth,c |
kW |
79.33 |
|
Tw,u1 |
°C |
65 |
|
|
Exhaust gases |
Pth,eg |
kW |
92.15 |
|
ṁeg |
kg/h |
913 |
|
|
Tw,u2 |
°C |
75 |
|
|
Teg,i |
°C |
450 |
|
|
Teg,o |
°C |
122 |
The micro-CHP plant can recover a thermal power (Pth) of 79.33 and 92.15 (kWth) respectively from the cooling water and exhaust gases.
The electric characteristic of the micro-CHP system expressed as ratio between electric efficiency (20%) and thermal efficiency (48%) is equal to 0.41. The energy utilization factor (EUF) [37] is calculated as follow:
$E U F=\frac{\dot{P}_{e l}+\dot{P}_{t h}}{\dot{m}_{s y n} L H V_{s y n}}=0.68$ (5)
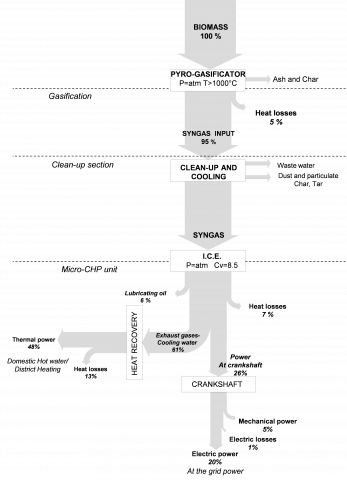
The Sankey diagram (Figure 5) illustrates the input and the output of energy flux for different subsystems of thermal energy, normalized to 100%, coming from the combustion of the syngas in the micro-CHP system.
Figure 5. Sankey diagram of the micro-CHP plant
4.4 Gasification efficiency
The gasification efficiency is defined as efficiency of cold gas (ηCG) and it is achieved by the ratio between the energy of the syngas and the energetic potential of the biomass. This ratio depends on the lower heating value (LHV) of both fuels, rate of biomass consumption (ṁbio) and flow rate of syngas exiting from the gasifier (ṁsyn) [19].
$\eta_{C G}=\frac{L H V_{s y n} \dot{m}_{s y n}}{L H V_{b i o} \dot{m}_{b i o}}$ (6)
In Table 9, are reported the flow-rate of biomass and syngas respectively incoming and exiting from the downdraft gasifier, the indicators of production and efficiency of cold gas of the gasifier. It is possible to achieve a performance of gasification of 60% with a flow rate of syngas of 246 (kg/h) incoming to the engine, if it is used a flow rate of biomass of 120 (kg/h) into the gasifier.
Table 9. Production and efficiency of gasification
|
Air volumetric flow rate
|
Va |
98 |
m3/h |
|
Air mass flow rate |
ṁa |
126 |
kg/h |
|
Rate of biomass consumption |
ṁbio |
120 |
kg/h |
|
Volumetric flow rate of syngas |
Vsyn |
234 |
m3/h |
|
Mass flow rate of syngas |
ṁsyn |
246 |
kg/h |
|
Volumetric ratio of syngas production |
|
1.95 |
m3syn/kgbio |
|
Mass ratio of syngas production |
|
2.05 |
kgsyn/kgbio |
|
Estimated power |
|||
|
olive kernel |
Qbio,in |
643 |
kW |
|
syngas |
Qsyn |
393 |
kW |
|
Efficiency of cold gas |
ηCG |
60 |
% |
In this part of the study, the comparison between the molar fractions of CO2 contained in the exhaust gases of the engine supplied with syngas respect to an engine supplied with natural gas or propane is developed. The volume fractions of the combustion products were calculated knowing the mole number of CO2 and others products using the following simplified equation both under conditions of direct combustion of biomass and under condition of combustion of syngas.
$y_{C O_{2}}=\frac{n_{C O_{2}}}{n_{C O_{2}}+n_{H_{2} O}+n_{N_{2}}}$ (7)
The following emissions were obtained:
•16% of carbon dioxide (CO2);
•65% of nitrogen (N2);
•18% of water (H2O) according to molar composition of the exhaust gases.
These values represent the volume fraction of the combustion products and consequently the ideal values of exhaust gases coming from the combustion of the syngas. The results reported in table 10 show the energy production per kg of olive kernel after direct combustion.
The results of this comparison highlight that the CO2 produced per unit of energy from biomass is greater than that produced by the combustion of propane or natural gas.
However, it is necessary to highlight that the emissions of CO2 derived from the engine supplied with natural gas and propane totally contribute at the increase of greenhouse gas in the atmosphere. Otherwise, the emissions of CO2 derived from the engine supplied with the syngas produced by the processes of thermochemical conversion of the biomasses, have to be cut by the aliquot of CO2 taken out of the atmosphere during the phase of growth of the biomasses itself.
Table 10. Emission rate of co2 for olive kernel, natural gas and propane
|
|
Olive kernel (kg) |
Natural gas (Stdm3) |
Propane (Nm3) |
|
|
|
combustion |
gasification |
combustion |
|
|
MJ·per unit of fuel |
19.31 |
5.16 |
35.88* |
25.53* |
|
gCO2·per unit of fuel |
1,798 |
602 |
1,891* |
1,510* |
|
gCO2·MJ-1 |
93 |
116 |
50* |
59* |
*Data provided by the Agency of Energy Efficiency of the Québec (EEA, 2009)
The direct combustion of olive kernel provides a higher emission rate of CO2 per unit of fuel compared the gasification (about 66%), on the contrary the emissions per unit of energy are lower compared to the gasification of the same biomass (about 20%). Besides, the particle matter, metallic compounds and others undesirable pollutants are usually removed before that the syngas is burned to produce electrical and thermal energy.
The aim of this paper is provide information on the production of electrical and thermal energy achievable from a micro-CHP plant fueled with syngas. In particular, it was adopted a syngas produced by short rotation forestry and others agricultural activities related to olive kernel. The chemical composition of the syngas was obtained using a calculation model based on the equations of the thermodynamic balance. The syngas produced has a LHV equal to 5.16 MJ/kg against a LHV of the biomass of 19.31 MJ/kg. The energy productions were calculated considering a commercial internal combustion engine model Cummins G855G that uses an index of excess air equal to 1.90.
Globally, the micro-CHP plant achieves the following coefficients of performance: Electrical Efficiency equal to 20%; Thermal Efficiency equal to 48%; Energy Utilization Factor (EUF) equal to 0.68. The analysis of the greenhouse gas emissions shows that the emissions produced by the syngas combustion are more of two order greater than the ones of natural gas or propane combustion. However, the environmental balance is positive because the CO2 derived from the engine supplied with natural gas and propane totally contribute at the increase of greenhouse gas in the atmosphere. Otherwise, the emissions of CO2 derived from the engine supplied with the syngas produced by the processes of thermochemical conversion of the biomasses, have to be cut by the aliquot of CO2 taken out of the atmosphere during the phase of growth of the biomasses itself.
|
cp,a |
Specific heat of the air |
J/(kg K) |
|
cp,c |
Specific heat of the cooling water |
J/(kg K) |
|
cp,w |
Specific heat of the water |
J/(kg K) |
|
cp,eg |
Specific heat of the flue gases |
J/(kg K) |
|
MC |
Moisture content of biomass |
- |
|
ṁa |
Mass flow rate of combustion air |
kg/h |
|
ṁbio |
Mass flow rate of biomass |
kg/h |
|
ṁe,g |
Exhaust gases mass flow rate |
kg/h |
|
ṁc |
Cooling water mass flow rate |
kg/h |
|
ṁsyn |
Syngas mass flow rate |
kg/h |
|
ṁw |
Mass flow rate of the water to the users |
kg/h |
|
n |
Mole number |
- |
|
ns |
Rounds number |
- |
|
LHV |
Lower Heating Value |
MJ/kg |
|
Pe |
Effective Power |
kW |
|
Pel |
Electric power |
kW |
|
Pth,eg |
Thermal power recovered from of the exhaust gases |
kW |
|
Pth,c |
Thermal power recovered from jacket water heat exchanger |
kW |
|
Qbio,in |
Thermal power of the biomass incoming to the gasifier |
kW |
|
Qd |
Heat losses throughthe engine |
kW |
|
Qeg |
Thermal power in the exhaust gases |
kW |
|
Qm |
Mechanical losses |
kW |
|
Qo |
Thermal losses through oil lubrication |
kW |
|
Qc |
Thermal power provided by the cooling water |
kW |
|
Qsyn |
Thermal power of the syngas |
kW |
|
Ta |
Inlet temperature of the air to the engine |
°C |
|
To |
Outdoor air temperature |
°C |
|
Tsyn |
Inlet temperature of the syngas |
°C |
|
Teg,i |
Inlet temperature of the exhaust gas |
°C |
|
Teg,o |
Outlet temperature of exhaust gas |
°C |
|
Tc,i |
Inlet temperature of cooling water |
°C |
|
Tc,o |
Outlet temperature of the cooling water |
°C |
|
Tg |
Gasification temperature |
°C |
|
Tw,i |
Outlet temperature of the water from heat exchangers |
°C |
|
T |
Number of the times of crank shaft |
- |
|
V |
Total displacement |
l |
|
Vsyn |
Syngas volume flow rate |
m3/h |
|
Va |
Air volume flow rate |
m3/h |
|
Vu |
Cylinder displacement volume |
l |
|
Z |
Number of cylinder |
- |
|
Greek symbols |
||
|
αs |
Stoichiometric ratio of air-fuel mixture |
kga/kgb |
|
α |
Air-fuel ratio |
kga/kgb |
|
λ |
Index of excess air |
- |
|
λV |
Ratio between taken air and generated air |
- |
|
ε |
Number of turns of the crank |
- |
|
εHX |
Heat exchangers efficiency |
- |
|
ηel |
Electric efficiency |
- |
|
ηgen |
Efficiency of electric generator |
- |
|
ηCG |
Cold gas efficiency |
- |
|
ηu |
Useful efficiency |
- |
|
ρa |
Air density |
kg/Nm3 |
|
ρsyn |
Syngas density |
kg/Nm3 |
|
Subscripts |
||
|
a |
air |
|
|
c |
cooling |
|
|
el |
electrical |
|
|
eg |
exhaust gases |
|
|
i |
inlet |
|
|
o |
outlet |
|
|
th |
thermal |
|
|
syn |
syngas |
|
1. International Energy Agency, World Energy Outlook 2000, IEA, Paris, 2000.
2. A. Deimbras, “Biomass resource facilities and biomass conversion processing for fuels and chemicals,” Energy Conversion and Management, vol. 42, pp. 1357-1358, 2001. DOI: 10.1016/S0196-8904(00)00137-0.
3. M. Deimbras, “Hydrogen from various biomass species via pyrolysis and steam gasification processes,” Energy Sources, Part A: Recovery, Utilization, and Environmental Effects, vol. 28, pp. 245-252, 2006. DOI: 10.1080/009083190890003.
4. International Energy Agency (IEA), CO2Emissions from Fuel Combustion 2011e Highlights. www.iea.org/publications/free_new_Desc.asp?PUBS_ID¼2450,2011.
5. IEA bioenergy, “The role of bioenergy in greenhouse gas mitigation,” Position paper, IEA Bioenergy, New Zealand, 1998.
6. A.V. Bridgwater, “The technical and economic feasibility of biomass gasification forpower generation,” Fuel, vol. 14(5), pp. 631-653, 1995. DOI: 10.1016/0016-2361(95)00001-L.
7. F. Yohaness Hagos, A. Rashid, A. Aziz, A. Shaharin, and A. Sulaiman, “Effect of air-fuel ratio on the combustion characteristics of syngas (H2:CO) in direct-injection spark-ignition engine,” The 6th International Conference on Applied Energy,Energy Procedia, vol. 61, pp. 2567-2571, 2014. DOI: 10.1016/j.egypro.2014.12.047.
8. A. Zabaniotou, P. Mitsakis, D. Mertzis, S. Tsiakmakis, P. Manara, and Z. Samaras, “Bioenergy technology: Gasification with internal combustion engine application,” The Mediterranean Green Energy Forum 2013, Energy Procedia, vol. 42, pp. 745–753, 2013. DOI: 10.1016/j.egypro.2013.11.077.
9. Catolog of CHP Technologies, Technology Characterization–Reciprocrating Internal combustion Engines U.S. Environmental Protection Agency Combined Heat and Power Partnership, Sep. 2014.
10. D. Vera, B. De Mena, F. Jurado and G. Schories, “Study of a downdraft and gas engine fueled with olive oil industries wastes,” Applied Thermal Engineering, vol. 51, pp. 119-129, 2013. DOI: 10.1016/j.applthermaleng.2012.09.012.
11. F. Y. Hagos, A. R.A. Aziz and A. Shaharin Sulaiman, “Study of syngas combustion parameters effect on internal combustion engine,” Asian Journal of Scientific Research, vol. 6(2), pp. 187-196, 2013. DOI: 10.3923/ajsr.2013.187.196.
12. R.A.M. Boloy, J.L. Silveira, C.E. Tuna, C.R. Coronado and J.S. Antunes, “Ecological impacts from syngas burning in internalcombustion engine: Technical and economic aspects,” Renewable and Sustainable Energy Reviews, vol. 15, pp. 5194–5201, 2011. DOI:10.1016/j.rser.2011.04.009.
13. E. Monteiro, M. Bellenoue, J. Sotton and A. Rouboa, “Syngas application to spark ignition engine working simulations by use of rapid compression machine.” DOI: 10.5772/48088.
14. D. Mertzis, P. Mitsakis, S. Tsiakmakis, P. Manara, A. Zabaniotou and Z. Samaras, “Performances analysis of a small scale combined heat and power system using agricultural biomass residues: The SMART-CHP demonstration project,” Energy, vol. 64, pp. 367-374, 2014. DOI: 10.1016/j.energy.2013.11.055.
15. J.D. Martínez, K. Mahkamov, R.V. Andrade and E. Silva Lora, “Syngas production in downdraft biomass gasifiers and its application using internal combustion engines,” Renewable Energy, vol. 38, pp. 1-9, 2012. DOI: 10.1016/j.renene.2011.07.035
16. F. Centeno, K. Mahkamov, E. Silva Lora and R.V. Andrade, “Theoretical and experimental investigations of a downdraft biomass gasifier-spark ignition engine power system,” Renewable Energy, vol. 37, pp. 97-108, 2012. DOI: 10.1016/j.renene.2011.06.008.
17. A. Gagliano, F. Nocera, F. Patania, M. Bruno, D. Castaldo, L. Falqui, “Stoichiometric thermodynamic equilibrium model of a downdraft gasifier,” IREC Conference, Sousse, 2015.
18. F. Patania, A. Gagliano, F. Nocera and A. Galesi, “Feasibility study of biogas in CHP plant for a pig farm,” Renewable Energy & Power Quality Journal, 1-5, 2012.
19. P. Basu, Biomass Gasification and Pyrolisis, in Elsevier (ed.), Practical Design and Theory, Academic Press, Burlington (USA), 2010.
20. H. Spliethoff, Power Generation from Solid Fuels, Springer, München (Germany), 2010.
21. P. Hasler and T. Nussbaumer, “Gas cleaning for IC engine applications from fixed bed biomass gasification,” Biomass and Bioenergy, vol. 16, pp. 385-395, 1999. DOI: 10.1016/S0961-9534(99)00018-5.
22. H.L. Iversen and B. Gobel, “Update on gas cleaning technologies, in H.A.M. knoef (ed.),” Handbook Biomass Gassification, Enschede, 2005.
23. A. Faij, R. Van Ree, L. Waldheim, E. Olsson, A. Oudhuis, A. Van Wijk, C. Daey-Ouwens, W. Turkenburg, “Gasification of biomass wastes and residues for electricity production,” Biomass and Bioenergy, vol. 12, pp. 387-407, 1997. DOI: 10.1016/S0961-9534(97)00010-X.
24. WBG120_GAS70_Cummins_G855G_scheda_tecnica.pdf.
25. M. Baratieri, P. Baggio, B. Bosio, M. Grigiante and G.A. Longo, “The use of biomass syngas in IC engines and CCGT plants: A comparative analysis,” Applied Thermal Engineering, vol. 29, pp.3309-3318, 2009. DOI: 10.1016/j.applthermaleng.2009.05.003.
26. www3.nd.edu/~powers/ame.50531/.../casiano.pdf.
27. K.J. Whitty, H.R. Zhang and E.G. Eddings, “Emissions from syngas combustion,” Combustion Science and Technology, vol. 180(6), pp.1117-1136, 2008. DOI: 10.1080/00102200801963326.
28. S. Van Loo and J. Koppejan, The Handbook of Biomass Combustion and Co-Firing, Earthscan, London; Sterling VA, 2008.
29. Cummins Power Generation (2009), www.planbfirst.com/May%202009%20Updates/SpecSheet/Gas%20125%20spec.pdf.
30. Sridhar G., P.J. Paul and H.S. Mukunda, “Biomass derived producer gas as a reciprocating engine fuel: An experimental analysis,” Biomass and Bioenergy, vol. 21, pp. 61–72, 2001. DOI: 10.1016/S0961-9534(01)00014-9.
31. P. Quaak, H. Knoef and H.E. Stassen, A Review of Combustion and Gasification Technologies, World Bank, Energy from Biomass, Washington D.C., 1999.
32. L.M. Dion, M. Lefsrud, V. Orsat and C. Cimon, “Biomass gasification and syngas combustion for greenhouse CO2 enrichment,” BioResources, vol. 8(2), pp. 1520–1538, 2013. DOI: 10.15376/biores.8.2.1520-1538.
33. R. Ebrahimi, D. Ghanbarian and M.R. Tadayon, “Performance of an Otto engine with volumetric efficiency,” J. Am. Sci, vol. 6(3), pp. 27-31, 2010.
34. J.B. Heywood, Internal combustion engine fundamentals, McGraw Hill, 1988.
35. M.J. Moran and H.N. Shapiro, Fundamentals of Engineering Thermodynamics, Wiley & Sons, 2006.
36. Motori a C.I. 1 Bilancio termico e raffreddamento 20090521_Raffreddamento _MC1.pdf.
37. J.H. Horlock, Thermodynamics and Economics, Pergamon Press, 1987.