OPEN ACCESS
Depleted uranium will be stainless if a small amount of niobium was added into it, and niobium has good solubility in the γ-phase uranium. Upon cooling, it undergoes phase transformation. U-Nb alloys which is near the monotectoid have a finally martensitic (α") phase at room temperature if the content percent of niobium is from 5 to 8 w.t.%. First principles calculations have been performed to study how the niobium (Nb) atom defects into the γ-uranium and crystal structure of U-12.5 at% Nb alloy. Using DFT calculations, the authors find that the substitutional sites prefer to be occupied by Nb atoms thermodynamically in the γ-phase U. Furthermore, the crystal structure of U-12.5 at% Nb alloy is a monoclinic structure (α"), and the electronic structures characteristic reveals that the electron interactions between Nb atoms and U atoms in the alloy are mainly dominated by 4d orbital of Nb atom and 5f, 6d orbitals of U atom.
Uranium niobium alloy; DFT; Defect; Crystal structure.
The first-principles has been widely used to investigate the material properties of uranium (U) in recent decades. Uranium was firstly discovered and used in applications and its atomic weight is the largest in nature which locating in the important transiting site from light actinide elements (Ac - Np) to heavy actinide elements (Pu - Lr). In the uranium atomic configuration (5f 36d17s2), it has three 5f electrons and its electronic structure is dominated by the states of 5f electrons in a large part. Near the Fermi energy, the states of 5f electron hybridize with states of 6d, 7s electrons. This might be the source interaction that leads to the exotic structure of uranium crystal and complex ways of forming uranium compounds [1].
Uranium has a very rich phase diagram. It is well known that uranium exists in three solid phases: α, β, and γ. The α phase has an orthorhombic structure, and there are 4 atoms in its conventional unit cell, with an appearance of face-centered-cubic (fcc) crystals, as shown in Fig.1. The crystal structure of γ phase is body-centered-cubic (bcc) and β phase is body-centered-tetragonal (bct) which is deformed bcc, as a result, the periodicity along vertical direction varies from that along the horizontal direction. The phase diagram of Uranium is very complex. At ambient pressure, uranium crystal presents in the orthorhombic structure (α-phase) below 940 K, and above that, the phase of uranium transforms to the β-phase (bct), which changes to the γ-phase (bcc) if the temperature rises above 1050 K. The α-uranium was reported to be stable up to at least 70 GPa and lower temperatures, while the γ-uranium could stabilize bcc structure at higher temperatures.
Figure 1. α (a) and γ(b) phases of uranium present various structure. The a, b, c and y are lattice constants
Uranium alloys have been studied extensively, which are of interest to weapons design communities. In order to improve its corrosion resistance and ductility, niobium is widely used to be introduced into uranium. Within the percent range from 5 to 8 w.t.% of niobium, U-Nb alloys behave complicated action which is near the monotectoid. At elevated temperatures (above 600 K), U-6Nb (U-6 w.t.%) is stable in a bcc γ-phase. Its phase undergoes various transformations while upon cooling; the alloy presents a distorted structure at about 570 K, which is known as the γ0 phase. The material continue to transform into metastable α" (monoclinic) phase at 450~370 K. The transformation proceed is very rapid from the austenite (γ or γ0) to the martensitic (α") phase.
Because of the minimal solubility in the β or α phases of uranium, niobium is introduced to the high temperature γ-phase firstly, and then, phase transformations lead to stable U-Nb alloy at room temperature. This paper examines the preliminary U-Nb alloy structure according to finding where niobium atoms occupy when they defect into the γ-phase uranium (at higher temperature) before undergoing cooling.
Density functional theory (DFT) calculations provide a reasonable theoretical tool to study niobium defecting into uranium and the crystal structure of U-Nb alloy. Based on the PAW (projector augmented-wave) method and the RPBE-GGA (generalized gradient approximation) functional, our work firstly investigates how Nb atoms defects in γ-phase U, and then the defect site of Nb in α-phase U is confirmed. Secondly, we report the crystal structure of U-12.5 at% Nb alloy. Thirdly, we analyze the structural and electronic properties of U-12.5 at% Nb alloy surfaces. Finally, we summarize the whole work and give our conclusions.
We performed all of our calculations, using the program named Vienna ab initio simulations package (VASP) [2-4]. The new PAW potentials provided in VASP include 6s26p65f 36d17s2 as valence electrons for uranium and 4s24p65s14d4 for niobium, and inclusion of these valence electrons has been proven sufficient [5]. The exchange-correlation functional is based on the GGA and parameterized by PBE formula [6-7]. The first order Methfessel and Paxton’s smearing method [8] is used, which has a width of 0.2 eV. The conjugate gradient method is used to calculate atomic relaxations, and the convergence criterion is set with the magnitude of forces at 0.01 eV/Ang. We set the cutoff energy as 520 eV for both U and Nb in plane-wave basis expansion. The precision is set to Accurate, so as to avoid computational errors and create a finer charge density.
Periodic boundary conditions are employed to relax atom positions for calculating equilibrium lattice constants, allowing changing cell volume and cell shape. The k-points meshes are 21×21×21 for both α and γ phases, which leads to that energy variation is less than 1 meV/atom. For the α-phase U, which has 2 atoms in its primitive cell, and the γ-U contains one. The third-order B-M equation of state [9] is used to calculate the lattice constants.
In our study of how the niobium atom defects in the γ-U, we establish a supercell model. The supercell is 3×3×3 times of unit cell and contains 54 lattice sites. The k-points meshes are 9×9×9, and other parameters are the same as above.
First of all, we present the results of perfect crystals of α and γ-phase U. For the α-phase U, lattice constants are: a=2.814 Ang, b=5.821 Ang, c=4.925 Ang, y=0.100 (unitless), atomic volume V=20.167 Ang3, comparing with the experimental results[10]: a=2.844 Ang, b=5.867 Ang, c=4.932 Ang, y=0.102, V=20.535 Ang3. For the γ-phase U, lattice constants are: a=3.434 Ang, V=20.247 Ang3, comparing with the experimental results[11]: a=3.47 Ang, V=20.89 Ang3. These numerical values show that using PAW method together with RPBE-GGA can reproduce the experimental results well, and the spin-orbit interactions hardly play a role.
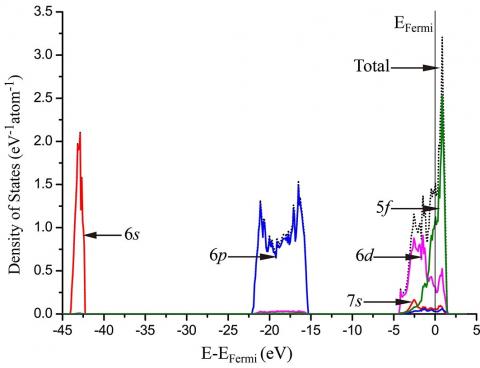
Density of states (DOS) present deep understanding to investigate atomic bonding among uranium atoms by electron distributions. Fig.2 and Fig.3 show that the 6s and 6p electrons in both α and γ phases are deep into uranium atomic core, which is not regarded as valence electrons. Therefore, this distribution indicates that the standard PAW potential in VASP including up to 6s and 6p electrons is sufficient. For both α and γ phases, the 5f electrons dominate near the Fermi energy EFermi among all electrons.
Figure 2. Partial density of states (PDOS) as a function of energy in the α-phase uranium
Figure 3. Partial density of states (PDOS) as a function of energy in the γ-phase uranium
Having presented and analyzed the electron distribution characteristic of α and γ phases of uranium, we start to study the defects in the γ-phase uranium. We considered three types of configurations: one single vacancy, one niobium atom occupying the substitutional site, and one niobium atom occupying the interstitial site [12]. Firstly, we investigate the one single vacancy in the γ-phase. We define the formation energy of one single vacancy EVacancy as
$E_{\text {Vacancy }}=E_{(i-1) \text { Uranium }}-\frac{i-1}{i} E_{n \text { Uranium }}$ (1)
where $E_{(i-1) \text { Uranium }}$ is the energy of (i-1) uranium atoms in the supercell with i lattice sites, and $E_{\text {iUranium }}$ is the energy of γ-phase cell with i uranium atoms. The remaining one lattice site without atom represent one single vacancy. The formation energy of one niobium atom substitutional defect ESubstitutional is defined as
$E_{\text {Substitutional }}=E_{(i-1) \text { Uranium }+\text { Niobium }}-\frac{i-1}{i} E_{\text {iUranium }}-E_{\text {Niobium }}$ (2)
where $E_{(i-1) \text { Uranium }+\text { Niobium }}$ is the energy with (i-1) uranium atoms and one niobium atom occupying all the i lattice sites in the supercell, and $E_{\text {Niobium }}$ is the energy of one niobium atom in bcc crystal. The formation energy of one niobium atom interstitial defect EInterstitial is defined as
$E_{\text {Interstitial }}=E_{\text {IVranium }+\text { Niobium }}-E_{\text {iUranium }}-E_{\text {Niobium }}$ (3)
where $E_{i \text { Uranium }+\text { Niobium }}$ is the total energy of i uranium atoms occupying the i lattice sites and one single niobium atom at the interstitial site in supercell model.
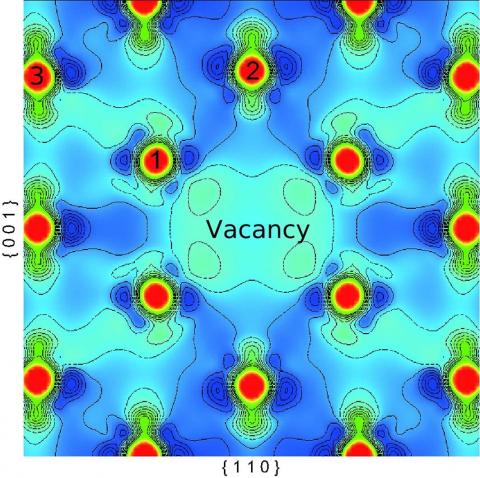
The calculation results reveal that the formation energy of one single vacancy is 1.323 eV. Concerning the vacancy, the charge density decreases nearby is shown in Fig.4, relative to the total charge density of perfect γ-phase uranium. The first nearest neighbor atoms to the vacancy (atom 1) move towards it by 0.098 Ang, meanwhile, the second nearest neighbor atoms (atom 2) move outwards by 0.14 Ang. After the relaxation, the charge density along 1→3 (close-packed) direction decreases, and that along another direction 1→2 changes a bit little.
Figure 4. Charge density difference of the γ phase (including one single vacancy)
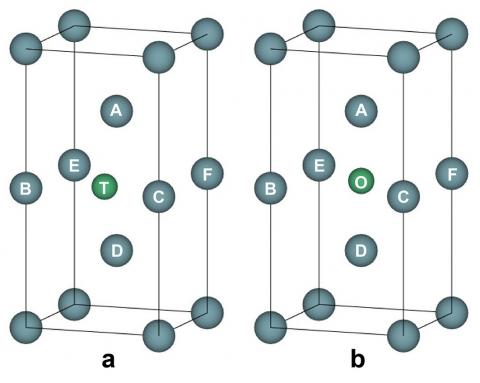
Considering the niobium atom defects when it is introduced into the γ-U, three possible situations are chosen to be studied: niobium atom substitution, niobium atom interstitial at a tetrahedral site and an octahedral site. As shown in Fig.5, the tetrahedral is marked as T and the octahedral site is marked as O. The T site is at the center of ABCD, as shown in Fig.5(a); it has equal distant to points A and D which together with T are on the {0 0 1} surface BCFE. The O site is at the center of ABCFED; meanwhile, the O site is at the center of the {0 0 1} surface BCFE and the center of the {1 1 0} surface ACDE, as shown in Fig.5(b). Our calculation results give the formation energy of one niobium atom substitution as 0.35 eV, that of one niobium atom at the T site is 2.12 eV, and that of one niobium atom at the O site is 2.53 eV.
Figure 5. One niobium atom at a tetrahedral (a) and an octahedral (b) interstitial site in the γ- U
The charge density changing increases in the order of niobium atom substitution, niobium atom at T site, and niobium atom at O site. This has the same trend with the uranium atom movements near these three defect niobium atoms. Around the substitution site of niobium atom, the first nearest ions of niobium atom (atom B) move outwards the niobium atom by 0.10 Ang, while the second nearest ions (atom D) move towards the niobium atom by 0.08 Ang. Near the T site of niobium atom interstitial defect, the first nearest ions (atom B) move outwards the niobium atom by 0.59 Ang, and the second nearest ions move outwards the niobium atom by 0.23 Ang. Near the O site of niobium atom interstitial defect, the first nearest ions (atom A) move outwards the niobium atom by 0.74 Ang, and the second nearest ions (atom E) move outwards the niobium atom by 0.53 Ang. Our results is more accurate theorically.
Figure 6. Charge density difference of the γ-phase uranium containing a substitution niobium atom (a), an interstitial niobium atom at T site (b), and an interstitial niobium atom at O site (c)
Comparing the magnitude of the formation energies, the niobium atoms prefer to defect the substitutional site in the γ-U thermodynamically. R. A. Vandermeer [13] has reported that the U-6 w.t.% Nb is stable in a bcc γ-phase at above 600 K. Our calculations reconfirm the former experiment results well.
We know that U-12.5 at% Nb is in a bcc crystal at high temperatures, and then, upon cooling it experiences phase transformations [14]. Near the temperature of 570 K, the alloy presents a distorted crystal structure known as the γ0-phase. However, at the temperatures from 370 K to 450 K, the material undergoes another transformation and appears as a metastable α" structure (monoclinic). For the U-12.5 at% Nb, the structure is to distort due to the effect of martensitic, and the lattice angle γ becomes larger than 90°. Finally, the crystal structure change from orthorhombic to monoclinic, which is named α".
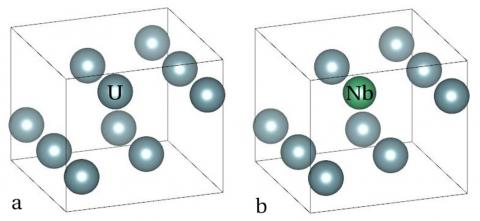
Since the α"-phase is transformed from γ-phase, and niobium atoms prefer to substituting for uranium atoms thermodynamically, we firstly calculate the perfect bcc crystal structure of α-phase uranium, and then replace one uranium atom with a niobium atom in a 2×1×1 α-U supercell, as shown in Fig.7. We randomly replace a uranium atom with a niobium atom, in order to calculate its equilibrium crystal structure, which is the α"-phase of U-12.5 at% Nb as well.
Figure 7. The 2×1×1 α-U supercell (a) contains 8 U atoms, and one of them is substituted by a Nb atom (b)
So far there is not accurate results about the crystal structure of U-Nb alloy, whether in experiments or quantum mechanical calculations. We report the explicit crystal lattice constants of U-12.5 at% Nb based on DFT calculation for the first time.
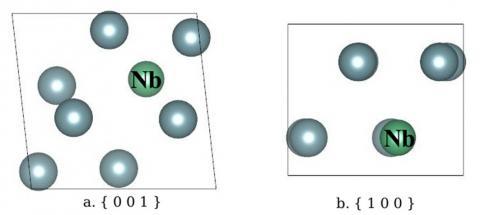
As shown in Fig.8, comparing with the 2×1×1 α-U supercell defected by one Nb atom (namely before calculation), the crystal structure and atom positions in the cell of U-12.5 at% Nb have changed obviously. Firstly, the lattice parameters are: a=5.958 Ang, b=5.699 Ang, c=4.885 Ang; the volume of unit cell increases from 161.335 Ang3 to 164.831 Ang3 (by 2.17%), which is mainly due to the increase of lattice constant a. Secondly, the lattice angle α=β=90°, while γ=96.3°, these parameters agree well with the results of Vandermeer. Thirdly, the move of atom positions transforms the crystal structure from orthorhombic (Cmcm) to monoclinic (P11m).
Figure 8. The crystal structure of U-12.5 at% Nb alloy, which is shown in two directions: the { 0 0 1 } plane (a), and the { 1 0 0 } plane (b)
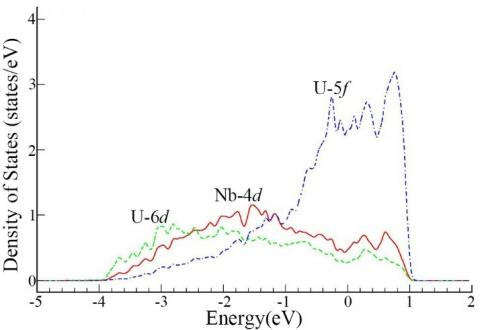
The DOS has been determined to investigate the electronic interaction between uranium atom and niobium atom. In Fig.9, the partial density of states for the U-12.5 at% Nb alloy is displayed. The electronic orbitals displayed include 4d of niobium atom and 5f, 6d of uranium atom which is the nearest one to the niobium atom. For the structure analyzed, the 4s, 4p of niobium atom and 6s, 6p of uranium atom are relatively deep in the core, and the 5s of niobium atom and 7s of uranium atom both have very low density of state, so these orbitals are not displayed in the figure, due to their little contributions to chemical bonds. Near the Fermi level, these three orbitals of uranium and niobium atoms dominate electronic interactions. Much more important, however, the 4d orbital of niobium atom and 6d, 5f orbitals of uranium atom have an evident ‘resonance’ in the energy range from -4 eV to 1 eV, which indicates that these three orbitals hybridize together to form a bond.
Figure 9. Partial density of states (PDOS) in the equilibrium U-12.5 at% Nb alloy, here only 4d orbital of Nb atom and 5f, 6d orbitals of U atom (which is the nearest to Nb atom) are displayed, because the 4s, 4p of Nb atom and 6s, 6p of U atom are relatively deep in the core, and the 5s of Nb atom and 7s of U atom both have very low density of state
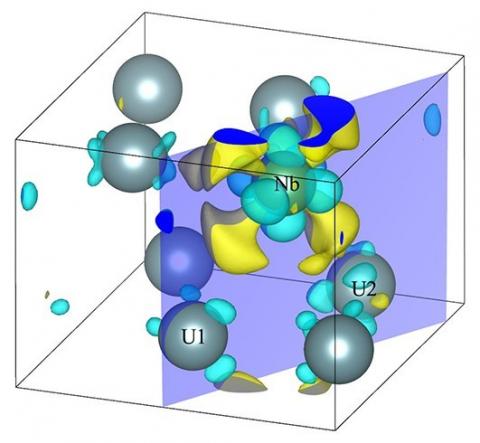
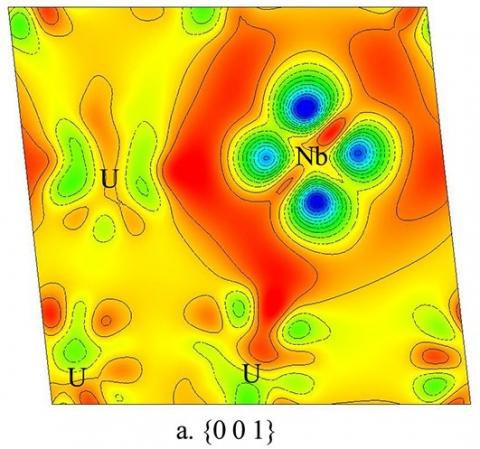
Fig.10 and Fig.11 both show the electron density difference of U-12.5 at% Nb in 3D display mode and in 2D display mode, respectively. The change of electron density distribution near the Nb atom is much more prominent. In Fig.11(a), around the Nb site four large regions of low electron density appear, and the electron density between Nb and U decreases near Nb and increases near U, respectively. In Fig.11(b), it is much more prominent that the electron density between Nb and U goes up.
Figure 10. Electron density difference of U-12.5 at% Nb in 3D display mode
Figure 11. Electron density difference of U-12.5 at% Nb in 2D display mode: (a) is the { 0 0 1 } plane, and (b) is the Nb-U1-U2 (marked in Fig.10) plane
The metallic alloys of uranium are of great interest from the wide use in the nuclear field, especially the U-Nb alloy, U-Ti alloy and so on. Our calculations show that the Nb atom thermodynamically prefers to substitute the U atom in the γ-phase U. Based on the above conclusion, we calculate and report the crystal structure of U-12.5 at% Nb alloy at the first time. Our calculations were performed within the DFT framework using PAW method and the RPBE-GGA functional. This is the first comprehensive study of crystal structure of U-Nb alloy based on the above method.
In summary, we have investigated how the niobium atom defects in the γ phase uranium, and the crystal structure of U-12.5 at% Nb alloy. The results show: (1) formation energy of one single vacancy, one niobium atom at substitutional site, one interstitial niobium atom at T site and O site in the γ-U are 1.323 eV, 0.35 eV, 2.12 eV, and 2.53 eV, respectively; (2) the substitutional site is the thermodynamically preferable site of niobium atom defect in the γ-U; (3) the lattice constants of U-12.5 at% Nb alloy are: a=5.958 Ang, b=5.699 Ang, c=4.885 Ang, α=β=90°,γ=96.3°. (4) the electron interactions between Nb atoms and U atoms are mainly dominated by 4d orbital of Nb atom and 5f, 6d orbitals of U atom.
1. Ludtka G M, Oakes R E, Mackiewicz-Ludtka G, et al. ‘An investigation of superplasticity in a thermomechanically processed U-6Nb (alpha+ gamma) alloy’. Metallurgical Transactions A, 1993, 24, 379-388.
2. Kresse G, Furthmuller J. ‘Efficient iterative schemes for ab initio total-energy calculations using a plane-wave basis set’. Physical Review B, 1996, 54, 11169-11186.
3. Kresse G, Joubert D. ‘From ultrasoft pseudopotentials to the projector augmented-wave method’. Physical Review B, 1999, 59, 1758-1775.
4. J. Faouel, F. Mzali, A. Jemni, S. Ben Nasrallah. ‘Thermophysical characterization of conductive thin films’. Int. Journal of Heat & Technology, vol. 30 (1), pp. 17-22, 2012.
5. Segall M D, Shah R, Pickard C J, et al. ‘Population analysis of plane-wave electronic structure calculations of bulk materials’. Physical Review B, 1996, 16317-16320.
6. Perdew J P, Burke K, Ernzerhof M. ‘Generalized gradient approximation made simple’. Physical Review Letters, 1996, 77, 3865-3868.
7. Mohamed Lachheb, Fethi Albouchi, Foued Mzali, Sassi Ben Nasrallah, Tarek Benameur. ‘Thermal conductivity
enhancement of lino3/graphite composite for energy storage’. Int. Journal of Heat & Technology, vol. 31 (2), pp. 9-16, 2013.
8. Methfessel M, Paxton A T. ‘High-precision sampling for Brillouin-zone integration in metals’. Physical Review B, 1989, 40, 3616-3621.
9. Tsuchiya T, Kawamura K. ‘Systematics of elasticity: Ab initio study in B1-type alkaline earth oxides’. The Journal of Chemical Physics, 2001, 114, 10086-10093.
10. Barrett C, Mueller M, Hitterman R. ‘Crystal structure variations in alpha uranium at low temperatures’. Physical Review B, 1963, 129, 625-629.
11. Wilson A, Rundle R. ‘The structures of uranium metal’. Acta Crystal, 1949, 2, 126-127.
12. Xiang S, Huang H, Hsiung L M. ‘Quantum mechanical calculations of uranium phases and niobium defects in gamma-uranium’. Journal of Nuclear Materials, 2008, 375, 113-119.
13. Vandermeer R A. ‘Phase transformations in a uranium+14 at.% niobium alloy’. Acta Metall, 1980, 28, 383-393.
14. Ahmed Mahmoudi, Imen Mejri, Mohamed Ammar Abbassi , Ahmed Omri. ‘Lattice boltzmann simulation of magnetic field direction effect on natural convection of nanofluid-filled cavity’. Int. Journal of Heat & Technology, vol. 32 (12), pp. 9-14, 2014.