Nomathemba Themba* | Muchaiteyi Togo![]() | Khomotso Semenya
| Khomotso Semenya
© 2023 IIETA. This article is published by IIETA and is licensed under the CC BY 4.0 license (http://creativecommons.org/licenses/by/4.0/).
OPEN ACCESS
Incineration is any procedure, technique or method that transforms waste to flue gases and by-products by means of oxidation. Although the recommended way of treating healthcare risk waste is through incineration, the utilization of incinerators is still disputable. The fundamental problem for incinerators in the Republic of South Africa started with the new amended Section 21 of the National Environmental Management Act: Air Quality Act known as NEMA: AQA 39 of 2004 that requires stack emissions to be reduced by almost 50%. Since the promulgation of the standard, incineration facilities have not been complying with the emissions standard. This study was conducted to investigate the optimum hydrated lime [Ca(OH)2] dosage required to reduce acid gas emissions to the required level. The dosage rate was then raised and kept between 2.5 and 3.5 kg/h. This technology was able to achieve a high removal efficiency of 97% for HCl, 86% for HF, 83% for NO, 87% for SO2 and 74% for NO2. The optimum emissions removal temperature for HCl was between 1190°C and 1200°C, 1020°C for SO2 and NO2, and between 1120°C and 1200°C for NO2. The optimum Ca(OH)2 dosage for maximum NO removal was 3.1 kg/h, HF was 2.9 kg/h, SO2 was 2.8 kg/h, NOx was 2.8 kg/h and HCl was 3.2 kg/h.
acid gas emissions, dry sorbent injections, gaseous emissions, hydrated lime, incineration emissions, incineration of waste, optimum dosage, reducing emissions, stack emissions
Incineration is a procedure, technique or method that transforms waste to flue gases and other by-products by means of oxidation DEA [1]. Although incineration is the recommended way of treating healthcare risk waste, the utilisation of incinerators is still disputable Vehlow [2]. During incineration, waste is treated at a temperature between 850℃ and 1200℃ and acid gases are released into the environment. The common gases are carbon dioxide (CO2), nitrous oxide (NO2), oxides of nitrogen (NOx), hydrogen chloride (HCl), hydrogen fluoride (HF), carbon monoxide (CO) and sulphur dioxide (SO2).
There has always been a stigma associated with incinerators because of their relationship with toxic environmental emissions. However, the fundamental problem for incinerators in South Africa (SA) started with the new amended Section 21 of the National Environmental Management Act: Air Quality Act known as NEMA: AQA 39 of 2004 that requires stack emissions to be reduced by about 50%. Since the promulgation of that standard, incineration facilities have not managed to comply with the new emission requirements Sarkar [3].
SA’s gaseous emissions are among the highest in the world Kong and Davidson [4]. Because of this, South Africa has national and international legal obligations to reduce its emissions Climate and Development Knowledge Network [5]. SA is party to a number of multinational environmental agreements; it ratified the United Nations Framework Convention on Climate Change (UNFCCC) in 1997; the Kyoto Protocol in 2002; and the Paris Agreement on Climate Change in 2016 Pan et al. [6]. In the 2009 Copenhagen Climate Change Conference, South Africa committed to reducing its gaseous emissions by 34% below 2009 levels by 2020 and by 42% below 2009 levels by 2025. Emissions are expected to peak during the period between 2020 and 2025, stabilise between 2025 and 2035 and then decline in absolute terms from around 2035 Dal Pozzo et al. [7].
To reduce the emissions below the stipulated limits, studies were done using hydrated lime [Ca(OH)2] injections, a cost-effective approach for reducing acid gas emissions Sewell and Dickerman [8]. Numerous facilities in the steel industry have utilised Ca(OH)2 to capture environmental contaminants. This study was conducted to investigate the optimum Ca(OH)2 dosage required to reduce acid gas emissions. This was done to establish whether Ca(OH)2 dosage had an effect in reducing gaseous emissions or not. Ca(OH)2 dosage rates were recorded from the lime feeder to investigate the optimum dosage rate required to reduce each of the acid gases. From various past researches such as Quicker et al. [9] and Dowling et al. [10], it is evident that Ca(OH)2 can be utilised to capture and reduce acid gas emissions.
This study is similar to research done by Laird et al. [11]. Laird et al. [11] made use of Ca(OH)2 injections at temperatures varying from 121℃ to 454℃ and concluded that maximum reactivity occurs at minimum temperatures. This study however contrasts with Laird et al. [11] in that Ca(OH)2 was utilised as a sodium sorbent of choice injected at high flue gas temperatures. In the current study, the temperatures were maintained between 850℃ and 1200℃ as per the Atmospheric Emissions Licence requirements and fabric filtration was used to capture the particulate matter (PM). The reactivity of Ca(OH)2 with various gases was then measured. The objective of the study is to investigate the optimum Ca(OH)2 dosage required to reduce stack emissions for combustion processes and to find a cost effective way of reducing the flue gas emissions to comply with the new standard; otherwise, almost all incinerators will have to close down and South Africa will be confronted with an immense challenge of legitimately disposing of the large quantities of healthcare risk waste it produces. Without an effective solution, there is a high risk that healthcare risk waste may be disposed of in residential areas, landfill sites together with municipal solid waste, and in old mine dumps. This has occurred in the past and it creates complex risks for the community and the environment.
The study relied on two sets of data-secondary data primarily gathered from the treatment facility from October 2014 to July 2015; and primary data generated from October 2016 to July 2017. Emissions data collected during the two periods was for regulated acid gases, that is, HCl, CO, SO2, NO, NO2, HF and PM. The Procal 2000 IR Emissions Analyser was used to generate data for both periods. The two data sets were also generated under similar conditions.
During the study, 60 kg of Ca(OH)2 was injected daily on the lime feeder. This was in accordance with the maximum capacity of a lime feeder to allow the system to remain in gravimetric mode. The variable speed drive (VSD) was used to inject Ca(OH)2 into the furnace. The VSD was first adjusted from 1 kg/h and, for 12 hours there was no reaction observed. Even when it was adjusted to 2 kg/h, there was still no reaction. It was then adjusted to 2.5 kg/h, and only then the reaction was observed. Thereafter, the dosage rate was kept between 2.5 and 3.5 kg/h.
Two manual blowers were used to provide continuous circulation of Ca(OH)2 into the reaction chamber and to the dry scrubber. Four burners were utilised to ensure that the furnace reached the recommended temperatures and to keep the temperature within prescribed intervals.
2.1 Stack sampling and analysis
The Procal 2000 IR Emissions Analyser was used to generate primary data during the course of this research. Procal 2000 Analyser is an active sampler designed to provide an In-Situanalysis of up to six gas phase emission components (HCl, CO, SO2, NO, NO2, HF and PM) simultaneously. The instrument was manufactured by Kittiwake Procal, Peterborough, United Kingdom. This continuous monitoring equipment was mounted directly on the stack for regulatory monitoring compliance. The instrument is heat resistant and was fully pre-engineered for maximum uptime measuring of multiple components simultaneously. The instrument has a gas analyser that provided precise, reliable continuous analysis of process gas down to ultra-low parts per million levels. It consists of a sample probe, filter, sample line (umbilical), gas conditioning system, calibration gas system and a series of gas analysers which indicates the parameters being measured.
2.2 Evaluating the optimum dosage rate of Ca(OH)2 injections
Comparative analysis was done to equate gas emission levels before and after the use of Ca(OH)2. Descriptive statistics were used to compute the mean, frequency and percentages. To determine the reduction in acid gases, the emission measurements collected after the intervention (use of Ca(OH)2) were subtracted from the emission measurements collected before the intervention. For each parameter, the difference was divided by the total emission measurements before the intervention multiplied by 100. Tables were used to capture the reduction rate achieved for each acid gas per month and a bar graph was used to present the average reduction rate achieved per parameter.
3.1 Optimum dosage rate of Ca(OH)2 injections in reducing gaseous emissions
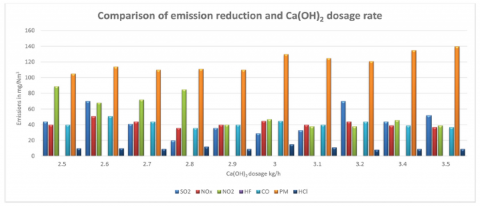
Ca(OH)2 injection rates were evaluated to determine the dosage rate at which Ca(OH)2 is most effective in reducing the gaseous emissions. Laird et al. [11] define optimum dosage as the minimum quantity of a sorbent substance required to produce the desired stack emission concentrations for a specific unit without any unfavorable effects. The dosage rates for Ca(OH)2 injections were collected from the lime feeder. They were then compared with the emission results to determine the dosage rate at which the sorbent was mostly efficient. Figure 1 was used to reflect a relationship between Ca(OH)2 dosage rate and emission outputs. The dosage rate was kept between 2.5 and 3.5 kg/h after it was established that there was no reaction at rates lower than that. It was confirmed that there is a relationship between Ca(OH)2 dosage rate and emissions.
a) HF
Figure 1 shows findings reflecting the Ca(OH)2 dosage rate at which different gases were captured. Between 2.9 and 3.2 kg/h HF demonstrated the most reduction from the flue gas. It was observed that 95% reduction of HF was achieved during December and June under relatively low feed rates (Figure 2). Hydrogen Fluoride is often detected in healthcare waste from the explosion of aerosol cans. Due to high level of waste segregation in healthcare facilities, HF was found in small amounts of approximately less than 1 ppm. During December 2016, 0% HF was detected at 1020℃ and 3.0 kg/h Ca(OH)2 feed rate and this was due to low feed rate and high dosage of Ca(OH)2. The low residence time in flue gas also resulted in high reduction of HF. The optimum dosage for HF was found to be 2.9 kg/h with high relative humidity. The degree of Ca(OH)2 reactivity with HF depend upon the temperature at which Ca(OH)2 and HF emissions first come into contact Laird et al. [11] however, there were concerns about the HF emissions impacting NOx reduction catalyst. It was concluded that hydrated lime injections were effective in capturing HF emissions as the findings were all below the recommended limit of 1 mg/Nm3 as per NEMA: AQA 39 of 2004.
b) HC1
HCl demonstrated most reduction from the flue gas between 2.7 and 3.2 kg/h (Figure 1). HCl was highly reactive when Ca(OH)2 was injected at temperature between 1190℃ and 1200℃. The optimum dosage was found to be 3.2 kg/h with a high residence time of 2 s and Ca(OH)2 was found to be an effective sorbent for controlling the HCl emissions. Since the facility is installed with a baghouse system, this enhanced HCl removals for a given hydrate feed rate due to the added gas-solid contact that occurs in the baghouse as the unreacted hydrate became part of the filter cake. Manocha and Ponchon [12] found that 99% HCl was captured using 1.5 kg/h Ca(OH)2. The Ca(OH)2 was injected through a centred additional hole together with 12% oxygen using a specifically designed lance. Manocha and Ponchon [12] concluded that the benefits perceived were 100% recovery of the injected Ca(OH)2, improved dissolution rate of Ca(OH)2 and improvement in the refractory lining life. Patel et al. [13] reported that they did not measure the optimum lime dosage for gaseous emissions. However, Patel et al. [13] concluded that Ca(OH)2 can be used to neutralise the acidic gases and remove SO2, HCl, HF, CO and NOx from flue gases at any dosage rate.
Figure 1. Demonstration of emission reduction findings and Ca(OH)2 dosage rate
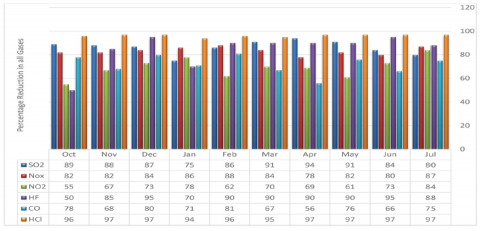
Figure 2. An overall at a glance view of reduction for different acid gases in percentages recorded in 2016/17 sampling period
The technology assisted Patel et al. [13] to ensure the plants complied with both local and international environmental legislation for environmental emissions. In conjunction with flue gas treatment equipment technologies, Ca(OH)2 was the most cost effective and versatile sorbent that was used for this kind of treatment, with less dosage and less waste production compared with other reagents Patel et al. [13]. Biganzoli et al. [14] injected Ca(OH)2 upstream of the system for the reduction of SO2, SO3, HCl and HF prior to interaction with Ca(OH)2. This allowed an improvement in the effectiveness of Ca(OH)2, the availability of sorbent for all treated gases and the technology proved to be effective in eliminating visible plumes at the stack Biganzoli et al. [14]. Biganzoli et al. [14] were able to eliminate the competition between gases and also reported less amount of PM. Based on the findings from this study it was concluded that Ca(OH)2 injections were effective in capturing HCl emissions as the findings were within the recommended limit of 10 mg/Nm3 as per NEMA: AQA 39 of 2004.
c) SO2
It was discovered that an average of 60 kg of Ca(OH)2 was required for the reduction of SO2 per day. About 89% of SO2 was captured using 2,8 kg of Ca(OH)2 per hour. Most O2 reactivity took place between 2.8 and 3.1 kg/h. During the month of January 2017, about 108 kg of Ca(OH)2 was used per month; however, only 75% of SO2 emissions were captured. This is because the effectiveness of Ca(OH)2 for SO2 reduction was strongly dependent on the temperature at the injection point. As more O2 was utilised, the temper ature at the injection point dropped from 880 to 800 ℃; this confirms the dependency of SO2 on high temperatures. Surface area coverage also led to reduced rate of SO2 adsorption. It was observed that when waste with high moisture content was treated, there was a decrease in mass transfer leading to a decrease in SO2 removal efficiency. It was evident that if both SO2 and HCl were treated through dry sorbent injection technology (DSI), Ca(OH)2 needed to be injected at various flue gas temperatures based on the degree of acid gas reduction required.
SO2 average removal in excess of 87% was achieved at reasonable reagent injection rates. The effectiveness of Ca(OH)2 for SO2 capture was very much dependant on the incineration process and the flue gas properties. A removal of over 89% was achieved at a sorbent feed rate of 2.8 kg/h. Higher SO2 removals was observed at increased sorbent dosage rates and when the baghouse particulate collection device was used. In addition, this trial work confirmed that temperature at the injection site greatly impacted the efficacy of hydrated lime for SO2 capture. Manocha and Ponchon [12] reported that 99% SO2 were captured at 980oC using 1.8 kg/h Ca(OH)2 with 11% oxygen lancing from flue gas facilitates. The other elements including Si, Mn and P, were also oxidised and were absorbed in the slag layer Manocha and Ponchon [12]. Laird et al. [11] injected lime at different temperature intervals using only 10% oxygen and stated that more than 10% oxygen created dilution in flue gas. Based on the findings from this study, it was concluded that Ca(OH)2 injections were effective in capturing SO2 emissions as the findings were within the recommended limit of 50 mg/Nm3 as per NEMA: AQA 39 of 2004. The optimum dosage was 2.8 kg SO2 reduction.
d) NO2 and NOx
The results in the NO2 reduction ranged from 36 to 51 mg/Nm3 after the use of sorbent injections. Between 2.5 and 2.8 kg/h NO2 had a least destruction which were all still within the recommended limit of 200 mg/Nm3 as per NEMA: AQA 39 of 2004. It was found that most NO2 emissions were captured between 3.1 and 3.5 kg/h. The most NO2 reaction was observed at 1140℃ using 3.1 kg/h sorbent where 38 mg/Nm3 was measured. About 84% reduction was achieved at a temperature of 1140℃ and 13% O2. As the O2 levels increased to 15% and the temperature maintained at 1140℃, NO reduction also increased to 89%. About 108 kg of sorbent was utilised during the month of January; however, only 86% NO2 reduction was achieved. This was approximately 2% more than what was achieved during the month of February. This shows that the high amount of SO2 in flue gas during the month of January created competition between SO2 and NO2 that led to more consumption of Ca(OH)2.
It was discovered that, for more reactivity of NOx, air must be injected downstream from the gas injectors to provide adequate residence time for the NOx reduction reactions to take place. However, air must be close enough to assure complete combustion within the furnace chamber to discourage dioxins and furans from formation. It was found that, reducing the flow of air to the burners decreased the formation of NOx, and the greater the reduction in airflow, the greater the reduction in NOx. The most NOx reaction was observed between 920℃ and 1020℃ using 2.8 kg/h sorbent where 36 mg/Nm3 was measured. This was due to higher O2 levels (15%) which was between 1 to 1.5 % higher during loading. The optimum dosage for NO2 was therefore found to be 2.8 and 3.1 kg/h.
e) PM
After Ca(OH)2 injections, a reduction in emissions was achieved across all the gases with the exception of PM. The highest monthly average recorded was 140 mg/Nm3 measured in July 2017. The lowest monthly average was 105 mg/Nm3 measured in October 2016. The recommended limit for PM is 30 mg/Nm3 (as per the new amended Section 21 of National Environmental Management Act: Air Quality Act known as NEMA: AQA 39 of 2004). The findings show that particulate properties were highly influenced by Ca(OH)2 injections. The findings support that the utilisation of Ca(OH)2 increased the amount of PM by 31%. Jones and Harrison [15] also found that the introduction of absorbent and adsorbent materials into the process increased the particulate mass in the exhaust gases and increased the need for particle removal systems. The most common used methods for removing particles from the waste gas stream are cyclones, electrostatic precipitators and, on most recent MSW incineration installations, fabric filters or bag houses Jones and Harrison [15].
3.2 An overall at a glance view of reduction for different acid gases in percentages
The highest HCl reduction achieved was 97% during the month of November 2016, December2016, April 2017, May 2017 and June 2017. The least reduction was 94% during the month of January 2017 was as a result of additional O2 in flue gas which subsequently reduced the amount of temperature (Figure 2). HCl also reported non-compliance in January and February 2017, this was due to the competition in flue gases between HCl and SO2. The findings show that an average of 97% HCl reduction was achieved. Ca(OH)2 with small particle sizes stimulated more efficiency in reducing HCl.
The highest HF reduction achieved was 95% measured in December 2016 and June 2017. The least reduction was 50% measured in October 2016 (Figure 2). The findings show that the average reduction of 86% HF was achieved. Although HF was detected in low quantities throughout the study, it was concluded that the least reduction achieved in October 2016 was due to aerosol cans that created an explosion inside the primary chamber due to poor of healthcare risk waste from hospitals. Furthermore, the results indicate that, HF reduction achieved in October 2016 was due to realistic changes made in incineration operating conditions at peak temperatures above 1100℃.
The highest SO2 reduction achieved was 94% measured in April 2017. The least reduction was 75% measured in January 2017 (Figure 2). The average SO2 reduction achieved was 87%. It was found that the main operating variables controlling the SO2 adsorption, were the calcium to sulphur molar ratio such as SO2 concentration in the flue gases, gas flow rate, Ca(OH)2 surface area and the relative humidity. These operating variables aided in achieving a high reduction rate throughout the study. A decrease in the reduction was seen in January 2017 where 75% was achieved. It was concluded that reduction was as a result of the competition in flue gases between HCl and SO2.
The highest NO2 reduction achieved was 84% measured in July 2017. The least NO2 reduction was 55% measured in October 2016 (Figure 2). The findings demonstrate that the NO2 reduction increased marginally during the study. A low reduction was demonstrated in October 2016, November 2016 and February 2017. This was due to high moisture content from waste material and low residence time of 2s encountered. It was concluded that the average reduction of 74% was achieved.
The findings in Figure 2 show that 83% reduction of NO2 was achieved in March and 80% in June using an average of 76 kg of Ca(OH)2. Reduction efficiencies were both achieved at high temperatures between 1140℃ and 1200℃. As Ca(OH)2 injections increased to 84 kg a month, NO2 reduction also increased to 84% during the month of July. The least NO2 reduction was observed in October where only 55% reduction was achieved. This was due to a short residence time, low relative humidity and the low Ca(OH)2 injection rate of 60 kg a month. Le Cloirec [16] reported that sorbent and sodium components maintained a higher reactivity at high temperature and high relative humidity. NO2 reduction capacity increased by another 10% at a temperature of 1200℃. The optimum dosage for NO2 was found to be 3.1 kg/h.
The average of 83% was achieved for NOx reduction. It was noted that the reduction of NOx increased magically during the study. The least reduction reported was 78% in April 2017 (Figure 2); this was due to low O2 concentration of 11% encountered. The highest NO2 reduction achieved was 88% measured in February 2017. SO2 had an average reduction of 87%, NO2 had average reduction of 83%, NO2 had an average reduction of 74%, HF had an average reduction of 86% and HCl had an average reduction of 97%.
It was found that HF, NOx and NO2 achieved 100% compliance with the NEMA: AQA 39 of 2004 standard during the course of the study. SO2 reported a non-compliance in November 2016, June and July 2017. This was due to the competition in flue gases when SO2 and HCl were treated at the same time. This finding is in agreement with Xinhua [17] who reported that the injection of Ca(OH)2 into the flue gases for the removal of SO2, SO3 and HCl created a competition between gases. Xinhua [17] recommended that the competition in flue gases can be eliminated by injecting sorbent at different locations throughout the flue gas path depending on the operation design. Yang et al. [18] agreed that SO2 and HCl performance can vary based on the mixing rate, injection location of Ca(OH)2 and whether the facility has an electrostatic precipitator or fabric filters for the particulate removal device.
Vanderreydt [19] reported that DSI sorbents did not perform the same when it comes to SO2 absorption. However, Sewell and Dickerman [8] enhanced their technology by injecting the sorbent at different location points and achieved an 80% reduction level of SO2 when the sorbent was injected prior to a fabric filter and again after the filtration system, this was a higher rate compared to when the sorbent was injected downstream at one location point. Sewell and Dickerman [8] achieved 90% NO2, 95% HF and 92% HCl removal efficiency.
Vanderreydt [19] reported that DSI sorbents did not perform the same when it comes to SO2 absorption. High levels of SO3 impeded Ca(OH)2 performance but naturally occurring halogens in the flue gases were necessary for oxidation and the capturing of HCl Vanderreydt [19]. Due to Ca(OH)2 being more selective towards SO3 than HCl it typically influenced the sorbent performance. Vanderreydt [19] found that sodium sorbents, though more effective on a mass basis were more likely to impede overall HCl removal capabilities by creating a competition between HCl and SO2 emissions.
The study was aimed at evaluating the optimum dosage required for reduction of stack emissions using hydrated lime injections during incineration of healthcare risk waste. Since the promulgation of the new legislation, none of the incineration facilities in RSA was able to achieve the new air quality standard. The objective of the study was to find the optimum dosages for Ca(OH)2 injections in reducing gaseous emissions to assist incineration facilities in meeting the new air quality requirements. These facilities are required to reduce their stack emission levels by half by 2020. The aim of the study was met as the Ca(OH)2 injections were found to be effective in reducing flue gas emissions and the optimum dosages were established for all gaseous emissions. In order to comply with these new and more stringent emission limits, DSI is increasingly used, which is a low-cost way to control acid gas emissions.
It was established that, each gas species reacted differently with Ca(OH)2 injections. It was found that the optimum dosage for SO2 was 2.8 kg/h, achieving a removal efficiency of 89%. SO2 was removed by the entrained high surface sorbent in the duct and collected in the particulate removal system. The optimum dosage for NO2 was found to be 2.8 kg/h reaching up to 83% reduction efficiency. It is concluded that a high O2 level of 15% improved SO2 and NOx reduction respectively.
The optimum dosage for NO2 was found to be 3.1 kg/h attaining an average reduction of 74% efficiency. This was due to the presence of sulphur dioxide and O2 in the flue gas stream that influenced the NO2 reduction. The reduction of NO2 decreased marginally throughout the course of the study due to the competition in the flue gas duct. The optimum dosage for HF was found to be 2.9 kg/h achieving the removal efficiency of 86%. This high reduction was due to the low moisture content/relative humidity of the treated waste. However, an increase in residence time aided in increasing HF reaction. The optimum lime dosage for HCl was found to be 3.2 kg/h and it achieved an average reduction efficiency of 97%. It was concluded that the utilisation of sodium sorbent at high temperatures increased the HCl reduction rate. An average temperature of 1148℃ was maintained during the course of the study and the following average reduction was achieved: 97% for HCl, 86% for HF, 83% for NOx, 87% for SO2 and 74% for NO2.
Progress has been made in air quality but many important research questions and technical support needs remain. The findings from this research conclude that hydrated lime is a successful reagent in reducing gaseous emissions. It was also noted that the use of hydrated lime caused an increase in PM that created research gaps that need to be explored further. Further research is required to evaluate or suggest improvements on particulate device control measures or explore wet injection sorbent technologies.
Environmental requirements are becoming stricter in terms of dust removal efficiency and emission standards. Further research is required to establish or evaluate different technologies available for dust removal such as the electrostatic precipitators, bag filters, centrifugal sedimentation and wet scrubbing.
The datasets generated during and/or analysed during the current study are included in this published article and are available from the corresponding author on reasonable request.
Firstly, I wish to express my profound gratitude to my substantive supervisor Prof Mucha Togo and co-supervisor Dr Khomotso Semenya who regardless of their bustling schedules were able to guide me through this research until the final write-up. I truly value all your effort, guidance, support, encouragement and discrete counsel in times of confusion.
I would also like to convey my sincere thanks to Dr David Sekete for providing me with permission to conduct my research in his facility. I would like to acknowledge my indebtedness to my boys Agape and Inaya, for providing me with unfailing support and continuous encouragement throughout my years of study and through the process of researching and writing this dissertation. This accomplishment would not have been conceivable without them.
[1] DEA, National Environment Management. (2013). Air Quality Act, 39 of 2004 (AQA): National Dust Control Regulations. Government Gazette No. 36974. Government Printer, Pretoria, Republic of South Africa.
[2] Vehlow, J. (2015). Air pollution control systems in WtE units: An overview. Waste Management, 37: 58-74. https://doi.org/10.1016/j.wasman.2014.05.025
[3] Sarkar, D.K. (2015). Chapter 14 – air pollution control. In Thermal Power Plant. IEDM Tech. Digest: United Kingdompp, pp. 479-522.
[4] Kong, Y., Davidson, H. (2010). Dry sorbent injection of sodium sorbents for SO2, HCl and mercury mitigation. In North American Waste-to-Energy Conference, 43932: 317-320. https://doi.org/10.1115/NAWTEC18-3560
[5] Climate and Development Knowledge Network. (2012). Managing climate extremes and disasters in Africa: Lessons from the SREX report. CDKN. Retrieved from www.cdkn.org/srex.
[6] Pan, H., Page, J., Zhang, L., Cong, C., Ferreira, C., Jonsson, E., Helena Näsström, Georgia Destouni, Brian Deal, Kalantari, Z. (2020). Understanding interactions between urban development policies and GHG emissions: A case study in Stockholm Region. Ambio, 49: 1313-1327. https://doi.org/10.1007/s13280-019-01290-y
[7] Dal Pozzo, A., Antonioni, G., Guglielmi, D., Stramigioli, C., Cozzani, V. (2016). Comparison of alternative flue gas dry treatment technologies in waste-to-energy processes. Waste Management, 51: 81-90. https://doi.org/10.1016/j.wasman.2016.02.029
[8] Sewell, M.R., Dickerman, J. (2012). Dry sorbent injection options for controlling emissions of HCl and related acid gases. In Air and Waste Management Association International Conference on Thermal Treatment Technologies and Hazardous Waste Combustors 2012, 413-425.
[9] Quicker, P., Rotheut, M., Noel, Y., Schulten, M., Athmann, U. (2014). Treating WTE plant flue gases with sodium bicarbonate. Power, 158(8): 59-63.
[10] Dowling, A., O'Dwyer, J., Adley, C.C. (2015). Lime in the limelight. Journal of cleaner production, 92: 13-22. https://doi.org/10.1016/j.jclepro.2014.12.047
[11] Laird, C.P., Smith, K.J., Looney, B. (2012). Results of dry sorbent injection testing to reduce HCl. In Air and Waste Management Association – Power Plant Air Pollutant Control “MEGA” Symposium 2012, pp. 136-147.
[12] Manocha, S., Ponchon, F. (2018). Management of lime in steel. Metals, 8(9): 686. https://doi.org/10.3390/met8090686
[13] Patel, C., Lettieri, P., Germanà, A. (2012). Techno-economic performance analysis and environmental impact assessment of small to medium scale SRF combustion plants for energy production in the UK. Process Safety and Environmental Protection, 90: 255-262. http://dx.doi.org/10.1016/j.psep.2011.06.015
[14] Biganzoli, L., Racanella, G., Rigamonti, L., Marras, R. Grosso, M. (2015). High temperature abatement of acid gases from waste incineration. Part I: Experimental tests in full scale plants. Waste Management, 36: 98-105. http://dx.doi.org/10.1016/j.wasman.2014.10.021
[15] Jones, A. M., Harrison, R.M. (2016). Emission of ultrafine particles from the incineration of municipal solid waste: A review. Atmospheric Environment, 140: 519-528. https://doi.org/10.1016/j.atmosenv.2016.06.005
[16] Le Cloirec, P. (2012). Treatments of polluted emissions from incinerator gases: A succinct review. Reviews in Environmental Science and Bio/Technology, 11(4): 381-392. https://doi.org/10.1007/s11157-012-9265-z
[17] Xinhua. (2017). China finds widespread violations of environmental rules. http://en.cleanairchina.org/product/8779.html.
[18] Yang, C., Cao, L., Yang, J. (2017). Dimensional analysis of an electro membrane reactor for recycling and resource recovery of flue gas desulfurization residuals. Environmental Engineering Science, 35(2): 76-87. https://doi.org/10.1089/ees.2016.0593
[19] Vanderreydt, I. (2015). Inventory of the Waste Incineration Sector in Flanders. Vito.