Isam M. Abdulhameed* | Sonay Sozudogru OK | Hala N. Malloki | Muhittin Onur Akca | Bilge Omar | Gokhan Cayci
© 2022 IIETA. This article is published by IIETA and is licensed under the CC BY 4.0 license (http://creativecommons.org/licenses/by/4.0/).
OPEN ACCESS
Climate change effects increase the scarcity of irrigation water and deterioration of its quality, which affects the crop water requirements. Researchers were studying the water recycling technique and finding about other possible renewable water resources for irrigation, they conclude that saline water can be used to meet part of the irrigation water needs for many crops under special field management, because there are many crops have a high tolerance to the salinity without decreasing in the yield. The current study aims to evaluate the economic yield of saline drainage water in irrigation. A computer program (Fıuat Ujaj) using Visual Basic language was constructed to use the largest possible amount of drainage water for irrigation after removing the toxic effects and then calculates the relative yield of the selected crops. The Main Outflow Drain (MOD) in Iraq was selected as a saline water resource which has 4.63 dS m-1 Electrical Conductivity (EC). This saline water contained high concentrations of chlorine and sodium ions. MFUP results showed that toxic effect of these ions can be removed by diluting with 35% of the nearby river water. MFUP results showed that the crops with high and medium tolerance to salinity give an acceptable yield ratio when they were irrigated with diluted water (35%) to remove toxicity effects only, while the dilution increases for crops of medium sensitivity, but the acceptable yield of sensitive crops is not achieved except with fresh river water. If the crop production is lower than the economically acceptable limit, another 5% of the river water will be added to mitigate, and the dilution process continues until the percentage of the river water become 80% of the irrigation water. If the required product is not achieved, then the program instructs to irrigate this crop with the river water only.
saline irrigation water, climate changes, main outflow drain, modelling
Due to climate changes and water scarcity, saline water will be uses for irrigation purposes under especial conditions according to crop water requirements [1]. Very sever decreasing in water resources in quantity and deteriorated in quality due to climate changes [2]. One of the main abiotic restrictions on world food production are soil and water salinity, and related issues are particularly important in semi-arid and arid regions. Saline groundwater is frequently used for irrigation in water-scarce areas, and drainage and waste waters are recycled and used for irrigation as well. As a result, there is a greater need for spreading knowledge of this problem and for enhancing the management of waterways with poor quality and soils damaged by salt. The use of saline drainage water for irrigation has expanded due to the decrease and contamination of freshwater [3, 4]. The salinity of the water is expressed generally as electrical conductivity (EC) in ds/m or total dissolved salts (TDS) as parts per million (PPM). If the water salinity ranges from 2 – 10 ds/m, it is classified as moderate saline water and can be used for irrigation under controlled field management conditions [5, 6].
Developing countries that present the highest population growth rates, and often the high rates of soil degradation [7, 8]. A strategy for enhancing land and water availability is the use of salted soils and salted water, in a strategy designated as saline agriculture or bio-saline agriculture [9, 10].
The saline water effects can be formulated as a matrix of three columns of saline problems which are (osmotic, infiltration, and toxicity of special ions), versus five rows of field conditions which are (climate, crop tolerance, soil texture, field management, and irrigation method). This matrix is named as Saline Irrigation Water Matrix (SIWM) [9] (As showing Table 1).
Table 1. Saline irrigation water matrix (SIWM) [11]
|
No |
Field Condition. |
Salinity problem |
||
|
|
|
Osmotic (O) |
Infiltration (I) |
Toxicity (T) |
|
1 |
Climate (C) |
(CO) |
(CI) |
(CT) |
|
2 |
Plant (P) |
(PO) |
(PI) |
(PT) |
|
3 |
Soil texture (S) |
(SO) |
(SI) |
(ST) |
|
4 |
Field Management (F) |
(FO) |
(FI) |
(FT) |
|
5 |
Irrigation method (IM) |
(IMO) |
(IMI) |
(IMT) |
The importance of expanding bio-saline agriculture is increased due to population increasing and climate change challenges.
This study aims to:
·Construct a computer program in order to maximize the use of moderate saline water in irrigation according to the Saline Irrigation Water Matrix (SIWM) in order to deal with all possible conditions of saline water effects and the field conditions.
·Formulate an economic feasibility model to evaluate the validity of using drainage water in irrigation.
·Develop a new logical and mathematical model for expanding using saline water and decreasing the gap between water requirements and available suitable water for irrigation purposes.
The whole structure of this research is summarized as:
a. The saline water resource.
b. The methodology of the model construction.
c. Economic feasibility of the model.
d. Results and discussion.
e. The main conclusions of the study.
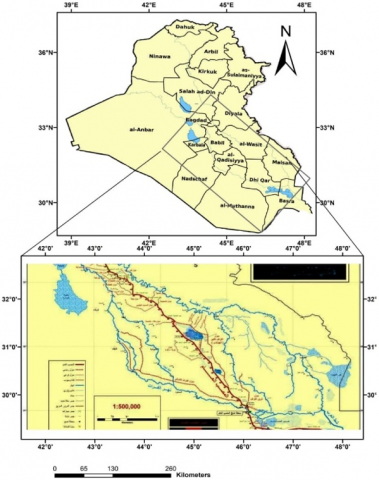
MOD collects water from the drainage network of agricultural projects in the central and southern zones of Iraq and transfers it to the Shatt al-Basra and then the Arabian Gulf, Figure 1. About eight billion of moderate saline water flows through MOD into the Arab Gulf. This grate drain is flows from north to south between Tigress and Euphrates rivers until crossing the Euphrates river near Aldiwaneea by a grate culvert and pump station, then it flows to the left of Euphrates until discharging into the Arabian-Gulf.
Figure 1. MOD in Iraq [12]
2.1 Salinity
Figure 2 shows the monthly averages of the salt concentrations for the period 2019-2021, the maximum salinity is in Jun (5.06) dS m-1. While the minimum value is in January (3.72) dS m-1, and the average of all months among the period 2019-2012 is 4.63 dS m-1.
Figure 2. MOF salinity average at station 510 km
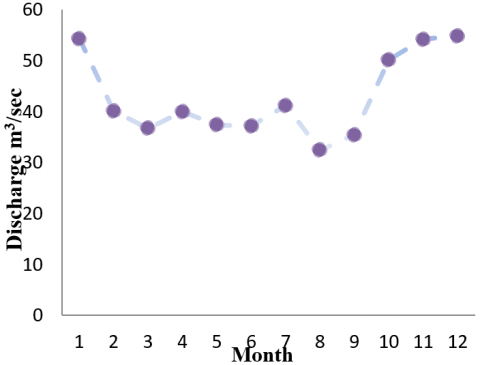
2.2 MOD discharge
Figure 3 shows the discharge averages during the Periods 2019 to 2020. The maximum average discharge is 56.2 m3 sec-1 in January while the minimum value is in August (32.3 m3 sec-1).
Figure 3. MOF average discharge at station 510 km
According to the Furat-Ujaj program that was built using Q-basic [13], a new computer program was built using the Visual Basic program with some moderations. Visual Basic is selected because it provides a rich set of technical commands and functions that will prove more than sufficient for solving any engineering problems [14].
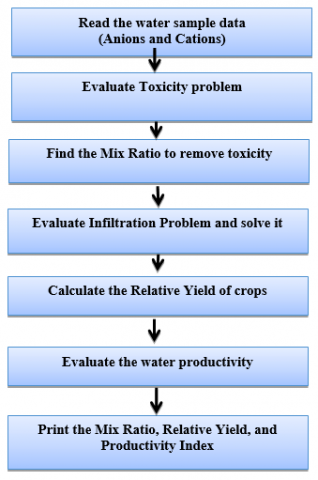
The program firstly removes the toxicity effects by using freshwater resources, and then followed by dilution of the saline water in order to reduce the osmotic potential. Figure 4 illustrates the schematic flowchart of the Modified Furat Ujaj Model (MFUM). The program aims to deal with all expected effects of saline water on crop production according to the Saline Irrigation Water Matrix (SIWM) explained in Table 1.
Figure 4. Flowchart of (MFUM)
3.1 Osmotic potential effects (O)
The osmotic effects are introduced as a linear relationship between the water salinity and the relative yield.
The osmotic effects are introduced as a linear relationship between the water salinity and the relative yield. Each crop is defined by its threshold point (A) and the slope of the linear relation between yield and salinity according to the studies [15, 16]:
YR%=100-B(ECe–A) (1)
where, YR%: the relative yield of a crop; A: the threshold point of the crop; B: amount of yield decreasing ratio followed by increasing the salinity by 1 dS m-1; ECe: the electrical conductivity of the saturated soil extract.
The field conditions in SIWM are also included in this equation by the values of A and B for crops and the other conditions expressed for each planted land depend on soil properties, irrigation methods, climate conditions and field management.
3.2 Infiltration effects (I)
An increase in sodium ions can cause soil dispersion and reduce the ability of the soil to infiltrate water through it. The collected data in this study is in agreement with previous studies that the SAR values in MOD are low, and there are no infiltration problems [9]. Therefore, all Saline Irrigation Water Matrix (SIWM) factors in Table 1 are not causing any problem in this model.
3.3 Toxicity effects (T)
Some ions cause toxic problems if their concentration in irrigation water are above certain limits. In this research, Table 2 shows the classification regarding the permissible limits for the concentration of ions [14]. The following equation is adopted in calculating the critical mix ratio to dilute the ion effects [15].
CB=[Ccw×a]+[Cdw×(1–a)] (2)
where, CB=Mix water concentration (me L-1 or mg L-1); Ccw=Irrigation canal water concentration (me L-1 or mg L-1); Cdw=Drainage water concentration (me L-1 or mg L-1); a=Dilution ratio.
After calculating the mix ratios for all problems, the highest dilution ratio is selected and symbolized by (TMR) as an abbreviation of the expression (Toxicity Mix Ratio).
Table 2. Water quality guidelines for crop production [17]
|
Irrigation Problem |
The Unit |
The limits |
||
|
|
|
None |
Slight to Moderate |
Severe |
|
Toxicity |
|
|
|
|
|
Sodium |
me/l |
<3 |
3–9 |
> 9 |
|
Chloride |
me/l |
<4 |
4–10 |
> 10 |
|
Boron |
mg/l |
<0.7 |
0.7–3 |
> 3 |
|
Nitrogen NO3 |
mg/l |
<5 |
5–30 |
> 30 |
|
Bicarbonate (HCO3) |
me/l |
<1.5 |
1.5–8.5 |
> 8.5 |
|
pH |
|
Allowable Range 6.5–8.4 |
||
3.4 Irrigation water resources
After calculating the dilution ratio, the program selects the highest dilution and then reads the crop tolerance data. The relative yield (YR) can be estimated by Eq. (1).
Table 3. Salt tolerance of crops [18]
|
Crop |
Threshold point (A) |
Slope (B) |
Rating |
|
Barley |
8.0 |
5.0 |
T |
|
Alfalfa |
2.0 |
7.3 |
MS |
|
Peanut |
1.7 |
21 |
S |
|
Corn |
1.7 |
12.0 |
MS |
|
Onion |
1.2 |
16.0 |
S |
|
Carrot |
1 |
14 |
S |
Note: S: Sensitive crop; T: Tolerant crop; MS: Moderately Sensitive; MT: Moderately Tolerant
Table 3 shows Salt tolerance of some crops. After calculating Toxicity Mix Ratio (TMR), the program assuming the leaching fraction (LF) equal to 0.25 according to the field data, then calculates the soil water concentration factor (CF) from the following equation [19]:
CF=(1+LF)/(3×LF) (3)
After the Concentration Factor (CF) is calculated from Eq. (3), the salinity expressed as electrical conductivity of soil extract (ECe) is calculated using Eq. (4), then the relative yield (YR) is estimated from Eq. (1), and then the YR value is evaluated if it is economically or not, an economical fracture is introduced in this research as expressed later.
ECe=CF×ECw (4)
where, ECw=Electrical conductivity of irrigation water.
If YR is less than its acceptable value, the leaching fraction (LF) is increased by a small amount (0.01) and then CF, ECe, and YR are recalculated from Eq. (3), this iteration continued until the YR value is greater than its critical value. The maximum permissible value of the Leaching Fraction (LF) in this research is 0.3. If the required crop yield is not achieved with the maximum LF value, the program moves to the second dilution stage to reduce the osmotic potential by increasing the river water ratio in the mixture by another 5%.
There are three cases of water resources according to the water salinity and crop tolerance as explained below:
(1) If an economical YR is achieved when controlling the leaching requirements without the need to increase the river water ratio, the program prints the name of the crop and its irrigation water resources as Toxicity Mix Ratio (TMR). That means the drainage water is diluted to remove toxicity only.
(2) For any crop for which the required yield is less than economic value, another dilution ratio of 0.05 was added from the river and it is called the Mix ratio (MR) to distinguish from toxicity dilution. Then the program starts calculating the concentration factor and productivity in the same way as before. If the required production occurs, the program writes the name of the crop and the source of the irrigation water that will be in this case (MR).
(3) If the required product is not achieved despite reaching the maximum dilution ratio (80% from the river), the program instructs to irrigate the crops with river water only, so it writes the source of irrigation River (R).
3.5 Economic feasibility
The use of the Modified Furat Ujaj Model (MFUM) to expand the agricultural area by using saline water, is accompanied by decreasing in crop productivity due to the osmotic stress of the saline water.
Therefore, it is very necessary to compare the benefits of exceeding irrigated areas with the production decreasing in order to build an Economic Feasibility Factor (EFF). In this model, the fresh irrigation water saved from river water can be expressed as a model benefit, while the productivity decrease is expressed as the cost.
The benefit that this model saved according to saving fresh river water can be calculated as:
X=Sv*Pu (5)
where, X: The money that is saved by saving fresh river water and replacing it with saline water, $/season; Sv: The volume of saved fresh river water m3/season; Pu: Productivity of a unit volume of irrigation water, $/m3.
The crop yield decreasing (dYR) can be estimated as:
dYR=100-YR (6)
where, YR: Crop relative yield, %.
If the total yield is Y $/season, so the losses due to using saline water (C) can be calculated:
C=dTR*Y (7)
Expressing the total yield without using saline water can be estimated as:
Y=Tv*Pu (8)
where, Tv: Total volume of irrigation water without using saline water. M3.
Substituting Eq. (8) into Eq. (7) and estimating the Benefit-Cost ratio (B/C):
$\frac{B}{c}=\frac{S v * P u}{d Y R * T v * P u}$ (9)
For the unit volume of irrigation water, Tv=1, so:
$\frac{B}{c}=\frac{S v}{d Y R}$ (10)
For the unit volume of the irrigation water, the saved volume from river water equal to the saline water volume taken from drain water can be calculated as:
Sv=1-Mr (11)
where, If Mr=80% that means 80% of irrigation water is from river, So saved volume is 1- 0.8=0.2.
Substituting equation 11 into equation 10 and simplifying:
$\frac{B}{c}=\frac{1-M r}{d Y r}$ (12)
Economic Feasibility Factor (EFF), is a value of Benefit-Cost Ratio when its value is greater than 1:
$\mathrm{e}-E F F=\frac{B}{c}+0.5 \frac{B}{c} \geq 1$ (13)
If $\frac{B}{c}<1$ then the program indicates that there is no economic feasibility of using saline water.
The salinity-sensitive crops give low values of the EFF, so it was necessary to calculate this index for all crops that can be grown in the particular project to determine the crops that give acceptable values for this factor, which must be more than 1 for the profit to be greater than the loss [20, 21].
4.1 Toxicity risk (T)
The concentration of each of these ions is greater than the permissible limits, but the low concentration values of these ions in the river water can be used to dilute them and make them acceptable according to Eq. (1). Table 4 shows the required dilution ratios for different ions of MOD at station 510 km, in which it is noted that the dilution ratio of sodium was 0.3 and chloride was 0.35. The program chose the dilution ratio for chloride because it is greater than the dilution required to remove the toxicity of sodium. This means 35% of the irrigation water should be taken from the river and 65% from the drainage water.
Table 4. Toxicity dilution
|
Element |
Cd |
Cr |
Problem Degree |
TMR |
|
Na (meq/l) |
17.56 |
2.87 |
M |
0.3 |
|
Cl (meq/l) |
27.04 |
3.25 |
M |
0.35 |
|
NO3 (PPM) |
1 |
0.21 |
N |
0.0 |
|
PH |
8.2 |
7.9 |
N |
0.0 |
Note: M: Moderate problem; N: No problem.
4.2 Irrigation water resource
After calculating the dilution percentage and the electrical conductivity of the diluted water, the program reads the crops tolerance data represented by the threshold point and the percentage of decrease in production, which were taken from Table 3, then the subroutine (LF) calculates the concentration factor (FC) by using Eq. (5) and then calculates the soil saturation concentration (ECe) by using Eq. (7). Then it determines the relative yield for the crop according to Eq. (4). Then this product is compared with the minimum allowed, which is determined by the type of crop and its Economic Feasibility Factor (EEF).
To clarify the Program Mechanism, two crops were chosen for different salinity tolerance Alfalfa and Peanut. Table 3 explains that Alfalfa is moderately sensitive (MS) and Peanut is a sensitive crop (S). To estimate the relative yield of Alfalfa, as the irrigation efficiency (Ea) is 65%, the minimum leaching requirements are equal to 0.25. The concentration factor is calculated from the Eq. (3):
CF=(1+0.25)/(3×0.25)=1.67
The MOD concentration of 4.63 dS m-1 at the Abu Graib site decreases to 3.5 dS m-1 when diluted by 35% from the river to remove the toxicity effects. The concentration of soil extract is calculated from Eq. (4):
ECe =1.67×3.5=5.845 dS m-1
The percentage of production depends on salinity and type of crop, where the salinity threshold for Alfalfa crop is 2 and loses 7.3% of its production whenever the soil salinity increased by 1 dS m-1 from the threshold point, the production can be calculated by applying the Eq. (1):
YR=1007.3 ×(5.845–2)=71.93%
The economic feasibility factor (EFF) of the dilution method by comparing the production with the least allowed, which is calculated from the critical value of the guide (imposed equal to 1.05). The EFF for Alfalfa is greater than 1.05 so it is suitable.
This production is still uneconomical so the program increases the ratio of the water from the river by 5% until the yield ratio is greater than the critical value, the water resource in this case is printed as MR because of the dilution of the toxicity ratio don’t enough to reach the suitable yield ratio.
The results of the program are shown in Table 5. The results state that the peanut crop was irrigated with an extra dilution (MR), which means that the subroutine (LF) reached its largest value of 0.3 without achieving the required production. So additional ratio from river water must be added, then the water resource is MR, not TMR as Alfalfa.
Table 5. Results of the dilution program
|
Crop |
YR % |
MR |
ECe |
IWS |
|
Barley |
100 |
0.35 |
5.885 |
TMR |
|
Alfalfa |
71.64 |
0.35 |
5.885 |
TMR |
|
Peanuts |
53.107 |
0.4 |
4.817 |
MR |
|
Carrot |
50.496 |
0.451 |
4.536 |
MR |
|
Onion |
72.432 |
1 |
2.923 |
R |
|
Corn |
51.964 |
0.35 |
5.703 |
TMR |
Table 6 shows the results of many crops of different tolerance to salinity, it appears that the water resources varied with respect to the plant tolerance. The sensitive crops were irrigated directly from the river while other crops were given suitable yield ratios when irrigated with saline water of TMR or MR dilution decreases.
These results differ from one project to another depending on the concentrations of MOD water.
It is noticed in Table 6 that the productivity index value increases with the increased production ratio.
Table 6. The EFF values for several crops
|
Crop |
YR % |
EFF |
IWS |
|
Barley |
99.9 |
6.49 |
TMR |
|
Alfalfa |
71.64 |
2.28 |
TMR |
|
Corn |
62.6 |
1.6 |
MIR |
|
Peanut |
61.26 |
1.42 |
MR |
|
Onion |
92.16 |
0 |
R |
|
Carrot |
90.34 |
0 |
R |
A computer program has been constructed in order to use the largest possible amount of MOD water in irrigation after removing the effects of toxic ions by diluting it with fresh water, then calculate the relative yield of diluted water for different crops, and compare them with a minimum acceptable yield. The most important conclusions are:
(1) The salinity average of MOD for the period (2019-2021) was 4.63 dS m-1.
(2) MOD water contains high concentrations of chlorine and sodium ions. However, removing the toxicity of these ions can be achieved by diluting with 35% of the nearby river water.
(3) Diluting drain water with river water with a ratio of 35%, and using this diluted water to irrigate tolerant crops means saving 65% of crop water requirements for these crops.
(4) (MFUP) results showed that the crops with high and medium tolerance to salinity give an acceptable yield ratio when they were irrigated with diluted water to remove toxicity effects only, this result encouraged the farmer to expand using saline drain water to irrigate tolerance crops as barley and cotton.
(5) The crops of medium sensitivity also can be irrigated by drainage water using additional fresh water to dilute the salinity effects, but the acceptable yield of sensitive crops is not achieved except with fresh river water.
(6) The values of the Economic Feasibility Factor (EFF), which is introduced in this study, are increased with the increased production ratio, so using saline water for tolerant crop is the best economical evaluation results.
Great thanks and gratitude to the Iraqi Ministry of Higher education and Scientific Research, and the University of Anbar, for providing this opportunity for me to work with colleagues at the University of Ankara, Turkey. And I thank the Faculty of Agriculture at the University of Ankara for the facilities it provided for the completion of this study.
[1] Najm, A.B.A., Abdulhameed, I.M., Sulaiman, S.O. (2020). Water requirements of crops under various Kc coefficient approaches by using water evaluation and planning (WEAP). International Journal of Design & Nature and Ecodynamics, 15(5): 739-748. https://doi.org/10.18280/ijdne.150516
[2] Al-Salihi, Z.A., Kamel, A.H., Abdulhameed, I.M. (2022). Effects of the climate change on the tigris river basin in Iraq. International Journal of Design & Nature and Ecodynamics, 17(4): 585-593. https://doi.org/10.18280/ijdne.170413
[3] Ayers, R.S., Westcot, D.W. (1985). Water quality for agriculture. Rome: Food and Agriculture Organization of the United Nations.
[4] Wilcox, L.V. (1960). Boron injury to plants (No. 211). Agricultural Research Service, US Department of Agriculture.
[5] Rhoades, J.D., Kandiah, A., Mashali, A.M. (1992). The use of saline waters for crop production-FAO irrigation and drainage paper 48. FAO, Rome, 133.
[6] Kelly, W.P. (1940). Diagnosis and improvement of saline alkali soils: Agriculture, 160. Handbook 60. US Department of agriculture, Washington DC.
[7] Ning, S., Zhou, B., Wang, Q., Tao, W. (2020). Evaluation of irrigation water salinity and leaching fraction on the water productivity for crops. International Journal of Agricultural and Biological Engineering, 13(1): 170-177. https://doi.org/10.25165/j.ijabe.20201301.5047
[8] Hasham, G.J., Ramal, M.M. (2022). Water quality assessment of euphrates river within fallujah city using water quality indices technique. International Journal of Design & Nature and Ecodynamics, 17(4): 563-570. https://doi.org/10.18280/ijdne.170410
[9] Horneck, D.A., Ellsworth, J.W., Hopkins, B.G., Sullivan, D.M., Stevens, R.G. (2007). Managing salt-affected soils for crop production. Oregon State University. http://hdl.handle.net/1957/20788.
[10] Grattan, S. (2002). Irrigation water salinity and crop production. UCANR Publications.
[11] Abdulhameed, I.M., Malloki, H.N. (2021). Saline irrigation water matrix (siwm) to optimize crop productivity:-(a review). In IOP Conference Series: Earth and Environmental Science, 779(1): 012025-012025. https://doi.org/10.1088/1755-1315/779/1/012025
[12] Malloki, H.N. (2021). Programming the use of main outfall drain water for irrigation. MSc Thesis, Dams and water resources department, college of university of Anbar, Iraq.
[13] Abdulhameed, I.M. (2010). Management of using saline irrigation water under different rainfall conditions. Iraqi Journal for Civil Engineering, 7(1): 1-9.
[14] Corwin, D.L. (2021). Climate change impacts on soil salinity in agricultural areas. European Journal of Soil Science, 72(2): 842-862. https://doi.org/10.1111/ejss.13010
[15] Maas, E.V., Hoffman, G.J. (1977). Crop salt tolerance— current assessment. Journal of the Irrigation and Drainage Division, 103(2): 115-134. https://doi.org/10.1061/JRCEA4.0001137
[16] Maas, E. (1993). Testing crops for salinity tolerance. In Proc. workshop on adaptation of plants to soil stresses, 34: 247-247.
[17] Ayers, R.S., Westcot, D.W. (1985). Water Quality for Agriculture. Rome: Food and Agriculture Organization of the United Nations.
[18] FAO. (1999). Soil salinity Assessment. Rome. Italy.
[19] Alzubaydi. (1990). Soil Salinity, Theoretical and Practical Foundations. University of Baghdad-Iraq, in Arabic.
[20] Abdulhameed, I.M. (2017). Maximizing irrigation water productivity by optimizing leaching fraction. Journal of Agricultural Science and Technology A, 7(2017): 73-80. https://doi.org/10.17265/2161-6256/2017.02.001
[21] Khudair, M.Y., Kamel, A.H., Sulaiman, S.O., Al-Ansari, N. (2022). Groundwater Quality and Sustainability Evaluation for Irrigation Purposes: A Case Study in an Arid Region, Iraq. International Journal of Sustainable Development and Planning, 17(2): 413-419. https://doi.org/10.18280/ijsdp.170206