Ameer Hasan Hamzah* | Abdulrazzak Akroot | Jabbar A. Jaber
© 2022 IIETA. This article is published by IIETA and is licensed under the CC BY 4.0 license (http://creativecommons.org/licenses/by/4.0/).
OPEN ACCESS
The response surface methodology (RSM) is used in the present research together with a group of variables that have an effect on engine performance and output exhaust from the combustion process. Therefore, the purpose of the current paper is to get efficiency best by using biodiesel fuel and comparative with normal fuel. The variables under consideration include biodiesel ratio, engine load, and injection pressure. The experiments were performed with different engine speeds (1500, 2000, and 2500 rpm) and with different torques (4, 5, 5, 7, and 8 N.m). The biodiesel ratio (at 10%, 20%, and 30%) affects engine performance, power, specific fuel consumption, and mean effective pressure. The comparison is performed in the previous variables according to the gas ratio of the output exhaust (NOX, CO2, CO, HC, and smoke). The experimental work shows the center composite design approach of the response surface methodology. To get the best performance from the engine, the optimal values for the engine factors are 50% per volume, an engine speed of 2500 rpm, and an engine torque of 5.9744 Nm. The optimal engine performance responses depending on these optimal factors have been Power (KW) 2.36665, BMEB (bar) 3.6465, BSFC (g/kWh) 338.131. The exhaust released was 1.7808 (g/kWh). 273.985 (g/kWh) BSCO2, 0.0436773 (g/kWh) BSCO BSHC, NOX (2.48637 g/kWh), and 3.43418 g/kWh smoke.
experimental, biodiesel, engine performance, RSM approach, factors optimal
Human activity is shown by energy consumption because of global growth. Global peace, economic growth, and quality of life are all dependent on a sufficient supply of clean energy. Identifying energy sources to meet the world's growing needs Demand will be one of society's most pressing issues in the next half-century. The importance of this the problem's pervasiveness and the befuddling technical challenge of tackling it need collaboration considered. Compression combustion engines are one of the most important engines utilized in small and large transport vehicles. Because internal combustion engines have become a significant source of energy usage, researchers have looked at ways to enhance fuel economy by upgrading and exporting fuel usage control technology [1].
Renewable natural resources, including animal or vegetable oils, are combined with alcohol and a catalyst to make biodiesel. Biodiesel is mixed with diesel fuel in rimmed amounts for use in diesel engines without any alterations [2]. The biodiesel proportion may be utilized without making any alterations to the diesel engine; the biodiesel proportion has no problems in long-term performance testing. When comparing biodiesel proportion fuel attributes to diesel fuel, it can be noted that biodiesel proportion has a greater certain number, flash point, pour point, density, viscosity, and nearly no sulfur connection. The favorable qualities of the biodiesel proportion also include elements that have a detrimental impact on engine performance and emissions. Biodiesel ratios have poorer cold flow characteristics than diesel fuels, and winter weather might create issues once starting the engine for the first time. Pipes and gasoline filters may get blocked while utilizing biodiesel proportion fuel that contains significant concentrations of saturated fatty acids, particularly in the winter [3].
RSM may be utilized for improvement and forecasting in a variety of scientific domains. RSM looks at the uniqueness of the current studies to figure out the best way to run a biodiesel-powered engine in terms of performance and exhaust emissions [4].
There are many researches are used (RSM) to get high efficiency of thermal saving, and these researches convergence and in same direction with present research such as; “(RSM) to calculate energy saving associated with thermal comfort improvement in building", also "Application of (RSM) in treatment of final effluent from the sugar industry using chitosan". Therefore, the response surface methodology (RSM) is employed in the present research coupled with a group of variables that have an effect on engine performance and output exhaust from the combustion process.
2.1 Materials and methods
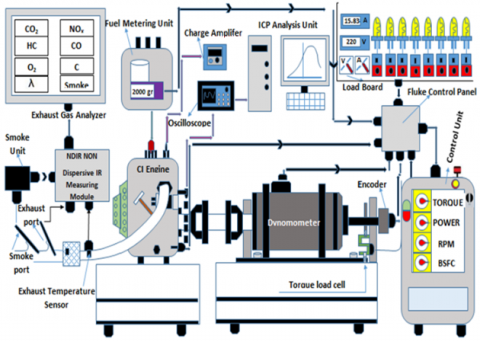
Tests on diesel engines with the specifications listed in Table 1 have been conducted for this project. Figure 1 shows a schematic depiction of the experimental setup. The fuel blends obtained by blending biodiesel (10 percent, 20 percent, and 30 percent) at four different engine loads were tested in this study (4, 5.5, and 7). The engine load has been (1500, 2000, and 2500) and the speed (rpm testing) was (1500, 2000, and 2500). (Nm). The biodiesel eaten in the tests was examined, and the results of the testing are shown in Table 2.
Figure 1. Schematic diagram of the test procedure
Table 1. Technical qualifications of the test engine
|
Model |
8041 i40 |
|
Type |
DI, 4 cycle, disiel natural aspirated |
|
Combustion typs |
Diract ingection |
|
Bore x stroke |
104 mm x 115 mm |
|
Cylinder nember |
Lellin 4 cycle |
|
Compression ratio |
17.1 |
|
Maximum speed |
2940 RPM |
|
Maximum torque |
266 Nm / 2300 RPM |
|
Stand -by(Maximum) rating |
64 kW(87HP)/2940 RPM |
|
Flywheel & Has |
SAE/11.5 |
|
Dry weights |
415 Kg |
|
Dimension L * W * H |
1094 * 680 * 885mm |
|
Fuel consumption |
296 g/kw.h (198g/HP.h)/2940 r.p.m |
|
Displement |
3, 9it |
Table 2. Features of fuels
|
Properties |
Diesel |
B10 |
B20 |
B50 |
|
Heat magnitude (MJ/kg) |
45.28 |
44.72 |
44.17 |
42.39 |
|
Cloud point (℃) |
18 |
17 |
17 |
15 |
|
Density @ 150℃ (kg/m3) |
853.8 |
855.0 |
855.4 |
876.8 |
|
Total sulphur (wt %) |
0.28 |
0.25 |
0.21 |
0.11 |
|
Viscosity @ 40℃ (cSt) |
3.60 |
4.16 |
4.52 |
4.60 |
|
Flash point (℃) |
93 |
96 |
98 |
110 |
|
Pour point (℃) |
12 |
9 |
6 |
6 |
|
Cetane number |
54.6 |
54.4 |
57.8 |
59.0 |
|
Carbon (wt%) |
84.1 |
82.3 |
82.0 |
78.5 |
|
Hydrogen (wt%) |
12.8 |
12.5 |
12.5 |
12.2 |
|
Oxygen (wt%) |
3.9 |
4.3 |
5.5 |
7.7 |
2.2 Response surface methodology
RSM has been integrated with the BBD approach in Minitab software to enhance the series of tests. Typically, the RSM is used to analyze efficient elements in order to maximize their outcomes towards the intended replies. RSM is a statistically based strategy for discovering and optimizing the communication between variables and responses [5-10].
The following Eq. (1) shows the simplest model that can be used in RSM. It is based on a linear function and is the simplest model.
$y =\beta o+\sum_i^k \beta i x i+\varepsilon$ (1)
If there would be any curvature in this model, a quadratic model has been used, as shown in Eq. (2).
$y =\beta o+\sum_i^k \beta i x i+\sum_i^k \sum_i^k \beta i x i+\varepsilon$ (2)
whereas, is haphazard test error, k is the number of parameters, y is the estimated response, xi and xj are independent parameters [5]. βo is the constant βi is the linear coefficient and ij interactive coefficient, i and j are the linear and quadratic coefficient, respectively.
The correlation coefficient (R2) was determined as per Eq. (3), the adjusted correlation coefficient (Adj. R2) was Formula utilizing Eq. (4), the forecast R2 was determined utilizing Eq. (5) with Eqns. (6) and (7) [11].
$R ^2=1-\left[\frac{\text { SS residual }}{\text { SSresidual+SSmodels }}\quad \right]$ (3)
$\operatorname{Adj} \cdot R ^2=1-\left[\left(\frac{\text { SS residual }}{ d \text { residual+SSmodels} }\right) /\left(\frac{\text { SS residual }+\text { SSmodels }}{\text { SSresidual }+\text { SSmodels }} \quad \right)\right]$ (4)
Pred. $R ^2=1-\left[\frac{\text { PRESS }}{ d \text { residual+SSmodels }}\quad \right]$ (5)
$\operatorname{PRESS}=\sum_{i=1}^n(e-1)^2$ (6)
$e-1=\frac{e i}{1-h i i}$ (7)
The model denotes the amount of variation described by testing the general model of significance; residual magnitudes determine the amount of unspecified variation in response. The square sum (SS) changes the mean total and amount of variation described by the source.
ei: Residual for each observation left from the model.
e-1: is a removal residue that tries to forecast.
3.1 Analysis (ANOVA)
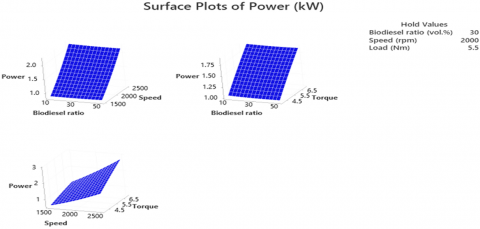
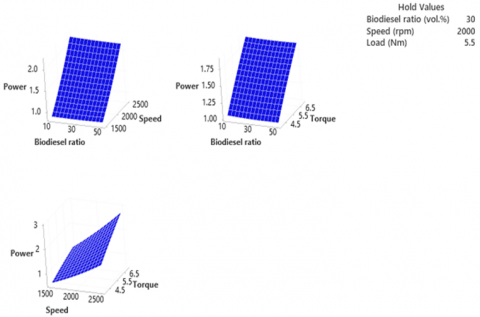
The common influence of different biodiesel ratio percentages, engine speed, and engine load change on power, BMEB, and BSFC are demonstrated in Figures 2 and 3. Power, BMEP, and BSFC were substantial parameters for the engines, which are typically affected by factors including compression proportion and combustion activity, speed, and engine load [12].
As shown in Table 3, analysis of variance (ANOVA) has been used to show relevant magnitudes between input components and responses. In order to determine if the proposed design was supported by the test results, statistical parameters such as R2, Adj. R2, F-test magnitude (F-magnitude), and probability magnitude must be examined (p-magnitude). The greater the F-magnitude and the smaller the P-magnitude, the more significant the related word in the response's proposed association. As a result, a P magnitude of less than 0.05 has been considered significant. The ANOVA results for engine performance and release reactions are shown in Table 3. As a result, the following elements are significant for power: biodiesel ratio (F-magnitude 1), speed (F-magnitude 14064.14), and load (F-magnitude 5433.39). Table 4 shows that the proposed model's P-magnitude and F-magnitude are 0.000 and 52.44, respectively, indicating that the terms of the developed model seem to be significant. Furthermore, given the terms of the proposed correlation, P-magnitudes and F-magnitudes show that speed is the most important factor. Furthermore, engine load has been determined to be the most relevant factor for BSFC, CO, NOx, CO2, HC, and smoke in terms of p-magnitude and F-magnitude. From variance analysis, we noted the following:
Speed is the most influencing factor on the power, biodiesel ratio.
Load is the most influencing factor on the BMEP.
Table 3. ANOVA for performance and releases responses
|
Source |
Power (Kw) |
BMEP (bar) |
BSFC (g/kWh) |
BSCO(g/kWh) |
||||
|
F mag. |
P mag. |
F mag. |
P mag. |
F mag. |
P mag. |
F mag. |
P mag. |
|
|
model |
2795.21 |
0 |
938.18 |
0 |
85.59 |
0 |
20.07 |
0 |
|
Liner |
7340.88 |
0 |
2545.28 |
0 |
207.03 |
0 |
36.1 |
0 |
|
B-Biodiesel (vol%) |
1.00 |
0.34 |
0.12 |
0.735 |
14.3 |
0.004 |
16.36 |
0.002 |
|
N(rpm) |
14064.14 |
0 |
2403.22 |
0 |
264.15 |
0 |
82.47 |
0 |
|
F (N.m) |
5433.39 |
0 |
4306.82 |
0 |
261.11 |
0 |
16.15 |
0.002 |
|
Square |
14.08 |
0.001 |
1.95 |
0.186 |
44.98 |
0 |
12.32 |
0.001 |
|
B*B |
0.43 |
0.528 |
0.66 |
0.437 |
1.36 |
0.271 |
0.06 |
0.819 |
|
N*N |
40.03 |
0 |
2.17 |
0.171 |
108.89 |
0 |
20.75 |
0.001 |
|
F*F |
3.84 |
0.079 |
2.27 |
0.163 |
10.52 |
0.009 |
12.65 |
0.005 |
|
2-way interaction |
237.30 |
0 |
37.9 |
0 |
10.31 |
0.002 |
3.73 |
0.049 |
|
B*N |
0.69 |
0.427 |
0.48 |
0.505 |
0.07 |
0.799 |
0.36 |
0.564 |
|
B*F |
0.36 |
0.562 |
0.09 |
0.77 |
0.84 |
0.381 |
0.17 |
0.686 |
|
N*F |
560.31 |
0 |
86.93 |
0 |
25.49 |
0.001 |
7.24 |
0.023 |
Table 4. ANOVA for performance and releases responses
|
Source |
BSHC(g/kWh) |
BSHC(g/kWh) |
BSNOX (g/kWh) |
Smoke |
||||
|
F mag. |
P mag. |
F mag. |
P mag. |
F mag. |
P mag. |
13.39 |
0 |
|
|
Model |
156.64 |
156.64 |
170.83 |
0 |
82.78 |
0 |
25.63 |
0 |
|
Liner |
442.32 |
442.32 |
428.71 |
0 |
233.21 |
0 |
0.42 |
0.534 |
|
B ratio Vol.% |
41.23 |
41.23 |
15.23 |
0.003 |
7.66 |
0.02 |
246 |
0.148 |
|
N (rpm) |
962.35 |
962.35 |
1167.76 |
0 |
609.9 |
0 |
68.96 |
0 |
|
F load (N.m) |
204.74 |
204.74 |
36.6 |
0 |
33.44 |
0 |
2.47 |
0.122 |
|
2-way interaction |
8.05 |
8.05 |
31.15 |
0 |
6.7 |
0.009 |
0.17 |
0.688 |
|
B*N |
2.26 |
2.26 |
1.97 |
0.191 |
0.72 |
0.417 |
0.71 |
0.419 |
|
B*F |
0.44 |
0.44 |
0 |
0.954 |
0 |
0.978 |
9.06 |
0.013 |
|
N*F |
19.08 |
19.08 |
81.31 |
0 |
13,8 |
0.004 |
13.39 |
0 |
(a)
(b)
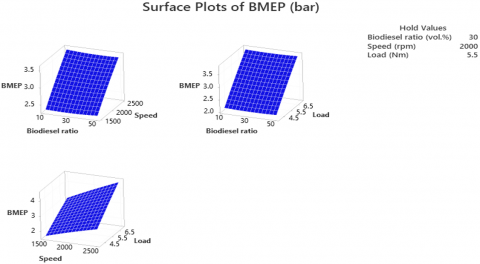
Figure 2. The combined influence of biodiesel ratio, speed, and load with power (a) for BSN; (b) for (BMBP)
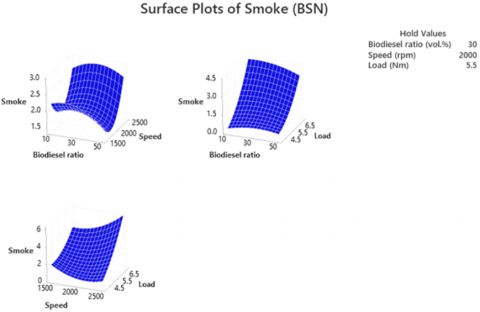
Figure 3. The combined influence of biodiesel ratio, speed, and load with power, and BSN smoke
In this investigation, increasing load power and increasing engine speed also led to increased power, but the biodiesel ratio increase had no effect on engine power as shown in (BMFB). With the increasing load, the BMEP decreased, and with increasing engine speed, the BMEP increased also, though the biodiesel ratio increase did not impact the BMEP.
The results were gained, and it was noticed that by increasing the load and the biodiesel, the smoke increased either by increasing the speed and gradually decreasing the pressure coefficient, or by starting to rise gradually with the increase in velocity in the case of load and speed, by increasing the load and the speed of reducing the smoke to the lowest level that can be compared (with load, pressure, speed, and biodiesel ratio (Vo%).
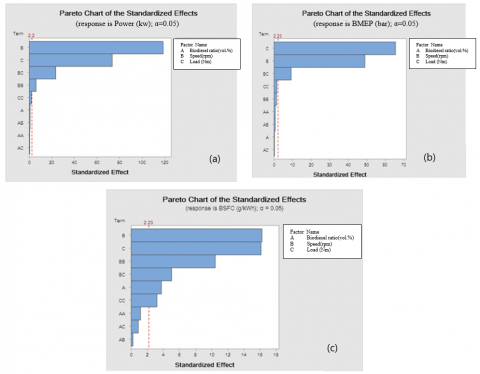
3.2 Manifesting of Power, BMEB and BSFC in Pareto chart
The Pareto chart depicts the absolute magnitudes of the standard influences, from the highest impact to the lowest influence. A control line is also drawn on the graph to indicate that statistically significant impacts seem to be present. Bars that crossed the control line on the Pareto chart were statistically significant.
In the power Pareto chart, bars N, F, NF, and BB pass the control line at 2.2, substantially affecting power. But FF, B, BN, BB, BF, no bar can pass the control line at 2.2. These meanings do not have a high influence on power.
In the BME Pareto chart, bars F, N, and NF pass the control line at 2.23, so they substantially affect BMEB, but FF, NN, BB, BN, B, and BF no bar may pass the control line that is at 2.23. This means this does not have a high influence on BMEB.
The bars N, F, NN, NF, B, and FF cross the control line at 2.23 on the BSFC Pareto chart, meaning they have a significant impact on BSFC. However, BB, BF, and BN no bar can pass the control line at 2.23. This indicates that no single functioning parameter has a significant impact on BSFC. Figure 4 shows engine factor in Pareto charts effect on engine performance.
The equations of variables to draw pareto charts as following:
Power (kW)=0.568 - 0.00108 A - 0.000895 B - 0.0941 C + 0.000021 A*A + 0.000000 B*B - 0.00837 C*C - 0.000001 A*B + 0.000142 A*C + 0.000229 B*C (8)
BMEP (bar)=-1.123 - 0.00225 *A + 0.000632* B + 0.296 C + 0.000058 A*A- 0.000000 B*B - 0.01417 C*C - 0.000001 A*B + 0.000157 A*C + 0.000199 B*C (9)
BSCO (g/kWh) =99.0 - 0.174*A - 0.0615 *B - 8.94 *C+ 0.00070 A*A + 0.000016 B*B + 1.401 C*C+ 0.000041 A*B - 0.0091 A*C - 0.002401 B*C (10)
BSHC (g/kWh) = 0.6502 - 0.001525 A - 0.000211 B- 0.0763 C + 0.000007 A*A+ 0.000000 B*B + 0.00389 C*C+ 0.000000 A*B+ 0.000037 A*C + 0.000010 B*C (11)
BSFC (g/kWh =1437.6 + 1.703 A - 0.7143 B) - 106.7 C - 0.0132 A*A+ 0.000140 B*B + 4.86 C*C- 0.000069 A*B - 0.0762 A*C + 0.01713 B*C (12)
Figure 4. Engine factor in Pareto charts effect on engine performance
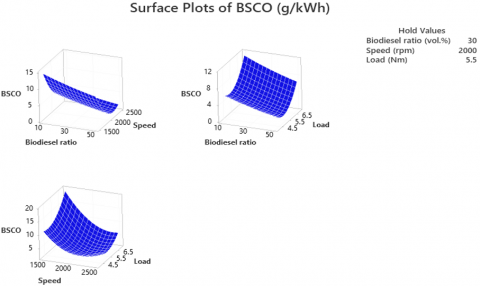
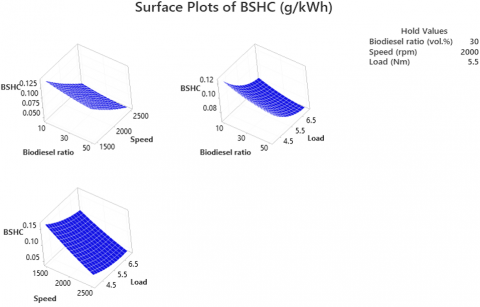
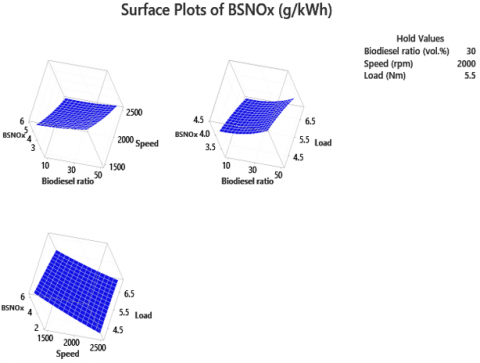
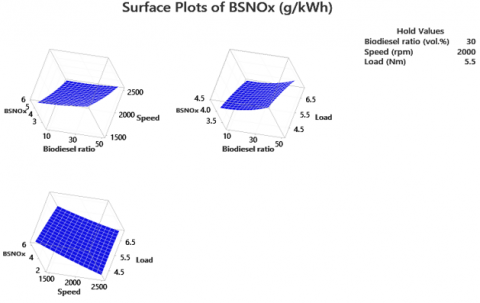
The ratio percentages have an effect on biodiesel reactivities, EHN, and loading on exhausting responses of releases. The combined impact of biodiesel ratio percentages, speed, and engine loading on CO, NOx, CO2, HC, and smoke releases was demonstrated in Figures 5, 6, 7, which show:
When the fuel combination's biodiesel ratio increases, BSCO and BSHC decrease, BSNOx increases, and BSCO2 will decrease to about 30% vol. and after that not be influenced, smoke releases will increase to about 30% vol. of biodiesel. After that, it will start to decrease.
When the engine speed increases, the BSCO and smoke will decrease to 2250 rpm. After that, they will increase. BSCO2, BSHC, and BSNOx will decrease with engine speed increasing.
When the engine load increases, the BSCO will decrease to about 5 Nm, and after that, it will start to increase. BSCO2, BSNOx, and BSHC will decrease. Smoke releases will increase.
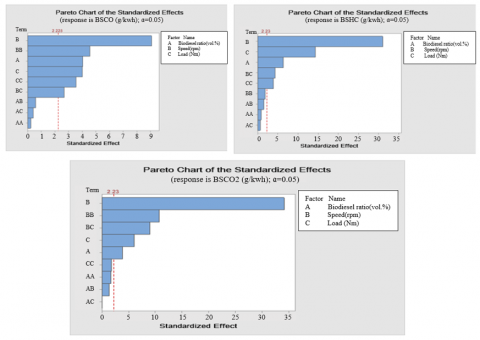
On the BSHC Pareto chart, bars B, A, C, and BC pass the control line at 2.23, so they substantially affect HC releases. However, BB, AB, AA, CC, and AC bars do not pass the reference line, so they do not substantially affect HC releases.
Figure 5. The combined biodiesel ratio, speed and load on, and HC releases
Figure 6. The combined seepage ratio, speed, and load influence CO2 releases
Figure 7. Pareto Chart of releases' CO, CO2 and HC
A high rise in hydrocarbons is observed in (BSHC) the increase in the load, biodiesel, and speed. This causes an increase in releases resulting from incomplete combustion in the internal combustion engine. Also (BSCO), it was found that carbon dioxide begins to decrease with increasing load and compression, and this is a good finding because it reduces the releases resulting from the combustion process.
The real cause of CO2 formation is seepage of combustion because there is not enough oxygen. The increase in the compression ratio leads to an increase in the load and the speed. The releases from internal combustion also increase. The reason is incomplete combustion and the lower temperatures in the combustion area due to the cooling influence.
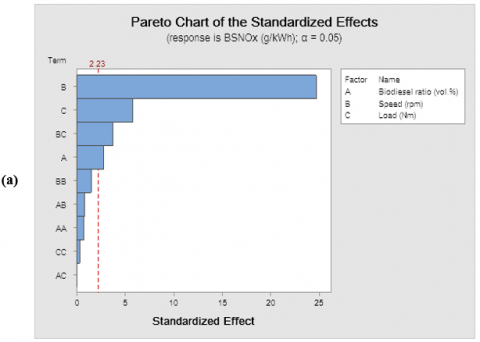
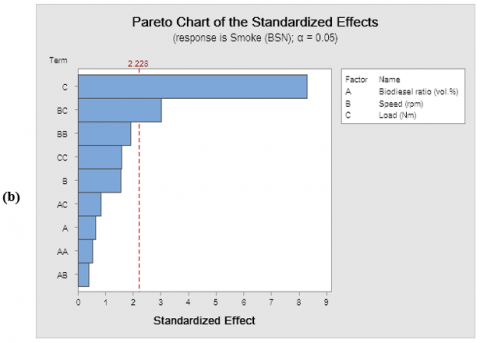
3.3 Representing CO, CO2, NOx HC, and smoke on Pareto charts
On the BSCO Pareto chart, bars B, BB, BC, C, and A pass the control line at 2.228, so they substantially affect CO releases as shown in Figures 8, 9, and 10. However, AB, AC, and AA bars do not pass the reference line, so they do not indicate an influence on CO releases.
On the BSCO2 Pareto chart, the bars B, BB, A, C, CC, and BC pass the control line at 2.23, so they have a substantial influence on CO2 releases, but CC, AA, AB, and AC bars do not pass the reference line, so they do not have to indicate influence on CO2 releases.
On the BSNOx Pareto chart, the bars B, A, C, and BC pass the control line at 2.23, so they have a substantial influence on NOx releases, but BB, AB, AA, CC, and AC bars do not pass the reference line, so they do not have to indicate influence on NOx releases.
On the smoke Pareto chart, bars B and BC pass the control line at 2.23, so they substantially affect smoke releases. The other bars do not pass the reference line, so they do not have to signify influence on smoke releases.
In this investigation, the load and the BSFC increase with the increase in engine speed. BSFC will start to increase when the percentage of biodiesel from BSFC increases to 35% vol., after that it will start to decrease (BSNOx). Also, by increasing the load and the biodiesel ratio factor, the releases produced from the combustion process decrease, which is a good finding for reducing releases.
Figure 8. The combined biodiesel ratio, speed, and load influence BSNOx and BSFC releases
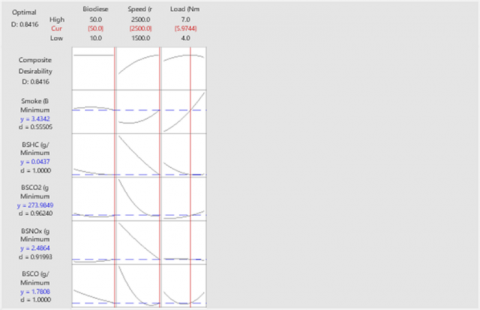
Figure 9. Optimization results
Figure 10. Pareto chart of releases' smoke and NO
Table 5. Confirmations evaluations for improved and testing magnitudes with % error
|
Solution |
Biodiesel ratio (vol. %) |
Speed (rpm) |
Load (Nm) |
Smoke (BSN) Fit |
BSHC (g/kWh) Fit |
BSCO2 (g/kWh) Fit |
BSNOx (g/kWh) Fit |
|
1 |
50 |
2500 |
5.97442 |
3.43417 |
0.0436773 |
273.985 |
2.48637 |
|
Solution |
BSCO (g/kWh) Fit |
BSFC (g/kWh) Fit |
BMEP (bar) Fit |
Power (kW) Fit |
Composite Desirability |
||
|
1 |
1.78076 |
338.131 |
3.84655 |
2.36665 |
0.841634 |
||
3.4 Optimization and validation
The optimization concepts were to optimize the total desirability function and power, and BMEB while limiting BSFC and exhaust releases, including CO2, CO, HC, NOx, and smoke, as shown in Table 5 and Figure 8. Minitab was used in this study to optimize the impact of the biodiesel proportion on changing speed and load. Figure 8 shows improved engine operating factors that occur as a result of the optimization criteria that have been identified, as well as optimal reaction factors as a result of these factors. The best engine parameters were discovered to be 50% biodiesel, 2500 rpm, and 5.9744 loads. The optimal responses depending on these optimal factors have been power (KW) 2.36665, BMEB (bar) 3.6465, BSFC (g/Kwh) 338.131, and exhaust releases were 1.7807 (g/kWh) BSCO, 273.985 (g/kWh) BSCO2, 0.0436773 (g/kWh) BSHC, 2.48637 (g/kWh) NOx, and 3.43418 (g/kWh) smoke. Furthermore, a validating test is necessary after optimization to determine the veracity of the optimization results. A test has been carried out to verify the magnitude of the improved engine factors that were gained via optimization. The optimized results, validation test findings, and error rates are all demonstrated in Table 5. All error rates have been less than 5%.
Optimize the effect of the biodiesel proportion, speed, and load on the performance and releasing properties of diesel engines. The tests have been carried out with various biodiesel ratios (10%, 20%, and 50%) and different speeds (rpm) (1500, 2000, and 2500) at four different engine loads (Nm) (4, 5.5, and 7). Three continuous factors were tested for the RSM, BBD type, biodiesel percentage, speed, and load as input components, while response factors were selected for power, HC, CO, NOx, BSFC, BMEB, and HC smoke. The effectiveness of the specified input factors has been assessed using Pareto charts. The main findings of the present investigation are outlined below. The optimal engine variables were discovered to be a 50-percent biodiesel ratio, a speed of 2500 rpm, and a load of 5.9744 Nm.
The optimal engine performance responses depending on these optimal factors have been Power (KW) 2.36665, BMEB (bar) 3.6465, BSFC (g/Kwh) 338.131.
The exhaust released was 1.7808 (g/kWh). 273.985 (g/kWh) BSCO 2,0.0436773 (g/kWh) BSCO BSHC, NOx (2.48637 g/kWh), and 3.43418 g/kWh smoke.
The results showed a good match between the optimization conclusions and the experimental data, with an error rate of less than 5%. The findings show that the RSM can efficiently optimize biodiesel-fueled engine performance and release characteristics.
Depending on the findings of the current investigation, it has been concluded that the current investigation may help engine makers and researchers optimize engine settings to improve engine releases and performance while saving time and engineering work. Determining the effect rates of engine settings is also important.
|
Abbreviations |
Symbols |
|
DOE Design of Experiments A |
Biodiesel ratio (%) |
|
Brake specific fuel consumptions (BSFC) |
B Load (Watt) |
|
BTHE brake thermal efficacy |
C (speed)(m) |
|
Carbon monoxides (CO) |
Adj-R2 adjusted R2 magnitude |
|
Hydrocarbons (HC) |
F-magnitude magnitude of F-test |
|
Nitrogen oxides (NOx) |
Pred-R2 predicted R2 magnitude |
|
Responses surface methodologies (RSM) |
P-magnitude probability magnitude |
|
Sum square (SS) |
Pred-R2 predicted R2 magnitude |
|
ANOV |
An analysis of variance |
|
BBD |
box-Behnken design |
|
BSFC |
brake specific fuel consumption |
|
NOx |
nitrogen oxides(g/Kwh) |
|
CO |
carbon monoxides(g/Kwh) |
|
HC |
hydrocarbon(g/Kwh) |
|
R2 |
correlation coefficient |
|
CO2 |
carbon dioxides(g/Kwh) |
|
B |
Biodiesel ratio (vol. %) |
|
Adj-R2 |
adjusted R2 magnitude |
|
N |
Speed(rpm) |
|
F |
Load (Nm) |
|
F-magnitude |
predicted R2 magnitude |
|
P-magnitude |
probability magnitude |
|
Pred-R2 |
predicted R2 magnitude |
|
BMEP |
Break mean effective pressure |
[1] Taha, M.A., Ali, O.M., Weis, M.M. (2021). Implementation of fusel oil as an octane enhancer with commercial gasoline to operate gasoline engine. International Journal of Design & Nature and Ecodynamics, 16(5): 593-599. https://doi.org/10.18280/ijdne.160514
[2] Girardi, P., Gargiulo, A., Brambilla, P.C. (2015). A comparative LCA of an electric vehicle and an internal combustion engine vehicle using the appropriate power mix: the Italian case study. The International Journal of Life Cycle Assessment, 20(8): 1127-1142. https://doi.org/10.1007/s11367-015-0903-x
[3] Ceviz, M.A., Yüksel, F. (2005). Effects of ethanol – unleaded gasoline blends on cyclic variability and emissions in an SI engine. Applied Thermal Engineering, 25(5-6): 917-925. https://doi.org/10.1016/j.applthermaleng.2004.07.019
[4] Bharadwaz, Y.D., Rao, B.G., Rao, V.D., Anusha, C. (2016). Improvement of biodiesel methanol blends performance in a variable compression ratio engine using response surface methodology. Alexandria Engineering Journal, 55(2): 1201-1209. https://doi.org/10.1016/j.aej.2016.04.006
[5] Simsek, S., Uslu, S. (2020). Investigation of the effects of biodiesel/2-ethylhexyl nitrate (EHN) fuel blends on diesel engine performance and emissions by response surface methodology (RSM). Fuel, 275: 118005. https://doi.org/10.1016/j.fuel.2020.118005
[6] Yaliwal, V.S., Banapurmath, N.R., Gaitonde, V.N., Malipatil, M.D. (2019). Simultaneous optimization of multiple operating engine parameters of a biodiesel-producer gas operated compression ignition (CI) engine coupled with hydrogen using response surface methodology. Renewable Energy, 139: 944-959. https://doi.org/10.1016/j.renene.2019.02.104
[7] Sakthivel, R., Ramesh, K., Marshal, S.J.J., Sadasivuni, K.K. (2019). Prediction of performance and emission characteristics of diesel engine fueled with waste biomass pyrolysis oil using response surface methodology. Renewable Energy, 136: 91-103. https://doi.org/10.1016/j.renene.2018.12.109
[8] Kashyap, D., Das, S., Kalita, P. (2021). Exploring the efficiency and pollutant emission of a dual fuel CI engine using biodiesel and producer gas: An optimization approach using response surface methodology. Science of the Total Environment, 773: 145633. https://doi.org/10.1016/j.scitotenv.2021.145633
[9] Xu, H., Yin, B., Liu, S., Jia, H. (2017). Performance optimization of diesel engine fueled with diesel – jatropha curcas biodiesel blend using response surface methodology. Journal of Mechanical Science and Technology, 31(8): 4051-4059. https://doi.org/10.1007/s12206-017-0753-5
[10] Bharadwaz, Y.D., Rao, B.G., Rao, V.D., Anusha, C. (2016). Improvement of biodiesel methanol blends performance in a variable compression ratio engine using response surface methodology. Alexandria Engineering Journal, 55(2): 1201-1209. https://doi.org/10.1016/j.aej.2016.04.006
[11] Katekaew, S., Suiuay, C., Senawong, K., Seithtanabutara, V., Intravised, K., Laloon, K. (2021). Optimization of performance and exhaust emissions of single-cylinder diesel engines fueled by blending diesel-like fuel from Yang-hard resin with waste cooking oil biodiesel via response surface methodology. Fuel, 304: 121434. https://doi.org/10.1016/j.fuel.2021.121434
[12] Elkelawy, M., El Shenawy, E.A., Bastawissi, H.A.E., Shams, M.M., Panchal, H. (2022). A comprehensive review on the effects of diesel/biofuel blends with nanofluid additives on compression ignition engine by response surface methodology. Energy Conversion and Management: X, 14: 100177. https://doi.org/10.1016/j.ecmx.2021.100177