Khamis Naba Sayl | Sadeq Oleiwi Sulaiman | Ammar Hatem Kamel | Nadhir Al Ansari*
© 2022 IIETA. This article is published by IIETA and is licensed under the CC BY 4.0 license (http://creativecommons.org/licenses/by/4.0/).
OPEN ACCESS
Hydrological soil group is essential to soil information for several fields of modeling and applications. This information can affect suitable environmental, agricultural, and hydrological development. Laboratory analysis for soil sampling cannot efficiently provide the needed information because these analyses are commonly costly, time-consuming, and limited in retrieving the temporal and spatial variability. In this context, remote sensing is now solid to offer meaningful spatial data for studying soil characteristics on various spatial scales utilizing the different spectral reflectance. For this study, the integration of Geographic Information System (GIS) remote sensing data and survey data with the Artificial Neural Network (ANN) were used to generate a hydrological soil group map and to infer spatial patterns of soils across complete area converges for Alghadaf Wadi in the Western Desert of Iraq. The generated soil information was tested based on the sand, silt, and clay content. The testing result indicated that the differences between actual and predicted values to determine soil classes are agreed well. Therefore, this method is vital for mapping and monitoring soil texture by providing timely, fast repetitive data and relatively cheap.
hydrological soil group, curve number, geographic information system, artificial neural network, western desert of Iraq
Soil type is essential information for managing and planning water resources and monitoring the environmental impact of development. A thorough comprehensive of soil information can positively affect the application of sustainable ecological, hydrological, and agricultural development. The statement of soil characteristics in spatial and temporal form is essential for several fields of modeling and application, such as farming, forestry, runoff, and erosion simulation [1, 2]. The rate of runoff to the infiltration of rainfall depends on the soil texture, which is considered the main parameter that affects the runoff of the catchment. Hence, the soil texture is an essential factor in selecting the type and the location of structures in terms of stability and potentiality of surface runoff [3-5].
Soil Conservation Service (SCS) is efficient modeling; it is widely applied in many types of research to determine the surface runoff from an inevitable occurrence of rainfall [6-9]. This type of modeling relies on providing the Curve Number (CN). Curve Number is derived from the land use/cover and the soil texture where the soil texture is classified into subgroups. The United State Geology Survey (USGS) classified the hydrological soil groups into four classes [10, 11]. CN is a critical factor for starting modeling to estimate the storm runoff in many hydrological models such as Environmental Policy Integrated Climate (EPIC) [12], Soil and Water Assessment Tool (SWAT) [13, 14], and Agricultural Non-Point Source Pollution (AGNPS) [15, 16].
Identifying the soil type based on laboratory tests is costly and time-consuming. Remote sensing is one of the access methods and the best alternatives that can be applied to offer valuable information for soil investigation and monitoring. Where this information can be used for site designing and planning construction activities. Indeed, remote sensing is a powerful method of predicting soil characteristics on different spatial scales based on different electromagnetic spectrum ranges [17, 18].
The difference in spectral reflectance, which is the ratio of radiant energy reflected that incident on a body, is a function of several important properties of soil [19-21]. The physical and chemical characteristics of materials define the spectral reflectance utilized to recognize them.
Five specific soil spectral reflectance curves have been developed by Salisbury et al. [22, 23]. These curves were used to identify organic matter, iron, and soil texture based on the relationship between reflectance and soil type. Many researchers used laboratory spectral analysis to recognize some soil characteristics [24-26]. The correlation between laboratory analysis and image data of Landsat TM and SPOT are used to define various soil texture categories [27, 28].
The component image with band two and band 8 of the Advanced Spaceborne Thermal Emission and Reflection (ASTER), were used to predict the soil texture categories by Apan et al. [27]. They found that soil absorption features can recognize the changes between clay soil and quartz on the map. Bands 5 and 6, representing a short wave of ASTER, can be detected in the clay soil, while the thermal bands (10-14) can be used for quartz index [29]. The short and thermal could see the dark clayey soil and sandy, but the results are fluctuated depending on the organic substance [22, 30].
Soil reflectance is quite a complex phenomenon. Consequently, it is hard to estimate the soil characteristics based on the physical model [31]. The theoretical approach is always not valid for soil properties assessment and does not agree with reality [19]. Thus, to tackle the complex relationship between soil properties and spectral reflectance, there is a need for a method that can handle the nonlinearity in this task.
The Western desert of Iraq is a vast area, and soil data are scarce [32-35]. Remote sensing is an efficient tool to provide a database of soil maps in digital form. These maps are generated based on the interpolation of the primary data source. The traditional interpolation consists of a severe issue to handle the complexity of reflectance with soil texture, especially in the broad areas. Hence, the following study presents an intelligible methodology for soil texture recognition. This methodology combines Artificial Neural networks (ANN) with remote sensing data and the Geographic Information System (GIS). Using Artificial Intelligence (AI) will improve the perspectives of digital soil mapping and integrate it with GIS to accomplish complete region coverage.
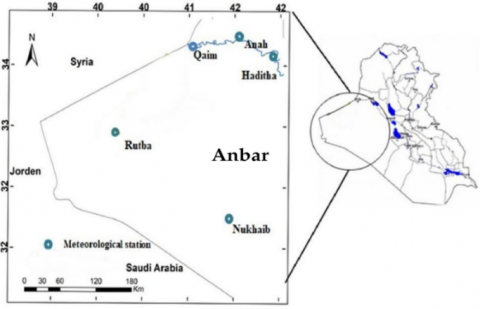
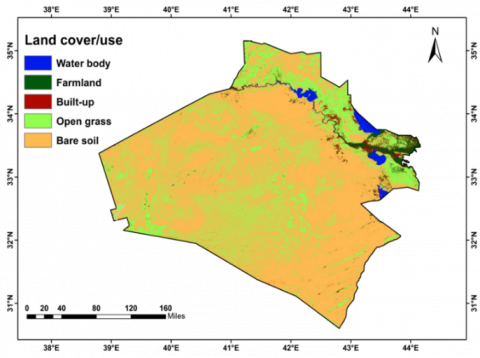
Anbar province is the study area in this research. It is the western desert of Iraq. It has the geographic coordinates between 30°36'01" to 35°09'32″ N and 38°47'35″ to 44° 09'38″ E, and has a total area of 138,500 km2, as shown in Figure 1. The climate is arid, with superb in winter and dry in summer. The variation in day temperature is around 36℃ [36-38]. Under these conditions, the land surface is heated in the daytime and cool at night. The evaporation rate is 3200 mm, and the average annual rainfall is 115 mm. These conditions with a high infiltration rate caused scarce water resources for the region. The study area is a flat region, rising in elevation westwards—generally, the topographic incline of the part from east to west. The western desert of Iraq belongs to the Inner Platform of the Arabian Platform [39-42]. The landform of the case study is a consequence of a complex interaction between lithology, structure, and climate. The central plateau of the study area is rocky [43-45]. Topographically, the studied area is described by a regular increase in elevation from east to west [46, 47]. The drainage is chiefly easterly and northeasterly. The general characteristics of the study area are thick soil cover and the absence of vegetation. Based on the supervised classification by Arc-GIS as shown in Figure 2, most of the study area was covered by bare soil (72.5%) flowed by open grass (22.1%), farmland (2.81%), water body (1.28%), built-up (1.33%) of the total area.
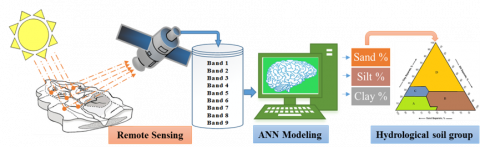
The following methodology consists of several steps of data collection, preparing, and modeling to achieve the aim of this study, as shown in Figure 2. The methodology is represented in the following steps:
First steps: Unsupervised classification has been performed on the satellite image of the case study (Landsat 8, August 2014). The classification process is based on the unsupervised algorithm and rectified with the spot heights and ground points. The unsupervised classification is a significant stage for preparing the primitive maps for soil sample collection and survey.
Figure 1. The location of the study area
Figure 2. Schematic of methodology
Second step: Soil sampling; in this step, different locations of samples were selected based on the previous step. The sites are chosen to cover all the study areas and include all the classes on the map. Laboratory tests using sieve analysis are used to predict soil texture for each sample.
Third Step: Based on the satellite image (Landsat 8), determine the location of the selected sample by using GPS. In addition, the spectral reflectance, represented by nine bands for each piece, was determined using ERDAS software for each sample.
Final step: all the data and results of the laboratory collected from previous actions will be used as the Neural Network model database. Radial basis neural networks have been utilized to determine the soil texture rely on spectral reflectance. Thus, the neural network results are integrated into GIS to provide a digital soil map for the catchment.
The unsupervised map gives a good representation of some classes. These classes are categorized based only on the natural grouping in the image value. Thus, the unsupervised classification is a suitable technique to prepare a primitive map for soil survey to collect soil samples. This process will reduce the effort, cost, and time. To accurately estimate soil type, selecting soil sample location is performed based on specific criteria. Therefore, the unsupervised classification will be accomplished. Figure 3 shows the selected part of the study region where the unsupervised classification is performed. Flat surface, bare soil, and consistency of all types of classification were recommended to choose this part of the study area with a suitable scale for reconnaissance. In addition, the surveillance according to the primitive map will reduce the errors of the pixel vegetation cover, which is recommended not covering over 20%, as well as the mistakes of spectral signatures of water, urban areas, roads, soil roughness topography, and slope for each location selected. These conditions are suggested to provide an accurate classification [48, 49]. In this figure, six classes are available, which represent the land cover classes; each class is given specific color. The number and location of each sample are shown in this figure, which has been taken into different categories for sieve analysis. There are 19 samples in and out of the selected region to cover the study area using a GPS device. By using ERDAS software, spectral reflectance has been recorded for each position. Nine bands were used while two thermal bands were reduced.
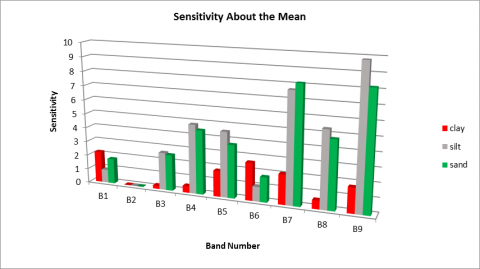
Sensitivity analysis has been applied to express and assure the complicity relation of soil type with reflectance. Figure 4 illustrates the sensitivity of clay, sand, and silt to the bands. It is obvious that Figure 4 shows that the soil type undetectable by band 2. In contrast, band7 and band 9 are the greatest sensitive with the soil type, especially sand and silt while clayey soil can be estimated by band 1, band seven, and band 6. The spectral reflectance of soil type and bands are very complex where all bands are participating in detecting specific but in different weights. Indeed, reflectance variation over bands can be a good platform for building a highly accurate model for soil type estimation. Thus, it is essential to containing all the bands in the ANN model.
Figure 3. Land cover/use of the study area
Figure 4. Soil type sensitivity with bands reflectance
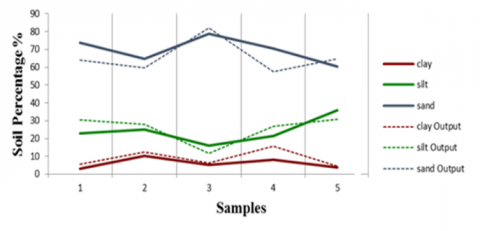
The actual and estimated values of the ANN model are illustrated in Figure 5. This figure shows that the soil type of the study region is sandy with the highest percentage compared with clay and silt. Also, this figure demonstrated that the estimated values of clay are more accurate than silt and sand, while a considerable fluctuation between estimated and actual values of sandy soil. Indeed, the performance of the ANN model is constant therefore the total percentage for the estimated output of the ANN model is 100%. Thus, it can be concluded that a low percentage estimation is more accurate than a high percentage.
Figure 5. Estimated and actual values of sand, silt, and clay of tested samples
For evaluating the modeling performance, where Table 1. presents the performance for each type of soil. Obviously, there is a noticeable variation in the accuracies of estimation values of the three types of soil. The clay prediction has superior results among other classes in all performance criteria were the lowest RMSE, NRMSE, and r (3.811, 0.1002, and r =0.8565) respectively). By comparing the accuracies of sand and silt, some fluctuation in results can be seen. Based on NRMSE, sand has more minor errors than silt. In contrast, silt estimation performs better than sand estimation depending on RMSE and r.
Table 1. Performance criteria of Neural network model for clay, silt, and sand
|
Performance |
Clay |
silt |
sand |
|
RMSE |
3.811 |
7.209 |
9.034 |
|
NRMSE |
0.1002 |
0.2301 |
0.252 |
|
R |
0.86 |
0.64 |
0.49 |
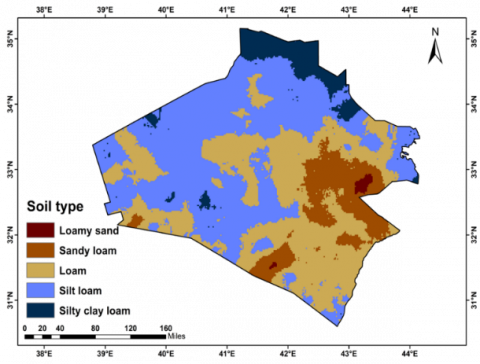
Figure 6. Soil type map of the study area
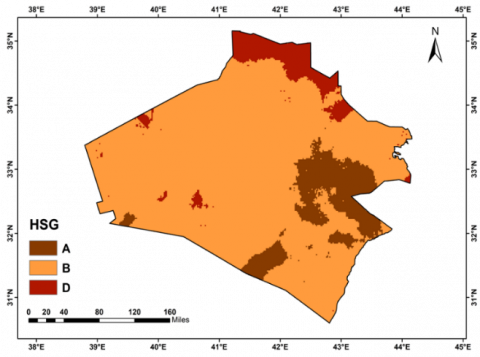
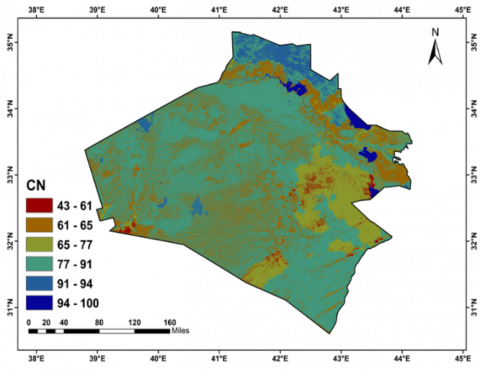
As mentioned previously, this paper's main objective is to develop a Curve Number (CN) map for Anbar province, where Figure 6 represents the soil type of this study. By simulating the reflectance of 3000 points in different locations in the ANN model, the percentage of soil types is integrated with GIS. This map shows the distribution of hydrological soil type (Figure 7) over the study area which is an important parameter for a variety of types of investigation. Land cover and hydrological soil group maps were used to generate Curve Number (CN) for the study area as shown in Figure 8.
Figure 7. Hydrological soil group map of the study area
Figure 8. Curve number map of the study area
Remote sensing is a significant tool for monitoring, detecting, and mapping soil texture by providing repetitive data and relatively cheap as well as fast, and timely. Prediction of soil classes based on the use of the relationship between soil type and spectral reflectance was attempted in this study. The hydrological soil group represents as a platform for several fields of modeling and applications. This calls for generating to support timely decision making on land management and planning of water resources. The combined procedure of Geographic Information System and Remote Sensing data with Artificial Neural Network were used to generate a hydrological soil group. The performance of this methodology was tested according to the difference between actual and predicted values. The results show that the clay prediction has superior results among other types in all performance criteria were the lowest RMSE, NRMSE, and r (3.811, 0.1002, and r =0.8565) respectively. By comparing the accuracies of sand and silt, it can be seen some fluctuation in results. Based on NRMSE sand has less errors than silt. In contrast, silt estimation performs better than sand estimation depending on RMSE, and r.
[1] Hashim, H.Q., Sayl, K.N. (2020). The application of radial basis network model, GIS, and spectral reflectance band recognition for runoff calculation. International Journal of Design & Nature and Ecodynamics, 15(3): 441-447. http://dx.doi.org/10.18280/ijdne.150318
[2] Muneer, A.S., Afan, H.A., Kamel, A.H., Sayl, K.N. (2022). Runoff mapping using the SCS-CN method and artificial neural network algorithm, Ratga Basin, Iraq. Arabian Journal of Geosciences, 15(7): 1-10. https://doi.org/10.1007/s12517-022-09954-y
[3] Jasrotia, A.S., Majhi, A., Singh, S. (2009). Water balance approach for rainwater harvesting using remote sensing and GIS techniques, Jammu Himalaya, India. Water Resources Management, 23(14): 3035-3055. https://doi.org/10.1007/s11269-009-9422-5
[4] Noon, A.M., Ahmed, H.G., Sulaiman, S.O. (2021). Assessment of water demand in Al-Anbar Province-Iraq. Environment and Ecology Research, 9(2): 64-75. https://doi.org/10.13189/eer.2021.090203
[5] Muneer, A.S., Sayl, K.N., Kamel, A.H. (2020). Modeling of runoff in the arid regions using remote sensing and geographic information system (GIS). International Journal of Design & Nature and Ecodynamics, 15(5): 691-700. https://doi.org/10.18280/ijdne.150511
[6] Senay, G.B., Verdin, J.P. (2004). Developing index maps of water-harvest potential in Africa. Applied Engineering in Agriculture, 20(6): 789. http://dx.doi.org/10.13031/2013.17725
[7] De Winnaar, G., Jewitt, G.P.W., Horan, M. (2007). A GIS-based approach for identifying potential runoff harvesting sites in the Thukela River basin, South Africa. Physics and Chemistry of the Earth, Parts A/B/C, 32(15-18): 1058-1067. https://doi.org/10.1016/j.pce.2007.07.009
[8] Tyagi, J.V., Mishra, S.K., Singh, R., Singh, V.P. (2008). SCS-CN based time-distributed sediment yield model. Journal of hydrology, 352(3-4): 388-403. https://doi.org/10.1016/j.jhydrol.2008.01.025
[9] Elewa, H.H., Qaddah, A.A. (2011). Groundwater potentiality mapping in the Sinai Peninsula, Egypt, using remote sensing and GIS-watershed-based modeling. Hydrogeology Journal, 19(3): 613-628. https://doi.org/10.1007/s10040-011-0703-8
[10] Melesse, A.M., Shih, S.F. (2002). Spatially distributed storm runoff depth estimation using Landsat images and GIS. Computers and Electronics in Agriculture, 37(1-3): 173-183. https://doi.org/10.1016/S0168-1699(02)00111-4
[11] Hashim, H.Q., Sayl, K.N. (2022). Incorporating GIS Technique and SCS-CN approach for runoff estimation in the ungauged watershed: A case study west desert of Iraq. Iraqi Journal of Civil Engineering, 14(2): 1-6. https://ijce.uoanbar.edu.iq/article_172862.html
[12] Wang, X., Williams, J.R., Gassman, P.W., Baffaut, C., Izaurralde, R.C., Jeong, J., Kiniry, J.R. (2012). EPIC and APEX: Model use, calibration, and validation. Transactions of the ASABE, 55(4): 1447-1462. http://dx.doi.org/10.13031/2013.42253
[13] Neitsch, S.L., Arnold, J.G., Kiniry J.R., Srinivasan, R., Williams, J.R. (2011). Soil and water assessment tool input/output file documentation version 2009. Journal of Information Processing & Management. https://hdl.handle.net/1969.1/128050.
[14] Sulaiman, S.O., Kamel, A.H., Al-Ansari, N. (2021). The evaluation of the SWAT model performance to predict the runoff values in the Iraqi western desert: The evaluation of the SWAT model performance to predict the runoff values in the Iraqi western desert. Environment and Ecology Research, 9(6): 330-339.
[15] Young, R.A., Onstad, C.A., Bosch, D.D., Anderson, W.P. (1989). AGNPS: A nonpoint-source pollution model for evaluating agricultural watersheds. Journal of Soil and Water Conservation, 44(2): 168-173.
[16] Sayl, K.N., Muhammad, N.S., El-Shafie, A. (2019). Identification of potential sites for runoff water harvesting. In Proceedings of the Institution of Civil Engineers-Water Management, 172(3): 135-148. https://doi.org/10.1680/jwama.16.00109
[17] Lacoste, M., Minasny, B., McBratney, A., Michot, D., Viaud, V., Walter, C. (2014). High resolution 3D mapping of soil organic carbon in a heterogeneous agricultural landscape. Geoderma, 213: 296-311. https://doi.org/10.1016/j.geoderma.2013.07.002
[18] Mohammed, O.A., Sayl, K.N. (2020). Determination of Groundwater potential zone in arid and semi-arid regions: A review. In 2020 13th International Conference on Developments in eSystems Engineering (DeSE), Liverpool, United Kingdom, pp. 76-81. https://doi.org/10.1109/DeSE51703.2020.9450782
[19] Dwivedi, S.R. (2017). An Introduction to Remote Sensing. Berlin, Heidelberg: Springer Berlin Heidelberg. https://doi.org/10.1007/978-3-662-53740-4
[20] Martin, M.P., Orton, T.G., Lacarce, E., Meersmans, J., Saby, N.P.A., Paroissien, J.B., Jolivet, C., Boulonne, L., Arrouays, D. (2014). Evaluation of modelling approaches for predicting the spatial distribution of soil organic carbon stocks at the national scale. Geoderma, 223-225: 97-107. https://doi.org/10.1016/j.geoderma.2014.01.005
[21] Sims, D.A., Gamon, J.A. (2002). Relationships between leaf pigment content and spectral reflectance across a wide range of species, leaf structures and developmental stages. Remote Sensing of Environment, 81(2-3): 337-354. https://doi.org/10.1016/S0034-4257(02)00010-X
[22] Salisbury, J.W., D'Aria, D.M. (1992). Infrared (8–14 μm) remote sensing of soil particle size. Remote Sensing of Environment, 42(2): 157-165. https://doi.org/10.1016/0034-4257(92)90099-6
[23] Muneer, A.S., Sayl, K.N., Kamal, A.H. (2021). Modeling of spatially distributed infiltration in the Iraqi Western Desert. Applied Geomatics, 13(3): 467-479. https://doi.org/10.1007/s12518-021-00363-6
[24] Chang, C.W., Laird, D.A. (2002). Near-infrared reflectance spectroscopic analysis of soil C and N. Soil Science, 167(2): 110-116. http://dx.doi.org/10.1097/00010694-200202000-00003
[25] Minasny, B., McBratney, A.B. (2008). Regression rules as a tool for predicting soil properties from infrared reflectance spectroscopy. Chemometrics and Intelligent Laboratory Systems, 94(1): 72-79. https://doi.org/10.1016/j.chemolab.2008.06.003
[26] Nanni, M.R., Demattê, J.A.M. (2006). Spectral reflectance methodology in comparison to traditional soil analysis. Soil Science Society of America Journal, 70(2): 393-407. https://doi.org/10.2136/sssaj2003.0285
[27] Apan, A., Kelly, R., Jensen, T., Butler, D., Strong, W., Basnet, B. (2002). Spectral discrimination and separability analysis of agricultural crops and soil attributes using ASTER imagery. Proc 11th Australas Remote Sens Photogramm Conf (ARSPC), Brisbane/Australia, 2: 396-411.
[28] Mohammed, O.A., Sayl, K.N. (2021). A GIS-based multicriteria decision for groundwater potential zone in the west desert of Iraq. In IOP Conference Series: Earth and Environmental Science, 856(1): 012049. https://doi.org/10.1088/1755-1315/856/1/012049
[29] Chabrillat, S., Goetz, A.F., Krosley, L., Olsen, H.W. (2002). Use of hyperspectral images in the identification and mapping of expansive clay soils and the role of spatial resolution. Remote sensing of Environment, 82(2-3): 431-445. https://doi.org/10.1016/S0034-4257(02)00060-3
[30] Breunig, F.M., Galvão, L.S., Formaggio, A.R. (2008). Detection of sandy soil surfaces using ASTER‐derived reflectance, emissivity and elevation data: potential for the identification of land degradation. International Journal of Remote Sensing, 29(6): 1833-1840. https://doi.org/10.1080/01431160701851791
[31] Clark, R.N., Roush, T.L. (1984). Reflectance spectroscopy: Quantitative analysis techniques for remote sensing applications. Journal of Geophysical Research: Solid Earth, 89(B7): 6329-6340. https://doi.org/10.1029/JB089iB07p06329
[32] Sayl, K.N., Sulaiman, S.O., Kamel, A.H., Muhammad, N.S., Abdullah, J., Al-Ansari, N. (2021). Minimizing the impacts of desertification in an arid region: A case study of the west desert of Iraq. Advances in Civil Engineering, 2021: 5580286. https://doi.org/10.1155/2021/5580286
[33] Khudair, M.Y., Kamel, A.H., Sulaiman, S.O., Al-Ansari, N. (2022). Groundwater quality and sustainability evaluation for irrigation purposes: A case study in an arid region, Iraq. International Journal of Sustainable Development and Planning, 17(2): 413-419. https://doi.org/10.18280/ijsdp.170206
[34] Al-Shujairi, S.O.H., Sulaiman, S.O., Najemalden, M.A. (2015). Variations of major ionic composition and salinity of Tigris River within Iraq. Sulaimani Journal for Engineering Sciences, 1(2): 64-70. http://dx.doi.org/10.17656/sjes.100025
[35] Sameer, Y.M., Abed, A.N., Sayl, K.N. (2021). Highway route selection using GIS and analytical hierarchy process case study Ramadi Heet rural highway. In Journal of Physics: Conference Series, 1973(1): 012060. http://dx.doi.org/10.1088/1742-6596/1973/1/012060
[36] Adham, A., Sayl, K.N., Abed, R., Abdeladhim, M.A., Wesseling, J.G., Riksen, M., Fleskens, L., Karim, U., Ritsema, C.J. (2018). A GIS-based approach for identifying potential sites for harvesting rainwater in the Western Desert of Iraq. International Soil and Water Conservation Research, 6(4): 297-304. https://doi.org/10.1016/j.iswcr.2018.07.003
[37] Sayl, K.N., Muhammad, N.S., El-Shafie, A. (2017). Optimization of area–volume–elevation curve using GIS–SRTM method for rainwater harvesting in arid areas. Environmental Earth Sciences, 76(10): 1-10. https://doi.org/10.1007/s12665-017-6699-1
[38] Mustafa, A., Sulaiman, S.O., Shahooth, S. (2017). Application of QUAL2K for water quality modeling and management in the lower reach of the Diyala river. Iraqi J. Civ. Eng, 11: 66-80. http://dx.doi.org/10.37650/ijce.2017.134910
[39] Sulaiman, S.O., Najm, A.B.A., Kamel, A.H., Al-Ansari, N. (2021). Evaluate the optimal future demand of water consumption in Al-Anbar province in the West of Iraq. International Journal of Sustainable Development and Planning, 16(3): 457-462. http://dx.doi.org/10.18280/ijsdp.160306
[40] Khudhair, M.A., Sayl, K.N., Darama, Y. (2020). Locating site selection for rainwater harvesting structure using remote sensing and GIS. In IOP Conference Series: Materials Science and Engineering, 881(1): 012170. http://dx.doi.org/10.1088/1757-899X/881/1/012170
[41] Assaf, A.T., Sayl, K.N., Adham, A. (2021). Surface Water Detection Method for Water Resources Management. In Journal of Physics: Conference Series, 1973(1): 012149. http://dx.doi.org/10.1088/1742-6596/1973/1/012149
[42] Mhmood, H.H., Yilmaz, M., Sulaiman, S.O. (2022). Simulation of the flood wave caused by hypothetical failure of the Haditha Dam. Journal of Applied Water Engineering and Research, 1-11. https://doi.org/10.1080/23249676.2022.2050312
[43] Buday, T., Hak, J. (1980). Report on the Geological Survey of the Western Part of the Western Desert, Iraq.
[44] Sayl, K.N., Afan, H.A., Muhammad, N.S., ElShafie, A. (2017). Development of a spatial hydrologic soil map using spectral reflectance band recognition and a multiple-output artificial neural network model. Hydrology and Earth System Sciences Discussions, 1-16. https://doi.org/10.5194/hess-2017-13
[45] Hashim, H.Q., Sayl, K.N. (2021). Detection of suitable sites for rainwater harvesting planning in an arid region using geographic information system. Applied Geomatics, 13(2): 235-248. https://doi.org/10.1007/s12518-020-00342-3
[46] Sulaiman, S.O., Al-Ansari, N., Shahadha, A., Ismaeel, R., Mohammad, S. (2021). Evaluation of sediment transport empirical equations: case study of the Euphrates River West Iraq. Arabian Journal of Geosciences, 14(10): 1-11. https://doi.org/10.1007/s12517-021-07177-1
[47] Sayl, K.N., Muhammad, N.S., El-Shafie, A. (2017). Robust approach for optimal positioning and ranking potential rainwater harvesting structure (RWH): A case study of Iraq. Arabian Journal of Geosciences, 10(18): 1-12. https://doi.org/10.1007/s12517-017-3193-8
[48] Bartholomeus, H.M., Schaepman, M.E., Kooistra, L., Stevens, A., Hoogmoed, W.B., Spaargaren, O.S.P. (2008). Spectral reflectance based indices for soil organic carbon quantification. Geoderma, 145(1-2): 28-36. https://doi.org/10.1016/j.geoderma.2008.01.010
[49] Sulaiman, S.O., Abdullah, H.H., Al-Ansari, N., Laue, J., Yaseen, Z.M. (2021). Simulation model for optimal operation of Dokan Dam reservoir northern of Iraq. International Journal of Design & Nature and Ecodynamics, 16(3): 301-306. https://doi.org/10.18280/ijdne.160308