Ali Jalali* | Phillip B. Roös | Murray Herron | Paras Sidiqui | Beau Beza | Emma Duncan
© 2022 IIETA. This article is published by IIETA and is licensed under the CC BY 4.0 license (http://creativecommons.org/licenses/by/4.0/).
OPEN ACCESS
Globally there has been an increasing trend in urban growth with cities expanding rapidly, indicating a requirement for more sustainable development of cities to minimize human impacts on the environment. In Australia, urban development continues to target areas adjacent to the coastal capital and regional cities such as the Greater Geelong region in Victoria, experiencing the fastest rates of growth in the country in the last decade. This project demonstrates the ability of modelling techniques to model current and future directions in urban development across two adjacent coastal towns, Anglesea and Torquay, in Victoria. The analysis utilized Geographic Information Systems (GIS) and the CommunityViz decision support tool using a variety of assets, environmental and climatic data. The models indicated an increase in greenhouse gas emissions, energy usage and population growth, and the area was found to be highly vulnerable to the impacts of environmental changes including the potential loss of biodiversity, soil erosion, and sea level rise. The modelling approach described here can aid planners and decision makers in the future coastal urban development as well as to mitigate climate change impacts.
climate change, coastal planning, sustainable development, spatial analysis, environmental impacts
Over the past few decades, coastal cities around the world have grown at an incredible rate, which has been associated with major challenges relating to land use planning, biodiversity and the degradation of the ecological footprint [1-3]. In addition, coastal cities have long been susceptible to processes of change, induced by climate and land use changes, and different cities have taken different approaches to mitigate such challenges [4-7]. In this respect, developing urban resilience action for protecting native flora and reforestation in Melbourne [8], developing landuse transport models in European cities [9], creating adaptation strategies to mitigate flooding and storm surge in New York [10], and improving urban structures as well as using renewable energies to reduce urban heat island in Sydney [11] have been among the coping approaches taken into account by such large coastal cities to increase their resilience to climate and land use changes. It has further been mentioned that the weight of economic activity in coastal cities has shifted from production to finance and highly specialized services since the 1980s [4, 12, 13]. The 20th century, however, shows drivers for coastal city regeneration due to the reduction in many industrial activities and a subsequent need to adapt to the changing use of an area, a need to utilize derelict buildings as high-quality residential zones [7, 14, 15].
The use of multidimensional and multilevel approaches such as sustainability development and assessment tools [16-18] has been of a great attention in recent times for sustainable development of cities to better address environmental, social and economic issues as well as to create a future-oriented way of living that balances human activity and wildlife processes over long term time frames [19, 20]. This is of importance given that disturbances such as extreme weather are becoming more frequent, indicating the importance of sustainability as living within the limits of what the environment can provide, the equal distribution of resources and opportunities [21-24]. Today’s land systems are however complex natural, social-ecological systems consisting of several factors such as water, cropland, forest and urban systems, each having subsystems of lower levels, with multiple interactions occurring between ecosystem services [25]. Hence, land systems are widely deemed as typical complex systems given that they have most of the key sources of complexity such as heterogenous components and dynamic interactions which may also be associated with negative impacts, such as biodiversity loss, in cases where urban development is not appropriate [26, 27]. Previous investigations have looked at the effect urban patterns have had on the concept of sustainability and sustainable environmental development [28-34]. Environmental planners may develop scenarios with the purpose of combining a large number of variables, such as climatic and environmental criteria, into smaller sets of alternatives where each can result in a major different outcome [35], and the use of scenarios in land use planning is well documented [36-42].
The question facing today’s town planner is how to better understand the complexities and variables that comprise the land use planning discipline. In this regard, modelling techniques provide a method to better understand the complexities and variables to gain a greater insight into how the various factors are interrelated. Many forms of land use planning models have recently been developed including Geographic Information Systems (GIS)-based models and environmental planning models [43-47]. Environmental and land-use models can represent a range of topics, and the development of GIS has added to the development of these models and opened new horizons for the management and manipulation of spatial data sets [43, 48, 49].
GIS-based planning approaches such as map overlay analysis has widely been investigated in environmental planning contexts [43, 50, 51]. Previous research indicated the advantages of GIS in urban development such as transportation analysis, waste management, biodiversity conservation, regional planning, and emergency management [52], however, such GIS-based applications may still be limited in terms of analysis tools. Hence, by applying more developed GIS-based extension tools, such as CommunityViz tool, with additional analysis features, users will be able to create multiple scenarios using custom formulas and indicators which can further be updated dynamically in real time, for example, when changes are needed to be made on the map [53]. This will also enable users to assess the impacts of urban development in terms of energy use, greenhouse gas emission, and other ecological, economic, and social aspects as well as to display the results in a variety of visual forms such as colour changing maps and dynamically changing charts. Moreover, GIS-based visualization and mapping has been given a particular attention to communicate information clearly and effectively through graphical means [54-57]. The role of landscape modelling and visualisation and its impact on land use planning has been studied in various parts of the world, with cities utilizing GIS and its urban design capabilities for determining the capability to accommodate additional growth by taking into account environmental impacts [58-61].
In addition, global warming is a serious contemporary issue, and land surface temperature has raised since the early 19th century in Australia with further increases being projected by 2100 [62], which has already been associated with environmental impacts especially in coastal areas. Given the impact of climate change on coastal urban areas through processes such as flooding and sea level rise, the application of advanced modelling techniques is now the centrepiece of environmental planning. Moreover, coastal regions in Australia such as regional towns in the state of Victoria have experienced significant growth from the 1980s onward associated with environmental issues relating to this growth, specifically urban sprawl and increased degradation of the environment.
Therefore, the aim of this study was to develop GIS-based coastal planning models using a variety of assets, environmental and climatic data across two coastal cities in Australia, and to identify opportunities, issues and risks for informing the design and decision making as well as assessing future environmental impacts due to physical environmental changes of the coastline across these fast-growing urban coastal landscapes.
2.1 Study area
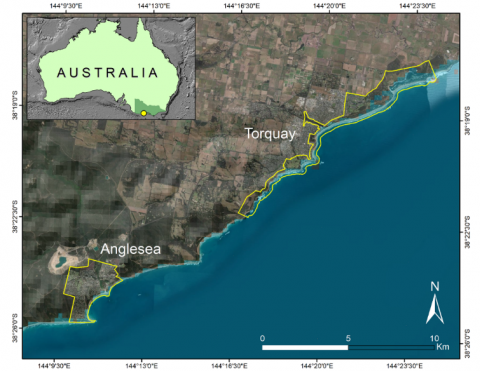
Anglesea and Torquay are two adjacent coastal cities located in southwest Victoria, Australia (Figure 1). The opening of the Great Ocean Road in the 1920s provided easier access to communities in these areas by enabling these towns to become tourist centres with significant urban growth. This area has also been of interest to young families and retirees, with urban development is being expected to increase significantly through time.
Figure 1. Map of the study areas showing the location of Anglesea and Torquay in the state of Victoria, Australia (yellow dot on the top map), zoomed on satellite image overlaid over the hill shade of land further illustrating the boundaries of the study areas
2.2 Data and models
A coastal planning model was developed encompassing Great Ocean Road Coast Committee (GORCC) management area in Torquay (Figure 1). In doing so, a GIS-based geodatabase was created for Torquay area, and two models were developed. A scenario that includes both current conditions, assets, and vegetation; and the proposed opportunities impacted by the six main categories of bushfire risk, soil erosion, coastal erosion (shoreline retreat), flood risk, sea-level rise, and storm surge over the time scales from 2019 to 2040, 2019 to 2070, and 2019 to 2100.
The environmental deterministic methodological approach was used to study how the physical environment accommodates human activities to particular development scenarios [63], as well as how changes in the physical environment will have an impact on human activities. Using a combination of GIS and CommunityViz tool as a planning and simulation software package, the potential environmental impacts, such as flooding and erosion, that may affect the existing and proposed infrastructure of the built and natural environment was assessed. CommunityViz was utilised to define indicators that can inform potential measurable decisions about the changes and impacts. This model was developed to represent the currently existing conditions (2019), and future conditions for 2040, 2070, and 2100. Having identified the indicators, the impact model was examined to illustrate the high-risk areas and assets at risk. Indicators were categorized into site specific and most relevant, and where needed new custom indicators were developed. Various other standard indicators of the CommunityViz 360 scenario tool were considered and used for analysis purposes of the broader study area but deemed not applicable for the management area, and thus, the list of the site-specific custom indicators is provided in Table 1.
Table 1. Coastal scenario planning model indicators developed for the Torquay area
|
Indicator |
Attributes |
Description |
|
Vegetation and Trees |
Vegetation and tree areas |
% of vegetation and tree areas of the GORCC Management Area |
|
Bushfire |
Bushfire prone area |
Total bushfire prone area and % of the GORCC Management Area |
|
Access to Amenities |
Pedestrian and subsidiary paths– number |
Number of pedestrian and subsidiary paths to the amenities (public toilets, BBQ, picnic facilities, etc.) |
|
Soil Erosion |
Area of soil erosion (moderate erosion) |
Area (m²) of soil erosion of the GORCC Management Area |
|
Soil Erosion Percent |
Per cent impacted by soil erosion (moderate erosion) |
% of soil erosion of the GORCC Management Area |
|
Coastal Erosion (Shoreline Retreat) |
Area of coastal erosion (Shoreline retreat) |
Area (m2) of coastal erosion of the GORCC Management Area |
|
Sea Level Rise - Inundation |
Area inundated due to sea-level rise |
Area (m²) inundation of overlap of the sea level rise layer of the GORCC Management Area |
|
Sea Level Rise – Inundation Percent |
Per cent inundated due to sea-level rise |
% inundation of overlap of the sea level rise layer of the GORCC Management Area |
|
Sea Level Rise – Storm Surge |
Area inundated due to sea-level rise and storm surge |
Area (m²) storm surge of overlap of the sea level rise layer of the GORCC Management Area |
|
Sea Level Rise – Storm Surge Percent |
Per cent inundated due to sea-level rise and storm surge |
% storm surge of overlap of the sea level rise layer of the GORCC Management Area |
|
Flood Prone Area |
Flood prone area subject to flooding |
Area (m²) subject to flooding of the GORCC Management area |
|
Flood Prone Percent |
Per cent of flood prone area |
% of the area subject to flooding of the GORCC Management Area |
|
Cultural Heritage |
Area of sensitive cultural heritage sites |
Area (m²) of sensitive cultural heritage sites per total area of the GORCC Management Area |
|
Car Parking |
Parking |
Area (m²) of car parking areas per total area of the GORCC Management Area |
|
Public Transport Accessibility |
Bus stops |
Number of bus stops within 500m of the points of interest (Toilets, BBQ and other buildings) within the GORCC Management Area |
|
Walking Track Length |
Walking track |
Total length of walking tracks along the coastline within the GORCC Management Area |
|
Beach Access |
Access path |
Number of access paths to the beach within the GORCC Management Area |
In addition, three GIS-based models have been developed for the Anglesea area: A low scenario equating to ninety percent of the Victorian government predicted population and housing growth forecast to 2050. A base scenario which is the actual Victorian government forecast. A high scenario which is one hundred and ten percent of the Victorian government population and housing forecast to 2050. The use of indicators is crucial in planning because they represent a measure of comparable success of each scenario that is developed, and the primary goal of scenario planning is to correctly rank scenarios by each indicator score as illustrated in a conceptual model in Figure 2.
Figure 2. Conceptual framework of scenario planning in the decision-making process
The method applied for the Anglesea area consisted of four procedures of buildout wizard, suitability wizard, allocate wizard and common/custom impact wizard within ArcGIS CommunityViz 360 tool, to develop economic, demographic and planning scenarios. The tool performs four functions including (i) the estimation, amount and location of new development allowed in an area according to current or proposed zoning regulations, (ii) the suitability of the new development to an area, (iii) the allocation of where growth is most likely to occur over a specific period, (iv) and finally the development of a series of environmental indicators showing the impact of the new development on the landscape environment. The buildout analysis and the suitability analysis were performed on the respective buildout results for the city of Anglesea with criteria used in the suitability analysis including proximity to the city centre, sewer access, proximity to hazardous areas and shoreline access.
The next analysis was the allocate procedure which takes the results from the buildout and sustainable analysis and allocates the demand for buildings across the available supply of potential building locations. Through the impact function in CommunityViz, several indicators were developed showing the impact of development over time on the urban landscape. Distance functions from new developments (i.e. to amenities, parks, schools) were considered to develop the indicators. Environmental impacts from new development such as CO2 emissions, floodplain percentage, residential water and energy usage, wastewater generation were also considered. Land use characteristics such as agricultural, commercial, industrial, open spaces, type of residential density were also used as the model indicators. Moreover, transportation and recreation characteristics such as jobs, new transport, street density, bicycle coverage, park and recreation percentage and housing near schools were also among the indicators applied in the models. Furthermore, a wide range of tabular and geospatial data was also used including current and historic census information, current and historic building information, projected demographic forecast, projected housing forecasts, cadastre, coastlines, roads, land use, digital-physical impediments (i.e. sinkholes, flood plains), current zoning, local government data and strategies and vegetation, soils and habitat databases.
3.1 Torquay area
Using the coastal planning models, the impacts by the six main categories of bushfire risk, soil erosion, coastal erosion (shoreline retreat), flood risk, sea-level rise, and storm surge were assessed over the time scales from 2019 to 2100, and the number of current and proposed assets impacted by these categories are represented in Table 2.
Table 2. Current number of assets at risk within the Torquay’s GORCC management area to scenarios of 2019, 2040, 2070 and 2100
|
Risk Exposure |
Current Assets |
|||
|
|
Year 2019 |
Year 2040 |
Year 2070 |
Year 2100 |
|
Bushfire |
202 |
202 |
202 |
202 |
|
Soil Erosion |
592 |
592 |
592 |
592 |
|
Coastal Erosion (shoreline retreat) |
- |
5 |
19 |
41 |
|
Flood Prone |
30 |
30 |
30 |
30 |
|
Sea Level Rise |
- |
16 |
19 |
25 |
|
Storm Surge |
- |
37 |
47 |
63 |
The majority of the study area in Torquay within the GORCC management area is prone to bushfire risk. Bushfire risk is the same for all assets over the timeline up to the year 2100, the only difference is that the likelihood of and more frequent events of bushfire will potentially increase over time. The approximate total area susceptible to bushfire risk is estimated around 1,926,614 sqm, and it covers a total percentage area of 68% of the management area. Bushfire risk is one of the key considerations in the planning and management in Australia. The Victoria State Government’s regional climate projections indicate that bushfire risk will increase due to an expectation of more hot days, more intense droughts, and more prolonged heat waves [64]. Southern parts of Victoria across surf coast regions are therefore considered to be exposed to a very high risk of bushfire as previous hot and windy conditions led to bushfire event in the Otway Ranges National Park in the proximity of Torquay area. This fire event continued for several weeks destructing the steep and heavily vegetated terrain across the region with substantial socioeconomic impacts on local communities with the total estimated damage cost of \$60-70 million as a result of this disaster [65-67]. In another incidence, on the 2009 ‘Black Saturday’ bushfire, proclaimed as the worst fire danger day in Victoria, 173 civilians lost their lives and costs were estimated at over \$3.5 billion [68, 69]. These events indicate the high vulnerability of terrestrial ecosystems in this area, emphasizing the importance of clever land use planning and urban design in reducing the risks of natural disasters especially bushfire.
Vegetation and tree percent cover per Torquay’s GORCC management area is a total of 48.9%, made up of 37.3% of trees and shrubs, and 11.6% of other vegetation such as grasses and ground covers. The total area in square metres of vegetation cover is approximately 868,200 sqm. Vegetation and trees are impacted by the six main categories of risk exposure in various degrees. Recognising that nearly 50% of the total management area is covered by trees and vegetation, any risk exposure to the area will ultimately have an impact on the trees and vegetation.
Much of the coastline and the headlands in the study area are associated with rock platforms and comprised of a high dune ridge consisting of aeolian sands. It must be noted that a large area is acceptable to soil erosion (moderate), and 246 buildings are located within the moderate soil erosion areas. These assets are therefore receptive to impacts of soil erosion, due to soil decomposition, overland flooding and erosion. Soil erosion risk is the same for all assets over the timeline up to the year 2100. The only difference is that the likelihood of and more intensity of soil erosion can potentially increase over time. The percentage of the management area exposure to moderate erosion is around 55%. A total area of 1,496,296 sqm is at risk of moderate soil erosion. Some areas such as Point Danger, Torquay Front Beach and Point Impossible are more susceptible to soil erosion due to the high dune ridge consisting of aeolian sands stretching along this area (Figure 3). The creek areas are also vulnerable, and these include Spring Creek, Deep Creek and Thompsons Creek. However, it must be noted that the rate of erosion and predicted increase of erosion risk was not calculated due to the complexity of this topic, being outside the scope of this project. For the purposes of the scenario modelling, only the spatial context was calculated to identify areas and assets at risk. The entire area is highly receptive to coastal erosion (shoreline retreat), further increased by environmental changes such as sea-level rise and storm surges (Figure 3). The indicator developed for coastal erosion was the land surface area (sqm) of the GORCC management area lost/change due to shoreline retreat. The methodology followed for coastal erosion was based on the Aqua Monitor method [70, 71], providing plausible results for a first pass assessment for coastal shoreline retreat. The estimated loss of land area due to coastal erosion (shoreline retreat) are 127,478 sqm by 2040,267,655 sqm by 2070 and 401,203 sqm by 2100. The estimated assets impacted by coastal erosion are 5 assets by 2040, 19 assets by 2070, and 41 assets by 2100.
Figure 3. Map of coastal soil erosion modelled for the year 2100 across Torquay’s GORCC (Great Ocean Road Coast Committee) management area
The majority of the northeast of the study area in Torquay will be affected by sea-level rise. The results show that no buildings will be affected by sea-level rise, however, assets impacted will include emergency markers, sealed walkways, stairs, beach access trails, boardwalks, beach areas, coastal walking paths and vehicle access paths. The percentage of the GORCC management area impacted, increased from 2040 to 2100 (Figure 4). On its own, sea-level rise impacts only a small area, excluding storm surge and flooding. However, sea-level rise impacts all the beaches of the coastline, and all will be inundated. Two other areas highly susceptible to inundation include the low-lying areas and wetlands as part of Thompson’s Creek and the low-lying areas of Spring Creek and its Estuary (Figure 5). Sea-level rise is a global environmental challenge as sea level monitoring at a global scale indicated around 1.7 millimetres annual rise since the early 1900s, though the rate has not been steady and this has climbed to 3.1 millimetres a year since 1993 which has largely been attributed to recent increases in ocean warming, expansion and the melting of land-based ice [72]. Australian sea levels are projected to rise through the 21st century parallel to global mean sea level as our case study model indicated. Regional trends in sea level changes around Australia is also observed due to factors including winds and ocean currents. In an example, since 1991, rise of 2.8 and 2.4 mm per year have been respectively recorded at monitoring stations at Lorne and Stony Point in southwest Victoria, in the proximity of our study locations, which is predicted to continue accelerating slightly every year. Based on the IPCC RCP 8.5 scenario, sea level projections for the coastline of Australia by 2090 are comparable or slightly greater than the global mean sea level projections, although the levels could reach tenths of meter higher under the likely collapse of Antarctic ice sheet by the late 21st century [62].
Figure 4. Percentage (%) of the area impacted by sea level rise from 2040 to 2100
Figure 5. Map of sea level rise modelled for the period 2019-2100, across Torquay’s GORCC (Great Ocean Road Coast Committee) management area
To better understand changes in storm surge over the years, storm tide calculations were used in the scenario modelling for the years 2019 to 2100. ‘Storm surge’ is the abnormal rise in seawater level during a storm, measured as the height of the water above the normal predicted astronomical tide, whereas ‘Storm tide’ is the total observed seawater level during a storm, resulting from the combination of storm surge and the astronomical tide [73, 74]. Similar to sea-level rise, the northeast side of the study area is highly prone to storm surges (Figure 6). The area around Spring Creek is also highly acceptable to storm surge. Storm tide will also affect the Torquay Foreshore Caravan Park and the RACV Torquay Golf Club. All of the coastline will be affected by the storm tide. Assets at risk of storm surge include emergency markers, sealed walkways, stairs, beach access, boardwalks, beaches, secondary pathways, and vehicle access.
Figure 6. Map of storm surge modelled for the period 2019-2100, across Torquay’s GORCC (Great Ocean Road Coast Committee) management area
There was an increase in the percentage of the GORCC management area impacted by storm surge from 2040 to 2100 (Figure 7). Adding the effects of storm surge to sea level rise, many assets and amenities in the study area are at risk, even as early as 2040. Highly vulnerable areas include the low-lying areas and wetlands as part of Thompsons Creek, including access roads and paths at Point Impossible, and the low-lying areas of Spring Creek and its Estuary that includes roads, access paths, boardwalks, and amenities at the Torquay Common, Torquay Life Saving Club, and Torquay Foreshore Caravan Park area. The Torquay Front Beach is also highly vulnerable, with water levels predicted to inundate the beach right up to, and in some areas spilling over the existing stone retaining wall.
Figure 7. Percentage (%) of the area impacted by storm surge from 2040 to 2100
The flood assessment projected that approximately 3.67% of the GORCC management area is at risk of flooding. A total of 30 assets are located in a flood prone area. The area highest at risk to flooding is close to Spring Creek and the estuary, and that flooding in this area will impact various assets including a bench, bin, carpark, boardwalk, beach area, grassed areas and vegetation. The flood prone areas mostly include the low-lying areas and wetlands as part of Thompsons Creek, resulting in access roads and walking paths at Point Impossible at risk of flooding (Figure 8). The low-lying areas surrounding Spring Creek and its Estuary results in a risk of flooding including assets such as roads, access paths, and the open grassed areas at Torquay Common.
Figure 8. Map of flood prone areas across Torquay’s GORCC (Great Ocean Road Coast Committee) management area
Flooding is the most frequent global disaster, and it has been estimated that it contributes to approximately one-third of all natural disasters impacting economies, societies and human life [75, 76]. In Australia, flooding is the costliest natural disaster, estimated to be over $300 million losses annually [77]. This issue can expose the land to both short and long term changes with implications for infrastructure and biodiversity [78]. In addition, in Australian coastal cities, it has been estimated that about 35% of residential places across the coastal zones are at risk of inundation based on plausible sea level rise projected by the end of this century [79]. As our models indicated, this is of concern given that urban development continues to target such areas. Thus, urban flooding mitigation and adaptation strategies need to be developed to reduce and avoid exposing infrastructure and people to risks. By identifying the areas and assets at risk, through the modelling approaches applied here, local authorities could be informed for implementing any changes on these assets, for instance by relocation to a safer area or by developing physical protection measures. This could further be achieved by improving emergency equipment for urgent actions in more vulnerable areas as well as by increasing awareness among local communities about the risks associated with such disasters.
In terms of cultural heritage sites, the entire study area in Torquay is enveloped by cultural heritage sensitivity. According to a previous report, a total number of 27 cultural heritage sites were registered within the area [80]. However, the whole area within the GORCC management area is seen as a highly sensitive cultural heritage area, and any proposal relating to development or change in land uses in this area needs formative consultation with the Wadawurrung (Wathaurung Aboriginal Corporation) and the Wadawurrung community, as to identify and consider any impacts that may result thereof.
The total area of car parks in the GORCC management area is approximately 6,453 sqm. Even though the figure seems insignificant in relation to the overall management area, car parks facilitate both a high risk of negative impacts to the environment, as well as providing easy human access to amenities within the coastal area. An escalation in population and visitors to the area correspondingly increases the use of the beach and amenities, and thereupon increases damage to soils from compaction, and grassed areas and native vegetation from use and damage occur. Increases in visitation and population growth have a direct relationship to available car park spaces, and a suitable mitigation measure needs to be implemented to manage unnecessary damage to the environment arising from this relationship pattern.
The public transport accessibility indicator provides information on the total amount of amenities within a walking distance of 500m to a bus stop, which includes 6 showers, 10 toilets, and 2 barbeques. The importance of this indicator is twofold. In the first instance the indicator provides clarity on accessibility by the public to the amenities, without the need of using a car; secondly provides information on the potential of increased use of the amenities due to increased visitation and easy accessibility to the facilities within the management area. In addition, one of the main recreational uses in the management area is the surf coast walk, and other secondary walking tracks that link to the beach and points of interest. The approximate total length of walking trails/tracks is 18.2 km, comprising 7 sealed coastal walking paths, and 17 unsealed coastal walking paths. This indicator provides clarity on accessibility to the entire management area, and it indicates the potential of increased use and easy accessibility to the study area. Due to the topography and vegetation characteristics, various access paths to the beach are needed to provide easy access to the beach and also to facilitate controlled access. Currently, beach access paths are calculated to a total length of 2.5 km, and the count of access stairs to the beach is 32, with the area of access stairs calculated at approximate 586.3 sqm. This indicator provides information on the accessibility to the beach, as well as quantitative information that is valuable for identifying the availability of access.
Considering the recreational requirements and uses of the beach area, the available access to amenities such as toilets, barbeque areas, parks and grassed areas, playgrounds, benches and viewpoints, needs to be considered. These indicators look at the informal tracks and subsidiary paths only, as the indicators walking track length and beach access paths both has a direct relationship to access to amenities. All these indicators thus need to be considered when assessments are done in relation to the requirements for access to amenities.
High-risk areas for the purpose of this study are defined as the areas within the Torquay’s GORCC management area that will be impacted by physical changes to the environment due to the main categories of risk exposure and impacts including bushfire prone, coastal soil erosion, flood prone, sea level rise inundation, and storm surge. However, other impacts to the landscape, such as human intensity and uses, increased numbers in visitors and population, and built infrastructure changes are also considered. Because this study was based on the environmental deterministic method [63], the deliberations of all layers of land use and attributes of the area are considered. For example, increased visitor use of beaches and amenities within this area will have a major impact upon this natural environment and the available infrastructure in the nearby future. It is not possible to spatially represent this in the scenario model, but the calculation of the future day and overnight stay visitors’ numbers of 1,203,815 by 2036 specific to the GORCC management area, clearly raises a matter of concern of the existing landscape’s carrying capacity to sustain this future use intensity, as indicated in Table 3. Thus, when deliberating land uses for the area, the human impacts of these high visitation statistics on the area’s natural environments needs to be considered. Indicated in Table 4, the following high-risk areas were identified in the categories of risk exposure and impacts including bushfire prone, coastal soil erosion, flood prone, sea level rise inundation, and storm surge.
Table 3. Predicted increased visitors to the GORCC management area in Torquay
|
Visitors classification |
Total |
Activity (go to beach %) |
Potential visitors |
52% visits to Torquay |
Potential visitors 2036 |
|
Domestic Day Visitors |
1,601,000 |
43 |
682,026 |
354,653 |
627,736 |
|
Domestic Overnight Visitors |
1,100,000 |
57 |
625,900 |
325,468 |
576,078 |
|
Total |
2,701,000 |
100 |
1,307,926 |
680,121 |
1,203,814 |
Table 4. High-risk areas to risk exposure across the GORCC management area in Torquay
|
Risk Exposure |
Torquay’s GORCC management areas at high risk |
|
Bushfire |
Precinct 1, Precinct 2, Precinct 3 up to Deep Creek, Taylor Park, and Precinct 6 including Jan Juc coastal area |
|
Soil erosion |
Most of the area is susceptible to moderate soil erosion |
|
Coastal erosion (shoreline retreat) |
The entire coastline of the GORCC management area is susceptible to coastal erosion (shoreline retreat), with more vulnerable areas from Point Danger to Thompsons Creek |
|
Flood prone |
Precinct 1, and Precinct 5 including areas around Thompsons Creek and Spring Creek |
|
Sea level rise |
Beaches along the entire coastline area, with highly vulnerable areas of Precinct 1, and Precinct 5 |
|
Storm surge |
The entire coastline of the GORCC management area, with highly vulnerable areas of Precinct 1, and Precinct 5 |
3.2 Anglesea area
Map of new developments (new houses) within Anglesea area from 2016- 2050 are illustrated in Figure 9. In addition, existing developments (houses and commercial structures), flooding patterns for normal flooding and storm surge flooding as well as the forest cover with trees are also shown. The map highlights the physical constraints including flooding and storm surge which restrict development in Anglesea. Given that Anglesea is in a bush fire zone, it will not be able to expand or exceed the scenarios contained in this research as also mentioned by the Victorian government controlling the development in bushfire areas.
Figure 9. Map of existing and proposed developments, flooding and forest cover in Anglesea
The growth in population and development to 2050 has some impacts on the landscape of Anglesea, representing information from the 2016 simulation and further indicative of the impacts likely to occur in Anglesea. For every five-year period, each low, base and high scenario with a corresponding indicator shows how it impacts the Anglesea environment and landscape and each five-year period records an increase. In terms of greenhouse gas emission, it was found that there will be an increase in carbon dioxide and nitrous oxide emissions especially under the high scenario modelling (Figure 10). In terms of energy usage, residential energy and water use will also increase. In addition, modelling scenarios indicated an increase in the number of dwellings, vehicle trips and labour force population from low to high scenarios (Figure 10). This indicates a requirement for smart city planning as ineffective urban design and governance may have many social, economic and ecological costs including urban warming, water and air pollution as well as health problems. For instance, the environmental impacts of rapid and unbalanced urban expansion in China revealed serious air and water pollution as well as environmental degradation with China being found the world’s largest greenhouse gas emitter which continues to contribute to an increased levels of CO2 emissions [81-83]. It has been estimated that China emitted 10.25 billion tones CO2 in 2013, about two time greater than the emission rate reported in the USA [84]. Cities are affecting greenhouse gasses especially in the context of global warming, and cities have been found as the major source of anthropogenic carbon emissions [85]. In another example, Mexico City as one of the largest capital cities in the world, has seen a rapid urban expansion and population growth which has been associated with environmental damages including the loss of forest areas mainly due to the lack of effective urban governance and land use policy [86, 87]. This further indicates a requirement for understanding key driving forces for mitigating these challenges.
The study area faces several challenges including the impacts of both normal flooding and storm surge flooding. Normal flooding can be defined an overflow of water onto normally dry land. The inundation of a normally dry area is caused by rising water in an existing waterway, such as a river, stream, or drainage ditch or ponding of water at or near the point where the rain fell. Flooding is a longer-term event than flash flooding which may last days or weeks. Storm surge as an abnormal rise of water generated by a storm over and above the predicted astronomical tide can also be a cause of serios damage to several structures in this area. It is the change in the water level that is due to the presence of the storm since storm surge is a difference between water levels, and storm surge does not have a reference level. In addition, Anglesea faces the problems of limited development area with great demand pressures for land. Anglesea is less than 30 kilometres from Victoria’s second-largest city of Geelong and has reliable transport to and from that city, and it will continue to face pressure as it develops into a bedroom community of Geelong. Geelong is expected to nearly double its population by 2050 thus putting more pressure on outlying areas like Anglesea.
Figure 10. Results of Base, Low and High scenario modellings showing changes in dwellings, CO2 auto emissions, labour force, NOx auto emissions, residential energy use, residential water use and vehicle trips per pay for Anglesea area
Overall, this study indicated that the study areas are vulnerable to the impacts of environmental change as well as the amplified pressures of human uses due to high current and projected increased numbers of visitation, population growth and development. These impacts and changes result in significant challenges in the management of the area due to the potential loss of biodiversity values, coastal erosion (shoreline retreat) and soil erosion impacts on vegetation and beaches, loss of cultural heritage areas, impacts to amenities and services, and the demand for improved access and other facilities and assets especially in Torquay area. Impacts of climate change such as increases in temperatures, wave energy activity and sea-level rises are likely to have ramifications for coastal habitats. Increased visitation is likely to increase disturbance through increased trampling. In addition, high-risk areas have also been identified, and climate change will continue to occur in these regional areas and will have major consequences upon GORCC’s extant and proposed assets and infrastructure irrespective of what mitigation measures are set in train.
The authors acknowledge the Great Ocean Road Coast Committee (GORCC), and the Live+Smart Research Laboratory, Deakin University for their support. The authors would like to acknowledge and pay our respects to the Traditional Owners of the lands and waters that we live and work on across Australia and pay our respect to Elders past and present. We recognise that Aboriginal and Torres Strait Islander peoples have made and will continue to make extraordinary contributions to all aspects of Australian life including culture, economy, and science.
[1] Seto, K.C., Güneralp, B., Hutyra, L. (2012). Global forecasts of urban expansion to 2030 and direct impacts on biodiversity and carbon pools. Proceedings of the National Academy of Sciences, 109(40): 16083-16088. http://dx.doi.org/10.1073/pnas.1211658109
[2] Aronson, M., Sorte, F.A.L., Nilon, C., Katti, M., Goddard, M.A., Lepczyk, C.A., Warren, P.S., Williams, N.S.G., Cilliers, S.S., Clarkson, B.D., Dobbs, C., Dolan, R.W., Hedblom, M., Klotz, S., Kooijmans, J.L., Kühn, I., MacGregor-Fors, I., McDonnell, M.J., Mörtberg, U., Pyšek, P., Siebert, S., Sushinsky, J., Werner, P., Winter, M. (2014). A global analysis of the impacts of urbanization on bird and plant diversity reveals key anthropogenic drivers. Proceedings of the Royal Society B: Biological Sciences, 281(1780): 20133330. http://dx.doi.org/10.1098/rspb.2013.3330
[3] Zhang, Y., Liu, Y.F., Zhang, Y., Liu, Y., Zhang, G.X., Chen, Y.Y. (2018). On the spatial relationship between ecosystem services and urbanization: A case study in Wuhan, China. Science of The Total Environment, 637-638: 780-790. https://doi.org/10.1016/j.scitotenv.2018.04.396
[4] Sassen, S. (2001). The Global City: New York, London, Toyko. Princeton, New Jersey, Princeton Press. p. 480. http://dx.doi.org/10.2307/2152688
[5] O’Connor, K. (2010). Global city regions and the location of logistics activity. Journal of Transport Geography, 18(3): 354-362. https://doi.org/10.1016/j.jtrangeo.2009.06.015
[6] Sassen, S. (2018). The Global City: Strategic Site, New Frontier, in Moving Cities – Contested Views on Urban Life, L. Ferro, et al., Editors. Springer Fachmedien Wiesbaden: Wiesbaden. pp. 11-28. http://dx.doi.org/10.2307/2152688
[7] Welle, T., Birkmann, J. (2016). Measuring the unmeasurable: comparative assessment of urban vulnerability for coastal megacities - New York, London, Tokyo, Kolkata and Lagos. Journal of Extreme Events, 03(03): 1650018. http://dx.doi.org/10.1142/S2345737616500184
[8] Fastenrath, S., Coenen, L., Davidson, K. (2019). Urban Resilience in Action: The Resilient Melbourne Strategy as Transformative Urban Innovation Policy? Sustainability, 11(3): 693. http://dx.doi.org/10.3390/su11030693
[9] Ford, A.C, Dawson, R.J., Blythe, P.T., Barr, S. (2018). Land-use transport models for climate change mitigation and adaptation planning. Journal of Transport and Land Use, 11(1): 83-101. http://dx.doi.org/10.5198/jtlu.2018.1209
[10] Solecki, W. (2012). Urban environmental challenges and climate change action in New York City. Environment and Urbanization, 24(2): 557-573. http://dx.doi.org/10.1177/0956247812456472
[11] Santamouris, M., Haddad, S., Saliari, M., Vasilakopoulou, K., Synnefa, A., Paolini, R., Ulpiani, G., Garshasbi, S., Fiorito, F. (2018). On the energy impact of urban heat island in Sydney: Climate and energy potential of mitigation technologies. Energy and Buildings, 166: 154-164. https://doi.org/10.1016/j.enbuild.2018.02.007
[12] Sassen, S. (2005). The global city: introducing a concept. Brown Journal of World Affairs, 11: 27-43.
[13] Chubarov, I., Brooker, D. (2013). Multiple pathways to global city formation: A functional approach and review of recent evidence in China. Cities, 35: 181-189. https://doi.org/10.1016/j.cities.2013.05.008
[14] Ham, M.V., Uesugi, M., Tammaru, T., Manley, D., Janssen, H. (2020). Changing occupational structures and residential segregation in New York, London and Tokyo. Nature Human Behaviour, 4(11): 1124-1134. https://www.nature.com/articles/s41562-020-0927-5
[15] González-Baheza, A., Arizpe-Coarrubias, O. (2018). Vulnerability assessment for supporting sustainable coastal city development: A case study of La Paz, Mexico. Climate and Development, 10(6): 552-565. http://dx.doi.org/10.1080/17565529.2017.1291406
[16] Gil, J., Duarte, J. (2013). Tools for evaluating the sustainability of urban design: a review. Proceedings of the Institution of Civil Engineers - Urban Design and Planning, 166(6): 311-325. http://dx.doi.org/10.1680/udap.11.00048
[17] Waas, T., Hugé, J., Block, T., Wright, T., Benitez-Capistros, F., Verbruggen, A. (2014). Sustainability assessment and indicators: tools in a decision-making strategy for sustainable development. Sustainability, 6(9): 5512-5534. http://dx.doi.org/10.3390/su6095512
[18] Sharifi, A., Murayama, A. (2013). A critical review of seven selected neighborhood sustainability assessment tools. Environmental Impact Assessment Review, 38: 73-87. https://doi.org/10.1016/j.eiar.2012.06.006
[19] Mcmichael, A.J., Butler, C.D., Folke, C. (2003). New visions for addressing sustainability. Science, 302: 1919-1920.
[20] Costanza, R., Patten, B.C. (1995). Defining and predicting sustainability. Ecological Economics, 15(3): 193-196. https://doi.org/10.1016/0921-8009(95)00048-8
[21] Alberti, M. (2005). The effects of urban patterns on ecosystem function. International Regional Science Review, 28(2): 168-192. http://dx.doi.org/10.1177/0160017605275160
[22] Byrd, K.B., Kreitler, J.R, Labiosa, W.B. (2011). Tools and methods for evaluating and refining alternative futures for coastal ecosystem management-the Puget sound ecosystem portfolio model. U.S. Geological Survey Open-File Report 2011-1279, p. 47. https://doi.org/10.3133/ofr20111279
[23] Curtis, C., Scheurer, J. (2010). Planning for sustainable accessibility: Developing tools to aid discussion and decision-making. Progress in Planning, 74(2): 53-106. https://doi.org/10.1016/j.progress.2010.05.001
[24] Farr, D. (2007). Sustainable Urbanism: Urban Design with Nature. p. 352.
[25] Wang, Y., Li, X.M., Li, J.F., Huang, Z.D., Xiao, R.B. (2018). Impact of rapid urbanization on vulnerability of land system from complex networks view: A methodological approach. Complexity, 2018: 8561675. http://dx.doi.org/10.1155/2018/8561675
[26] Dearing, J.A., Braimoh, A.K., Reenberg, A., Turner, B.L., Van der Leeuw, S. (2010). Complex Land Systems the Need for Long time perspectives to assess their future. Ecology and Society, 15(4): 1-19. http://dx.doi.org/10.5751/ES-03645-150421
[27] Lambert, M.R., Donihue, C.M. (2020). Urban biodiversity management using evolutionary tools. Nature Ecology & Evolution, 4(7): 903-910. http://dx.doi.org/10.1038/s41559-020-1193-7
[28] Rees, W., Wackernagel, M. (1996). Urban ecological footprints: Why cities cannot be sustainable—And why they are a key to sustainability. Environmental Impact Assessment Review, 16(4): 223-248. https://doi.org/10.1016/S0195-9255(96)00022-4
[29] Morse, S., McNamara, N., Acholo, M., Okwoli, B. (2001). Sustainability indicators: The problem of integration. Sustainable Development, 9(1): 1-15. https://doi.org/10.1002/sd.148
[30] Becker, J. (2004). Making sustainable development evaluations work. Sustainable Development, 12(4): 200-211. http://dx.doi.org/10.1002/sd.236
[31] Robinson, J., Carmichael, J., Vanwynsberghe, R., Tansey. J., Journeay, M., Rogers, L. (2006). Sustainability as a problem of design: Interactive science in the Georgia Basin. Integrated Assessment, 6.
[32] Wallis, A., Richards, A., O'Toole, K., Mitchell, B. (2007). Measuring regional sustainability: Lessons to be learned. International Journal of Environment and Sustainable Development, 6(2): 193-207. http://dx.doi.org/10.1504/IJESD.2007.014203
[33] Arciniegas, G., Janssen, R. (2012). Spatial decision support for collaborative land use planning workshops. Landscape and Urban Planning, 107(3): 332-342. https://doi.org/10.1016/j.landurbplan.2012.06.004
[34] Garschagen, M., Romero-Lankao, P. (2015). Exploring the relationships between urbanization trends and climate change vulnerability. Climatic Change, 133(1): 37-52. http://dx.doi.org/10.1007/s10584-013-0812-6
[35] Walker, D. (2011). The Planners Guide to CommunityViz. The Essential Tool for a New Generation of Planning. Published on April 1, 2011 by Routledge. p. 304. https://doi.org/10.4324/9781351179768
[36] Wollenberg, E., Edmunds, D., Buck, L. (2000). Using scenarios to make decisions about the future: anticipatory learning for the adaptive co-management of community forests. Landscape and Urban Planning, 47(1): 65-77. https://doi.org/10.1016/S0169-2046(99)00071-7
[37] Tress, B., Tress, G. (2003). Scenario visualisation for participatory landscape planning—a study from Denmark. Landscape and Urban Planning, 64(3): 161-178. https://doi.org/10.1016/S0169-2046(02)00219-0
[38] Dockerty, T., Lovett, A., Appleton, K., Bone, A., Sünnenberg, G. (2006). Developing scenarios and visualisations to illustrate potential policy and climatic influences on future agricultural landscapes. Agriculture, Ecosystems & Environment, 114(1): 103-120. https://doi.org/10.1016/j.agee.2005.11.008
[39] Verburg, P.H., Schulp, C.J.E., Witte, N., Veldkamp, A. (2006). Downscaling of land use change scenarios to assess the dynamics of European landscapes. Agriculture, Ecosystems & Environment, 114(1): 39-56. https://doi.org/10.1016/j.agee.2005.11.024
[40] Varum, C.A., Melo, C. (2010). Directions in scenario planning literature – A review of the past decades. Futures, 42(4): 355-369. https://doi.org/10.1016/j.futures.2009.11.021
[41] Schroth, O., Pond, E., Sheppard, S.R.J. (2015). Evaluating presentation formats of local climate change in community planning with regard to process and outcomes. Landscape and Urban Planning, 142: 147-158. https://doi.org/10.1016/j.landurbplan.2015.03.011
[42] Shaw, A., Sheppard, S., Burch, S., Flanders, D., Wiek, A., Carmichael, J., Robinson, J., Cohen, S. (2009). Making local futures tangible-Synthesizing, downscaling, and visualizing climate change scenarios for participatory capacity building. Global Environmental Change, 19: 447-463. https://doi.org/10.1016/j.gloenvcha.2009.04.002
[43] Herron, M., Roos, P., Donley, C., Jones, D.S. (2015). Geographic information systems and coastal planning in Australia. Geography, Environment, Sustainability, 8(1): 79-108. http://dx.doi.org/10.15356/2071-9388_01v08_2015_06
[44] Roös, P.B. (2021). Regenerative-Adaptive Design for Sustainable Development. Springer, Cham. p. 247. https://doi.org/10.1007/978-3-030-53234-5.
[45] Jafari, M., Majedi, H., Monavari, S.M., Alesheikh, A.A., Zarkesh, M.K. (2016). Dynamic simulation of urban expansion through a CA-Markov model case study: Hyrcanian region, Gilan, Iran. European Journal of Remote Sensing, 49(1): 513-529. http://dx.doi.org/10.5721/EuJRS20164927
[46] Guhathakurta, S. (2002). Urban modeling as storytelling: using simulation models as a narrative. Environment and Planning B: Planning and Design, 29(6): 895-911. http://dx.doi.org/10.1068/b12857
[47] Briassoulis, H. (2020). Analysis of land use change: Theoretical and modeling approaches. 2nd edn. Edited by Scott Loveridge and Randall Jackson. WVU Research Repository, 2020.
[48] McNeill, J., MacEwan, R. (2007). The Land Use Impact Model (LUIM). Department of Primary Industries, Primary Industries Research Victoria, Bendigo, p. 56.
[49] Masoudi, M., Centeri, C., Jakab, G., Nel, L., Mojtahedi, M. (2021). GIS-Based Multi-Criteria and Multi-Objective Evaluation for Sustainable Land-Use Planning (Case Study: Qaleh Ganj County, Iran) “Landuse Planning Using MCE and Mola”. International Journal of Environmental Research, 15(3): 457-474. http://dx.doi.org/10.1007/s41742-021-00326-0
[50] Brown, I. (2006). Modelling future landscape change on coastal floodplains using a rule-based GIS. Environmental Modelling & Software, 21(10): 1479-1490. https://doi.org/10.1016/j.envsoft.2005.07.011
[51] Agius, T., Sabri, S., Kalantari, M. (2018). Three-dimensional rule-based city modelling to support urban redevelopment process. ISPRS International Journal of Geo-Information, 7(10): 413. http://dx.doi.org/10.3390/ijgi7100413
[52] Banerjee, S., Chakraborty, C., Das, D. (2020). An approach towards GIS application in smart city urban planning. Internet of Things and Secure Smart Environments: Successes and Pitfalls (1st ed.). Chapman and Hall/CRC, 40. http://dx.doi.org/10.1201/9780367276706-2
[53] Boulange, C., Pettit, C., Gunn, L.D., Giles-Corti, B., Badland, H. (2018). Improving planning analysis and decision making: The development and application of a Walkability Planning Support System. Journal of Transport Geography, 69: 129-137. https://doi.org/10.1016/j.jtrangeo.2018.04.017
[54] Appleton, K., Lovett, A. (2003). GIS-based visualisation of rural landscapes: defining ‘sufficient’ realism for environmental decision-making. Landscape and Urban Planning, 65(3): 117-131. https://doi.org/10.1016/S0169-2046(02)00245-1
[55] Andrienko, G., Andrienko, P., Jankowski, P., Keim, D.A, Kraak, M.J., MacEachren, A., Wrobel, S. (2007). Geovisual analytics for spatial decision support: Setting the research agenda. International Journal of Geographical Information Science, 21(8): 839-857. http://dx.doi.org/10.1080/13658810701349011
[56] Salter, J.D., Campbell, C., Journeay, M., Sheppard, S.R.J. (2009). The digital workshop: Exploring the use of interactive and immersive visualisation tools in participatory planning. Journal of Environmental Management, 90(6): 2090-2101. https://doi.org/10.1016/j.jenvman.2007.08.023
[57] Bishop, I.D., Pettit, C.J., Sheth, F., Sharma, S. (2013). Evaluation of data visualisation options for land-use policy and decision making in response to climate change. Environment and Planning B: Planning and Design, 40(2): 213-233. http://dx.doi.org/10.1068/b38159
[58] Appleton, K., Lovett, A. (2005). GIS-based visualisation of development proposals: reactions from planning and related professionals. Computers, Environment and Urban Systems, 29(3): 321-339. https://doi.org/10.1016/j.compenvurbsys.2004.05.005
[59] Pettit, C.J., Raymond, C.M., Bryan, B.A., Lewis, H. (2011). Identifying strengths and weaknesses of landscape visualisation for effective communication of future alternatives. Landscape and Urban Planning, 100(3): 231-241. https://doi.org/10.1016/j.landurbplan.2011.01.001
[60] Berry, R., Higgs, G. (2012). Gauging levels of public acceptance of the use of visualisation tools in promoting public participation; a case study of wind farm planning in South Wales, UK. Journal of Environmental Planning and Management, 55(2): 229-251. http://dx.doi.org/10.1080/09640568.2011.591925
[61] Bishop, I.D. (2012). On-Line approaches to data delivery and visualisation in landscape planning and management. International Journal of E-Planning Research (IJEPR), 1(1): 31-41. http://dx.doi.org/10.4018/ijepr.2012010104
[62] IPCC. (2019). Climate Change and Land: An IPCC special report on climate change, desertification, land degradation, sustainable land management, food security, and greenhouse gas fluxes in terrestrial ecosystems- Summary for Policymakers.
[63] McHarg, I.D. (1966). Ecological Determinism in F.F. Darling and J.P. Milton (eds.), Future Environments of North America. The Natural History Press, Garden City, NY, pp. 526-538.
[64] DELWP. (2019). Victoria’s Climate Science Report. Department of Environment, Land, Water and Planning (DELWP), the State of Victoria Government, Melbourne. p. 48.
[65] Sanderson, B.M., Fisher, R.A. (2020). A fiery wake-up call for climate science. Nature Climate Change, 10(3): 175-177.
[66] Van Oldenborgh, G.J., Krikken, F., Lewis, S., Leach, N.J., Lehner, F., Saunders, K.R., Van Weele, M., Haustein, K., Li, S.H., Wallom, D., Sparrow, S., Arrighi, J., Singh, R., Van Aalst, M., Philip, S., Vautard, R., Otto, F.E.L. (2020). Attribution of the Australian bushfire risk to anthropogenic climate change. Nat. Hazards Earth Syst. Sci. Discuss: 1-46. http://dx.doi.org/10.5194/nhess-2020-69
[67] SCS. (2014). Surf coast region profile. Surf Coast Shire. prepared by Nancy Vaughan for the G21 Geelong Region Alliance.
[68] Neill, S., Handmer, J. (2012). Responding to bushfire risk: the need for transformative adaptation. Environmental Research Letters, 7(1): 014018. http://dx.doi.org/10.1088/1748-9326/7/1/014018
[69] Sharples, J.J., Cary, G.J., Fox-Hughes, P., Mooney, S., Evans, J.P., Fletcher, M.S., Fromm, M., Grierson, P.F., McRae, R., Baker, P. (2016). Natural hazards in 8Australia: extreme bushfire. Climatic Change, 139(1): 85-99. https://link.springer.com/article/10.1007/s10584-016-1811-1
[70] Boer, W.D., Mao, Y.J., Hagenaars., Vries, S.D., Slinger, Vellinga, T. (2019). Mapping the sandy beach evolution around seaports at the scale of the African Continent. Journal of Marine Science and Engineering, 7(5): 151. http://dx.doi.org/10.3390/jmse7050151
[71] Luijendijk, A., Hagenaars, G., Ranasinghe, R., Baart, F., Donchyts, G., Aarninkhof, S. (2018). The state of the world’s beaches. Scientific Reports, 8(1): 6641.
[72] Cazenave, A., Dieng, H.-B., Meyssignac, B., von Schuckmann, K., Decharme, B., Berthier, E. (2014). The rate of sea-level rise. Nature Climate Change, 4(5): 358-361. https://www.nature.com/articles/s41598-018-24630-6.
[73] Graeme, D.H., Kathleen, L.M. (1999). A storm surge inundation model for coastal planning and impact studies. Journal of Coastal Research, 15(1): 168-185.
[74] Ramirez, J., Lichter, M., Coulthard, T.J., Skinner, C. (2016). Hyper-resolution mapping of regional storm surge and tide flooding: Cmparison of static and dynamic models. Natural Hazards, 82(1): 571-590. https://link.springer.com/article/10.1007/s11069-016-2198-z.
[75] Hua, P., Yang, W.Y., Qi, X.C., Jiang, S.S., X. J.Q., Gu, X.Y., Li, H.H., Zhang, J., Krebs, P. (2020). Evaluating the effect of urban flooding reduction strategies in response to design rainfall and low impact development. Journal of Cleaner Production, 242: 118515. https://doi.org/10.1016/j.jclepro.2019.118515
[76] Avashia, V., Garg, A. (2020). Implications of land use transitions and climate change on local flooding in urban areas: An assessment of 42 Indian cities. Land Use Policy, 95: 104571. https://doi.org/10.1016/j.landusepol.2020.104571
[77] Keogh, D.U., Apan, A., Mushtaq, S., King, D., Thomas, M. (2011). Resilience, vulnerability and adaptive capacity of an inland rural town prone to flooding: a climate change adaptation case study of Charleville, Queensland, Australia. Natural Hazards, 59(2): 699-723. http://dx.doi.org/10.1007/s11069-011-9791-y
[78] Steffen, W., Burbidge, A.A., Hughes, L., Kitching, R., Lindenmeyer, D., Musgrave, W., Smith, M.S., Werner, P.A. (2009). Australia's biodiversity and climate change. CSIRO Publishing, Collingwood, 303.
[79] DCC. (2009). Department of Climate Change (Ed.), Climate Change Risks to Australia's Coast, A First Pass National Assessment, Australian Government, Canberra.
[80] MacCulloch, J., Marshall, B. (2012). Aboriginal Cultural Heritage Conservation Manual: GORCC Crown Land Reserves Between Torquay and Lorne. Terra Culture Heritage Consultants, 2012. p. 105.
[81] Bloom, D.E., Canning, D., Fink, G. (2008). Urbanization and the Wealth of Nations. Science, 319(5864): 772-775. http://dx.doi.org/10.1126/science.1153057
[82] Zhang, N., Wang, B. (2016). Toward a sustainable low-carbon China: A review of the special issue of “energy economics and management”. Sustainability, 8(8): 823. http://dx.doi.org/10.3390/su8080823
[83] Tao, Y., Li, F., Crittenden, J.C., Lu, Z.M., Sun, X. (2016). Environmental Impacts of China’s Urbanization from 2000 to 2010 and Management Implications. Environmental Management, 57(2): 498-507. https://link.springer.com/article/10.1007/s00267-015-0614-x.
[84] Lin, S., Sun, J., Marinova, D., Zhao, D.T. (2017). Effects of Population and Land Urbanization on China’s Environmental Impact: Empirical Analysis Based on the Extended STIRPAT Model. Sustainability, 9(5): 825. http://dx.doi.org/10.3390/su9050825
[85] Grimmond, S. (2007). Urbanization and global environmental change: Local effects of urban warming. The Geographical Journal, 173(1): 83-88. https://doi.org/10.1111/J.1475-4959.2007.232_3.X
[86] Aguilar, A.G. (2008). Peri-urbanization, illegal settlements and environmental impact in Mexico City. Cities, 25(3): 133-145. https://doi.org/10.1016/j.cities.2008.02.003
[87] Aguilar, A.G., Santos, C. (2011). Informal settlements’ needs and environmental conservation in Mexico City: An unsolved challenge for land-use policy. Land Use Policy, 28(4): 649-662. https://doi.org/10.1016/j.landusepol.2010.11.002