Abdul Wahid* | Sunaryo | Adi Susilo | Wiyono
© 2022 IIETA. This article is published by IIETA and is licensed under the CC BY 4.0 license (http://creativecommons.org/licenses/by/4.0/).
OPEN ACCESS
Karst zoning and channel aquifers in the karst basin at Sendang Biru Beach, Tambak Rejo Village have been investigated. Sendang Biru Beach has a cave appearance as a karst morphological feature and is composed of limestone. Seasonal karst water sources come from springs, surface runoff, underground rivers, channels in valleys, basins, and slopes that often experience drought. The purpose of this study is to identify the presence of karst aquifers and karstification zones that are prone to damage or disasters in the karst environment. The method used is a geophysical combination of Electrical Resistivity Tomography (ERT), Induced Polarization (IP), and Self Potential (SP). The results showed that the eastern part's karstification zone was characterized by moderate to high resistivity and a chargeability zone with a moderate to high range. In addition, the existence of karst aquifer channels in the anomalous zone of low resistivity, high chargeability, and negative natural potential. This zone is located in the Qas Formation, with the water flowing from west to east and from west to south. The inundated karst aquifer that spreads in a circular pattern with different depths interspersed by limestone cracks causes a heterogeneous karstification process.
resistivity, chargeability, natural potential, geoelectricity, clay rock
Aquifers in karst areas account for 7-12% of the world's land area and supply 25% of the world's population [1]. Karst is a landscape resulting from the dissolution process that has undergone karstification in the form of endokarst caves [2]. Carbonate karst aquifers play an important role in water supply, irrigation, power generation with quality and quantity of water. However, according to Rizzo et al. [3], the system is vulnerable and dynamic due to the characteristic features of heterogeneity, anisotropy, porosity type of karst aquifer (rock matrix, fracture, and channel porosity), and variability. Therefore, to protect the aquifer source, it is necessary to identify accurately such as the development of karst conduit, karstification zoning, and analysis of differences in the characteristics of the karst system. The aim is as a scientific basis for establishing risk zones that can cause disasters in the form of groundwater pollution and drought, and sinkholes [4-6].
In this regard, geophysical surveys have a significant role in identifying and displaying geological structures near the surface, such as karst voids, faults, aquifer structures (type, depth, groundwater level), and geological structures [7]. However, according to Tripathi & Fryar [8], characterizing the aquifer flow in the karst plain is difficult to map because it can be concentrated through the conduit, and it does not always match the appearance on the surface. Therefore, several methods such as ERT, IP, and SP have good correlations for different purposes. For example, the ERT method for mapping subsurface electrical resistivity spatial variations and the IP method for mapping chargeability variations. Meanwhile, the SP method is used to characterize groundwater flow in karst land. That is due to the electric potential gradient generated by the horizontal flow of water along the fracture or conduit channel and the vertical infiltration of water towards the fracture or shaft [9].
On the other hand, several studies use geophysical methods to characterize karst landscapes. Among them, identifying the voids and morphology of karst landscapes and karst water circulation in karst structures [3, 8-10], SP and ERT methods of karst aquifer exploration [5, 11, 12], as well as IP methods for the use of detection features. doline cover debris [13-16]. Then, epikarst features with geophysics [17], and microgravity, ERT, and seismic application to detect karst sinkholes [17, 18]. Furthermore, a combination of ERT, IP, and SP methods was applied for the investigation of groundwater in the dissolution process of rock due to intrusion [19], zone of mineralization of graphite content [20], and environmental contamination due to landfill leakage [21]. Another method is a combination of Ground Penetrating Radar (GPR) and ERT to study karst structures [21], a combination of geoelectrical localization and electromagnetic geohydrology [22]. In addition, several researchers have carried out geophysical approaches such as the application of geophysical and hydro-chemical methods to protect karst aquifers [23], integrated geophysical approaches for localization of karst channels [8], and hydro-geophysical characterization of karst aquifers [24]. However, what is interesting is the use of ERT, IP, and SP methods which gives good results. Meanwhile, the characterization of karst aquifers using the IP method gave inconsistent results [24].
Sendang Biru Beach, located in Tambak Rejo Village, Sumber Manjing Wetan District-Malang, comprises limestone or dolomite, which easily dissolves when water is passed. The topography and condition of the area with a limestone-dominated arrangement [25] have the potential for karst aquifers and karstification zones that are vulnerable to damage or disasters karst environment. According to Jacoby et al. [2], this area has the appearance of caves as a karst morphological characteristic. The karst water sources come from springs, surface runoff, and underground conduit rivers. Sahrina et al. [25] has succeeded in identifying 36 springs in the Karst area of Sendang Biru. These springs are spread out in valleys, basins, or on slopes and are seasonal springs or epikarst springs. It belongs to the diffuse or fissure type, so that dissolution occurs more intensively. Then, Guo et al. [26] explained, this area includes perennial flows (flow throughout the year), meaning that it has temporal fluctuations in the rainy and dry seasons that are not too large. In addition, the area also has the potential for considerable fisheries resources in East Java. There is a fish auction place, and Sempu Island across the coast is designated as a nature reserve [27], where the place often experiences drought in the dry season [28, 29].
Based on this, the purpose of this study was to identify the karstification zone and aquifer conduit in the karst basin at Sendang Biru Beach, Tambak Rejo Village. A new method has been proposed in this paper with a combination of geophysical and IP methods to identify karst inconsistencies. The ERT and IP methods were integrated to provide insight into near-surface geological formations and identify possible preferential conduit pathways. In particular, IP and SP measurements are used to detect clay formations and information related to the direction of shallow aquifer water flow.
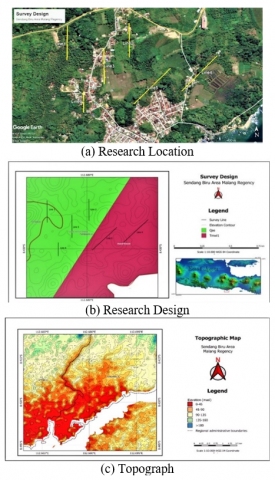
This research was conducted at Sendang Biru Beach, Tambak Rejo Village, Sumber Manjing Wetan District, South Malang Regency. Figure 1 shows a geological map of Sendang Biru Beach, including a topographic map, location, and research design. Geographically, the location is at the positions 08°37'- 08°41'LS and 112°35'- 112°43'E with an average topographical height of 0 – 100 masl (Figure 1a).
The geological conditions are in the two rock formations of the research sites. The first is the Qas formation, consisting of gravel, sand, clay, and plant remains. This formation is located on lines 1, 2, 3, and 6 of the Qas formation (swam and river sediment), where the length of lines 1,2 3,4, and 5 is 240 m, and line 6 is 160 m long. The second formation is Wonosari, located on lines 4 and 5, composed of several types of limestone such as coral, clay, tuff, sandy, marl, black peat claystone, and calcirudite from the Middle Miocene Wonosari Formation [2]. In the Qas formation, there are two springs in the form of open drain holes located on lines 1 and 6 (Figure 1b). Spring 1 at the measuring point 160 m is at the midpoint of measuring line 1, while well two at the measuring point 10 m is at measuring point 6. In addition, in the Qas formation there are also drilled wells located on lines 2 and 3.
There are three methods used such as: geoelectrical resistivity (E.R.T.), I.P., and S.P. methods. Resistivity and I.P. measurements used a Georesistivitymeter multi-electrode prospecting measurement, the M.A.E. model. A6000E. Measurements were carried out from 7 to 9 April 2021. Figure 1(b) shows that the six lines consist of the Qas formation with four lines and the Wonosari formation with two lines. Firstly, the resistivity and IP measurements were carried out using a dipole to dipole stretch with an electrode distance of 10 m. The six lines are made with 240 m and 160 m on lines 1-5 and 6, respectively. Secondly, a multi-electrode geo-resistivity meter is used when resistivity and IP measurements are no longer possible due to field influences. In this case, line 6 is shorter because the research location does not allow up to 240 m. After all, it is blocked by several residents' houses. Therefore, a multi-electrode geo-resistivity tool is used, which in particular has a 24-channel electrode that can measure resistivity and IP simultaneously at the same time. Once an electric current is applied, the resistivity value is immediately measured, and after that, a few moments after the electric current is stopped, the IP value is also measured. Third, resistivity and IP data are processed and interpreted using Res2Dinv and Oasis Montaj software. The aim is to analyze the subsurface bedding pattern.
The next step is to measure the distance between the porous pots using the SP method. Every 5 m distance was measured on the same lines as in the ERT and IP measurements. Measurements were carried out using the Leap-Frog system using copper wire electrodes. This electrode is immersed in 2 porous pots containing CuSO4 solution with the same concentration of a solution. Finally, the measured natural potential data were corrected, calibrated, and plotted with Surfer 10 software. The aim is to obtain an isopotential contour map that interprets the direction of underground river flow at the study site [12, 20].
Figure 1. Geological Map of Sendang Biru Beach (Google Maps)
3.1 Identification of sub-surface bedding patterns
A geophysical method is a tool to investigate hydro-geologies such as aquifer characterization, sub-surface geometry information, karst system structure, epikarst, infiltration zone, and sinkhole [30]. Sinkholes are one of the indicators of layering patterns near the surface of active underground karst features. It can be identified in cavities, conduits, and fractures that enlarge due to the karstification process. Meanwhile, karst conduit containing water as a source of water supply for the world's population can be identified by the presence of karst aquifer resources. Therefore, a scientific understanding of karst areas and aquifers, karst conduits, and underground rivers are needed [6, 31]. That can be done by measuring the rock resistivity to a certain depth.
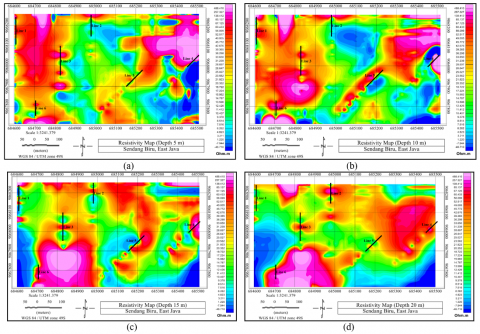
Rock resistivity depends on the degree of fracture and the percentage of fracture-filled with groundwater. This shows that the resistivity of the rock depends on the degree of fracture. The larger the fracture, the greater the percentage of groundwater flowing into the fracture. That will cause the resistivity value to be smaller. According to Loke [32], sedimentary rocks are usually more porous and have higher water content and wetter soils. Furthermore, freshwater loam soils usually have lower resistivity values than sandy soils. Furthermore, freshwater clay soils usually have lower resistivity values than sandy soils. Figure 2 shows the resistivity map measurement at a depth of 5 to 40 meters. As the basis for data interpretation, open sinkhole references are used in the form of springs located on paths 1 and 6 and low resistivity anomalies to characterize karst aquifers. Generally, resistivity values are classified into three zones [32-36]. The measurement results obtained resistivity anomalies between 1.2 m to 485 m and were classified as shown in Table 1.
Table 1. Subsurface resistivity distribution
|
No. |
Contour color |
Resistivity (Ω.m) |
Level |
|
1. |
Blue- Green |
1.2-8.5 |
Low |
|
2. |
Dark green- Yellow |
8.6–26. 8 |
Medium |
|
3. |
Brown - Purple |
26.9-485 |
High |
3.1.1 High resistivity zone
The sub-surface layer pattern was obtained based on the interpretation of the six tracks using the Res2Dinv and Oasis Montaj software. Res2Dinv software is used to determine the resistivity value of rock layers using the inversion method. In contrast, Oasis Montaj is used to illustrate resistivity results. The high resistivity zones are located at lines 1, 3, and 6 to a depth of 10 m to the west (Figure 2b), and lines 2, 4, and 5 to a depth of 40 m to the east (Figure 2h). According to Plank & Polgár [36], a high resistivity zone with a depth of 40 m is interpreted as an alluvium overburden layer and material heap. This zone is below the surface on lines 1, 3, and 6 to the west. While in the eastern part with lines 2, 4, and 5 are interpreted as massive limestone. Several authors have suggested that massive limestones dominate the high resistivity with depths between 25-40 m [33, 34, 37-39].
3.1.2 Medium resistivity zone
The resistivity is being obtained at:
- Tracks 1 and 6 with a depth of 15 m – 40 m;
- Tracks 2 and 5 in the middle to a depth of 5-15 m;
- Tracks 4 and 5 to a depth of 20m.
At moderate resistivity with a depth of 15-40 m, some researchers have interpreted it as a layer of limestone that is saturated with water and a layer of clay in the form of a karst main water channel (conduit) [10, 40, 41] with springs in the form of open sinkholes. However, it is different from lines 2 and 5, which are also indicated as moderate resistivity zones. In this paper, found at a depth of 5 – 15 m were identified as cracked limestone containing wet clay in the form of a karst lens (Figure 2 (a, b, c)). In addition, on the same trajectory with a depth of 15 – 30, there is water-saturated limestone (Figure 2 (c, f)), while at depths of 35 m to 40 m (Figure 2 (f, g, h)) at the bottom of the zone between paths 4 and 5 to a depth of 20 in the form of a karst aquifer is indicated as the cause of the karstification process [42, 43].
3.1.3 Low resistivity zone
Figure 2 (c-h) shows low resistivity, located in the western part of lines 1, 3, and 6 at a depth of 15 m to 40 m. That is interpreted as a layer of limestone saturated with water, and the clay layer is the main karst water channel (conduit) [10, 40, 41]. This spring is an open sinkhole located on lines 1 and 6. Low resistivity anomalies are also seen at a depth of 10 m (lines 2 and 5), 25 m (lines 4 and 5), and 30-40 m (lines 2, 3 and 5). These are all interpreted as karst aquifers [42, 43]. In addition, generally, karst aquifers identified as having low resistivity can be attributed to high clay content in the form of marl or soil. It is characterized by sandy marl clay, gravel, sand, and weathered layers with relatively high-water content [16, 34, 44, 45].
Figure 2. Resistivity map depth of 5 to 40 meters
3.2 Chargeability measurement
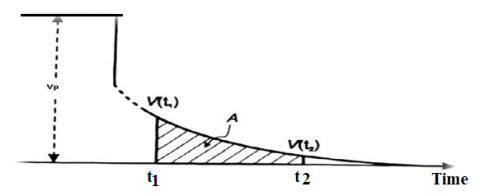
Chargeability is the ability of a rock or material to store an electric current when it hits it. The chargeability value of this rock is usually obtained through the IP method. The basic principle of the IP method is to flow an electric current into the earth and then observe the potential difference that occurs after the electric current is stopped. When the current is cut off, the potential difference must be zero immediately. However, the potential difference does not immediately become zero in certain mediums because the medium is like a capacitor (which stores electrical energy). Electrical energy is still stored in electrochemical energy in electrolyte fluids and conductive minerals in rock pores. So after the current is cut off, the previously polarized ions gradually return to their equilibrium state. In other words, there is still a voltage difference that will decrease over time until its value becomes zero. There are no special requirements for the amount of electric current that flows to the ground as long as the tool can still measure. In addition, the current is cut off, ideally, the potential difference immediately becomes zero / disappears, but in certain mediums, it will store electrical energy (as a capacitor) and be released again. However, even though the current has been cut off, the voltage difference that is still present will decay with time and gradually disappear/zero.
Polarization can occur due to the presence of a medium containing metallic minerals. As can be seen in Figure 3, a polarizing effect is obtained, the polarization effect is obtained. The value of Vs. is the voltage value after the polarization of the voltage decay results with time and produces the area under the potential decay curve. Therefore, the charging capability can also be reviewed by applying the integral concept to the voltage value after the current is turned off. According to equation 1, the apparent chargeability in time (milliseconds) is obtained.
$m=\frac{1}{V_{p}} \int_{t_{1}}^{t_{2}} V_{s}(t) d t=\frac{A}{V_{p}}$ (1)
where, Vs: measured potential after the current is turned off at time t1 to t2; Vp: initial injected potential; m: rock chargeability (milliseconds).
In addition, the IP method can identify disseminated minerals but is difficult for massive minerals. That is because the dispersed minerals are more easily polarized due to the current passing through them. Chargeability indicates how long the polarization effect will disappear as soon as the current is turned off.
Figure 3. The change in voltage decays Vs time and forms an area
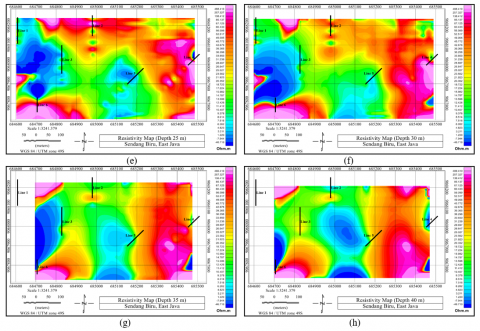
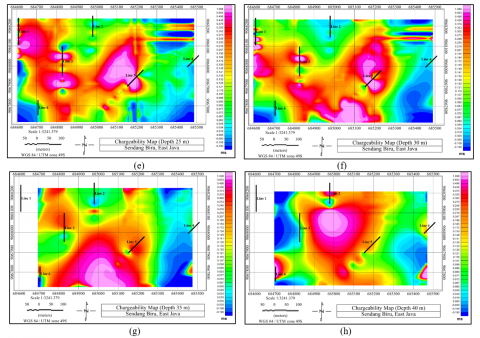
In this study, the IP method was used not to determine the type of rock but to determine the number of conductive minerals found in the rock in the form of metallic or clay minerals. The application of the IP method is based on the difference in the polarization of limestone with the surrounding medium and clay [46]. In this case, chargeability is controlled by the percentage of current flowing through the massive rock and the narrow pore size. When chargeability increases significantly with increasing exploration depth, this indicates the presence of more massive rocks. Yatini [47] explains, the greater the water content, the greater the chargeability due to swelling of the clay content. Figure 4 shows the level of chargeability anomaly in the location area. As with the measurement of rock resistivity, the chargeability anomaly values are also grouped into three parts [16, 20]:
-low chargeability rated 0.01 mV⁄V to 0.3 mV⁄V;
-moderate chargeability with values of 0.31 mV⁄V to 0.42 mV⁄V;
-high chargeability greater than 0.42 mV⁄V to 1.058 mV⁄V.
The three chargeability values were obtained based on the measurement data, and the results were processed with the same software. In contrast to the resistivity value, the western part of the 1, 3, and 6 tracks is dominated by the moderate chargeability zone with a depth of 5 m. As previously explained, this zone is a layer of surface rock. Meanwhile, there is a tendency for the chargeability value to be high at a depth measurement of 10 m – 35 m. It can be interpreted that the limestone has weathered and is filled with clay material, and is saturated with water. However, there are two different chargeability anomaly values at a depth of 40 m. Moderate chargeability is seen right on tracks 1 and 6 from the surface indicated as the main conduit line. On the other hand, in the same zone, there is also a high chargeability anomaly. According to Schmutz et al. [16], the zone is the flow of water to the surface through open sinkhole springs through narrow pores of limestone.
Other measurement results obtained moderate to high chargeability values with a spread pattern in the research location. This subsurface rock layer structure indicates that the study site has karstification processes in limestone, which are heterogeneous based on depth [15, 19, 47, 48]. Zhang et al. [49], generally, water-filled karst caves usually begin with low apparent resistivity values and rapidly increasing conductivity. This condition occurs in the eastern part between track zones 2, 4, 5, and 2, 3.5 from the surface to a depth of 40 m (Figure 4 (h)). That is interpreted as limestone that has undergone cracks and filled with other materials such as clay, marl, sand, and gravel that function as aquifer water retainers. In addition, several zones have low chargeability values, as shown in Figure 4(b), (d), (g), and (h). This zone is above tracks 4 and 5 at a depth of 10 m, 20, and 25 m, and below at the same track a depth of 25 - 40 m which is interpreted as massive limestone.
3.3 Analysis of self potential data interpretation
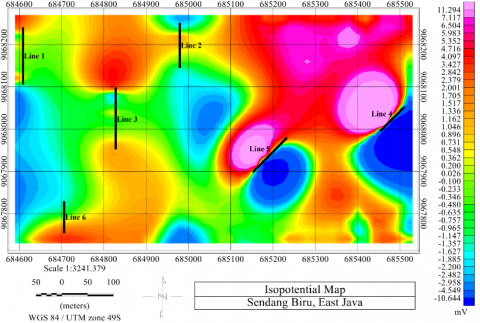
The SP is a passive method because the measurements are carried out without injecting electric current through the ground surface. The natural potential difference of the soil is measured through two points on the ground surface—the measurable potential ranges from a few millivolts (mV) to 1 volt. SP can be a spontaneous potential on the earth's surface caused by a mechanical process or an electrochemical process controlled by groundwater. Here, an isopotential contour map analysis is performed to interpret the direction of underground river flow. In general, negative SP anomalies are associated with low ER anomalies generated by groundwater flow. Then, this groundwater flow can be masked by the positive SP response generated by the infiltration. The fluid flow through a subsurface medium produces an electrokinetic potential or a different flow from an area without fluid motion.
Figure 5 shows an isopotential map measurement with a depth of 5 to 40 meters. Based on the results of measurements and data processing obtained natural potential values with a range between -10,644 mV to 11,294 mV, which are classified into:
- Negative natural potential zone = 10,644 mV to – 0.100 mV;
- Positive natural potential zone = 0.026 mV to 11.294 mV.
Based on this classification, it can be seen that the SP zone is negative to positive on lines 1, 3, and 6 in the west. That indicates that this zone includes water flow through the subsurface media producing an electrokinetic potential. According to Ayolabi et al. [14], the negative natural potential anomaly and low resistivity indicate that the anomaly is likely to represent a sedimentary sinkhole and main conduit channel. This opinion is reinforced by Zhu et al. [50, 51], that negative natural potential anomaly with low resistivity anomaly can be identified as the target location for the presence of conduit. Therefore, in this study, we have interpreted the direction of the water flow to the north in the open sinkhole spring, located on line 1. Then, the flow direction is east to south at the open sinkhole spring located on line 6. Furthermore, the water flow movement is also affected by topography or gravity flow [7, 52]. Using this reference and the plot results found a dominant low positive anomaly above lines 2, 4, and 5 to the east. That indicates the presence of an absorption zone vertically through the epikarst zone to the cavity. Because it is positive, according to Jardani et al. [53], the cavity is usually filled by a conductive material.
Figure 4. Chargeability Map with a depth of 5 to 40 meters
Figure 5. Isopotential map depth of 5 to 40 meters
Another finding is a small natural potential anomaly scattered at several points located at the bottom of lanes 2 and 4. The zone with the most negative natural potential value indicates the presence of shallow groundwater sources. This opinion was expressed by Baggett et al. [54]; the smaller the potential for natural anomalies, the negative value. That is, the accumulation of water flow to the location is relatively large. In other words, this zone is interpreted as a catchment area for karst aquifers, which is the cause of the karstification process of dissolving carbonate rocks [48, 53].
3.4 Discussion
Discontinuities characterize karst areas with reduced surface water drainage due to the presence of cracked and brittle rocks. This condition causes rivers to flow underground often [10]. Meanwhile, the local community is very dependent on karst groundwater sources. During the dry season in karst landscapes, water is stored in abundance in inaccessible underground conduit systems [55]. At the same time, karst aquifers can store and transmit the main source of drinking water in many areas around the world [56]. On the other hand, water is the backbone of life and the essence of human survival. Therefore, according to Salih [57], monitoring the quality of water resources becomes very necessary.
The process of karstification often results in natural underground cavities. As a result, dissolution occurs, allowing the formation of caves or creating sinkholes [17]. According to Sahrina et al. [25], the epikarst zone is concentrated from rainwater infiltration. It has permeability and porosity due to the widening gap resulting from dissolving. On the other hand, the clay rock water retention is structure weak. Therefore, karst is formed by limestone or carbonate rock that has been eroded by karstification, creating cavities, sinkholes, fractures, and other distinctive cracks. Environmental issues and groundwater engineering challenges are groundwater exploration, vulnerability assessment, and hazard estimation [11, 32]. According to Fernandes et al. [58], pressure point sources are the most obvious among the many threats to water quality. Despite this approach, these authors report that the major threat and main benefit to water quality in agriculture depends on land use, urban or forestry.
In this study, very small resistivity values were found in the western part of paths 1, 3, and 6 in the Qas Formation with a depth of 15 m to 40 m. This condition indicates the presence of karst aquifer conduit channels through open sinkhole springs [18, 22, 48]. It has been verified by the results of community wells drilled on line 3 with an average depth of 15 m to 24 m. Another evidence is that the chargeability value is in moderate to high anomaly at that location. That indicates the limestone has undergone weathering, is filled with clay material, and is saturated with water [13, 50, 54, 59, 60]. In addition, at the same location, the negative natural potential anomaly is interpreted as a conduit path with a branching water flow direction. The first branch goes to track 1, while the second branch goes to lines 3 and 6.
Karst aquifers usually have different physiographic characteristics resulting from the dissolution of carbonate rocks. Usually form a sinkhole characterized by a network of fractures and conduits. Its function is the main link between surface water and groundwater by collecting rainfall and channeling it internally to the subsurface. In general, the existence of these sinkholes causes damage to property and infrastructure in karst areas around the world [61]. Based on the interpretation, results obtained a low resistivity anomaly in the eastern part circular to a 15 m. It is at the top between line 2 (Qas formation), line 4 and line 5 (Wonosari formation), and below line 2. This zone is interpreted as a karst aquifer and has been verified by the presence of drilled track 2 with a depth of 20 m.
As previously described, in the zone below lines 4 and 5, a low resistivity anomaly is obtained, which is indicated as the cause of the karstification process. Then, it is seen that the resistivity value tends to be high. Symptoms like this are interpreted as limestone fractured and filled by other materials in the karstification process is running [13, 48, 59]. That has been verified with a moderate to high chargeability zone due to the presence of clay, marl, sand, and gravel which act as retainers of inundated aquifers [16, 19, 48]. There is also a low positive natural potential anomaly. That shows the absorption zone vertically through the epikarst zone towards the cavity because it is positive. When the cavity is filled by a conductive material (clay or water), the cavity filled with a conductive material produces a positive natural potential anomaly [7, 53]. On the other hand, at the top of lines 2, 4, and 5, a high resistivity zone is inserted with a moderate resistivity zone to a depth of 40 m, interpreted as limestone [50].
Furthermore, karst aquifers are formed in a diffuse, heterogeneous, and circular pattern below line 5 with a depth of 25-40 m (low resistivity). That also shows that the limestone that has been fractured has been filled with other materials in the form of clay, marl, sand, and gravel. Likewise, the karst aquifer, which functions as a reservoir for stagnant water, has undergone a karstification process in limestone. Several previous researchers have also done the same thing on heterogeneous zones based on depth [15, 19, 48, 49]. In addition, this identification has been verified with moderate to high chargeability values with a spreading pattern to a depth of 40 m. It has also been confirmed by Schmutz et al. [16] that fractured limestone found in potential natural anomalies has a negative value. Thus, the relatively large accumulation of water flow to the location is interpreted as an aquifer catchment area, and it is the cause of the karstification process of dissolving carbonate rocks [17, 62].
The use of a combination of ERT, IP, and SP methods has succeeded in identifying the characteristics of the presence of karstification zones and conduit aquifer zones in the Karst area of Sendang Biru Beach, including:
(1) The eastern part, dominated by limestone, has experienced cracks and is inserted with sandy marl clay, gravel, sand, and weathered layers with relatively high-water content.
(2) A flooded karst aquifer spreads in a circular pattern with different depths interspersed with limestone, which causes a heterogeneous karstification process in the Wonosari formation.
(3) The conduit aquifer zone is seen in the western part of the location in the Qas formation, with the flow direction branching from west to north and east to south.
The authors would like to thank the Head of the Geophysics Laboratory, FMIPA, Brawijaya University, Head of the Marine Station Laboratory, FPIK, Brawijaya University and the Department of Physics, FST, UIN Maulana Malik Ibrahim, as well as support for the 2019 BPPDN scholarship from the Ministry of Research Technology and Higher Education.
|
ERT |
Electrical Resistivity Tomography |
|
IP |
Induced Polarization |
|
SP |
Self Potential |
[1] Buckerfield, S.J., Quilliam, R.S., Waldron, S., Naylor, L.A., Li, S., Oliver, D.M. (2019). Rainfall-driven E. coli transfer to the stream-conduit network observed through increasing spatial scales in mixed land-use paddy farming karst terrain. Water Research X, 5: 100038. https://doi.org/10.1016/j.wroa.2019.100038
[2] Jacoby, B.S., Peterson, E.W., Kostelnick, J.C., Dogwiler, T. (2013). Approaching cave level identification with GIS: A case study of Carter Caves. International Scholarly Research Notices. https://doi.org/10.1155/2013/160397
[3] Rizzo, E., Giampaolo, V., Capozzoli, L., Grimaldi, S. (2019). Deep electrical resistivity tomography for the hydrogeological setting of Muro Lucano Mounts aquifer (Basilicata, Southern Italy). Geofluids, 2019: 6594983. https://doi.org/10.1155/2019/6594983
[4] Ganiyu, S.A., Oladunjoye, M.A., Onakoya, O.I., Olutoki, J.O., Badmus, BS. (2020). Combined electrical resistivity imaging and ground penetrating radar study for detection of buried utilities in Federal University of Agriculture, Abeokuta, Nigeria. Environmental Earth Sciences, 79(8): 1-20. https://doi.org/10.1007/s12665-020-08919-2
[5] Susilo, A., Sutanhaji, A.T., Fitriah, F., Hasan, M.F. (2017). Identification of underground river flow in karst area using geoelectric and self-potential methods in Druju Region, Southern Malang, Indonesia, 12: 10731-10738.
[6] Chen, Y., Qin, X., Huang, Q., Gan, F., Han, K., Zheng, Z., Meng, Y. (2018). Anomalous spontaneous electrical potential characteristics of epi-karst in the Longrui Depression, Southern Guangxi Province, China. Environmental Earth Sciences, 77(19): 1-9. https://doi.org/10.1007/s12665-018-7839-y
[7] Özel, S., Darıcı, N. (2020). Environmental hazard analysis of a gypsum karst depression area with geophysical methods: A case study in Sivas (Turkey). Environmental Earth Sciences, 79(5): 1-14. https://doi.org/10.1007/s12665-020-8861-4
[8] Tripathi, G.N., Fryar, A.E. (2016). Integrated surface geophysical approach to locate a karst conduit: A case study from Royal Spring Basin, Kentucky, USA. Journal of Nepal Geological Society, 51: 27-37. https://doi.org/10.3126/jngs.v51i0.24085
[9] Wanfang, Z., Beck, B.F., Stephenson, J.B. (1999). Investigation of groundwater flow in karst areas using component separation of natural potential measurements. Environmental Geology, 37(1): 19-25. https://doi.org/10.1007/s002540050355
[10] Artugyan, L., Urdea, P. (2016). A complex approach in the interdisciplinary field of karst geomorphology. The case study of Anina karst area (Banat Mountains, Romania). In Forum Geografic, 15(1): 16. https://doi.org/10.5775/fg.2016.065.i
[11] Abdel Hafeez, T.H., Sabet, H.S., El-Sayed, A.N., Zayed, M.A. (2018). Geoelectrical exploration of groundwater at West Dayrout Area, Assiut Governorate, Egypt. NRIAG Journal of Astronomy and Geophysics, 7(2): 279-296. https://doi.org/10.1016/j.nrjag.2018.07.004
[12] McCormack, T., O’Connell, Y., Daly, E., Gill, L.W., Henry, T., Perriquet, M. (2017). Characterisation of karst hydrogeology in Western Ireland using geophysical and hydraulic modelling techniques. Journal of Hydrology: Regional Studies, 10: 1-17. https://doi.org/10.1016/j.ejrh.2016.12.083
[13] Ikard, S., Pease, E. (2019). Preferential groundwater seepage in karst terrane inferred from geoelectric measurements. Near Surface Geophysics, 17(1): 43-53. https://doi.org/10.1002/nsg.12023
[14] Ayolabi, E.A., Enoh, I.J., Folorunso, A.F. (2013). Engineering site characterisation using 2-D and 3-D electrical resistivity tomography. Earth Science Research, 2(1): 133-142. https://doi.org/10.5539/esr.v2n1p133
[15] Abdulsamad, F., Revil, A., Ahmed, A.S., Coperey, A., Karaoulis, M., Nicaise, S., Peyras, L. (2019). Induced polarization tomography applied to the detection and the monitoring of leaks in embankments. Engineering Geology, 254: 89-101. https://doi.org/10.1016/j.enggeo.2019.04.001
[16] Schmutz, M., Ghorbani, A., Vaudelet, P., Revil, A. (2011). Spectral induced polarization detects cracks and distinguishes between open-and clay-filled fractures. Journal of Environmental & Engineering Geophysics, 16(2): 85-91. https://doi.org/10.2113/JEEG16.2.85
[17] Hussain, Y., Uagoda, R., Borges, W., et al. (2020). Detection of cover collapse doline and other Epikarst features by multiple geophysical techniques, case study of Tarimba cave. Brazil. Water, 12(10): 2835. https://doi.org/10.3390/w12102835
[18] Pazzi, V., Di Filippo, M., Di Nezza, M., et al. (2018). Integrated geophysical survey in a sinkhole-prone area: Microgravity, electrical resistivity tomographies, and seismic noise measurements to delimit its extension. Engineering Geology, 243: 282-293. https://doi.org/10.1016/j.enggeo.2018.07.016
[19] Ilias, F., Chitea, F., Horia, M., Dumitru, I., Lidia, N. (2018). Geophysical investigation of the near surface groundwater flow in the area of meledic plateau (Buzau County, Romania): Preliminary results. International Multidisciplinary Scientific GeoConference: SGEM, 18(1.1): 833-840. https://doi.org/10.5593/sgem2018/1.1/S05.104
[20] Heritiana R.A., Riva, R., Ralay, R., Boni, R. (2019). Evaluation of flake graphite ore using self-potential (SP), electrical resistivity tomography (ERT) and induced polarization (IP) methods in east coast of Madagascar. Journal of Applied Geophysics, 169: 134-141. https://doi.org/10.1016/j.jappgeo.2019.07.001
[21] Gallas, J.D.F., Taioli, F., Malagutti Filho, W. (2011). Induced polarization, resistivity, and self-potential: a case history of contamination evaluation due to landfill leakage. Environmental Earth Sciences, 63(2): 251-261. https://doi.org/10.1007/s12665-010-0696-y
[22] Papadopoulos, T.D., Alexopoulos, J.D., Dilalos, S. (2020). Combined geoelectrical and geoelectromagnetic survey for contributing to local hydrogeological regime–The case study of Delfini basin (Chios isl.–Greece). Geology and Geophysics of Russian South, 10(1): 68. https://doi.org/10.23671/VNC.2020.1.59066
[23] Song, K., Yang, G., Wang, F., Liu, J., Liu, D. (2020). Application of geophysical and hydrogeochemical methods to the protection of drinking groundwater in karst regions. International Journal of Environmental Research and Public Health, 17(10): 3627. https://doi.org/10.3390/ijerph17103627
[24] Saribudak, M., Hawkins, A. (2019). Hydrogeopysical characterization of the Haby crossing fault, san Antonio, Texas, USA. Journal of Applied Geophysics, 162: 164-173. https://doi.org/10.1016/j.jappgeo.2019.01.009
[25] Sahrina, A., Fitrianti, D., Suprianto, A., Labib, M.A. (2020). Potential and challenges of karst water resources in Sumbermanjing Wetan District of Malang Regency. In IOP Conference Series: Earth and Environmental Science, 412(1): 012032. https://doi.org/10.1088/1755-1315/412/1/012032
[26] Guo, Y., Zhang, X., Wang, Q., Chen, H., Du, X., Ma, Y. (2020). Temporal changes in vegetation around a shale gas development area in a subtropical karst region in southwestern China. Science of the Total Environment, 701: 134769. https://doi.org/10.1016/j.scitotenv.2019.134769
[27] Widiana, F., Wikantiyoso, R. (2018). Implementation of local wisdom in the Sendang Biru Beach Tourism Development strategy for the Conservation of Sempu Island. Local Wisdom: Jurnal Ilmiah Kajian Kearifan Lokal, 10(1). https://doi.org/10.26905/lw.v10i1.2397
[28] Boimau, Y., Suryo, Susilo, A. (2018). Identification of underground river flow in karst area of Sumber Bening-Malang, Indonesia Based on geoelectrical self-potential and resistivity data. International Journal of Applied Physics (SSRG-IJAP), 5(3): 1-7. https://doi.org/10.14445/23500301/ijap-v5i3p101
[29] Hasan, M.F.R., Adi, S., Sunaryo. (2018). Identification of underground river flow pattern using self potential (SP) and resistivity methods for drought mitigation at Druju, Sumbermanjing Wetan, Indonesia. Disaster Adv., 11(5): 25-31.
[30] Guevara-Mansilla, O., López-Loera, H., Ramos-Leal, J.A., Ventura-Houle, R., Guevara-Betancourt, R.E. (2020). Characterization of a fractured aquifer through potential geophysics and physicochemical parameters of groundwater samples. Environmental Earth Sciences, 79(14): 1-17. https://doi.org/10.1007/s12665-020-09096-y
[31] Du, C.L., Chen, Y.X., Zhou, Y.S., Cheng, B. (2020). Application of a mathematical method in geophysics: Separating anomalies of horizontal gradients of the spontaneous potential field based on first-order difference. Journal of Applied Geophysics, 176: 104009. https://doi.org/10.1016/j.jappgeo.2020.104009
[32] Loke, M.H. (2000). Electrical imaging surveys for environmental and engineering studies. A practical guide to 2-D and 3-D surveys, 1-60.
[33] Abd El-Gawad, A.M.S., Helaly, A.S., Abd El-Latif, M.S.E. (2018). Application of geoelectrical measurements for detecting the ground-water seepage in clay quarry at Helwan, southeastern Cairo, Egypt. NRIAG Journal of Astronomy and Geophysics, 7(2): 377-389. https://doi.org/10.1016/j.nrjag.2018.04.003
[34] Villela-y-Mendoza, A., Perez-Flores, M.A., Ochoa-Tinajero, L.E., Vargas-Huitzil, E. (2021). Applying resistivity (dipole-dipole, Schlumberger, and Wenner) joint inversion to detect endokarst features in Quintana Roo, México. Journal of South American Earth Sciences, 106: 103041. https://doi.org/10.1016/j.coviro.2021.08.007
[35] Waters, B.B., Doctor, D.H., Maynard, J.P. (2018). Using geophysics to map bedrock faults, dikes, and surficial geology in relation to karst features in the briery branch quadrangle, Rockingham County, Virginia. Conference: National Cave and Karst Research Institute Symposium 7, pp. 235-240. https://doi.org/10.5038/9780991000982.1024
[36] Plank, Z., Polgár, D. (2019). Application of the DC resistivity method in urban geological problems of karstic areas. Near Surface Geophysics, 17(5): 547-561. https://doi.org/10.1002/nsg.12062
[37] Elfakih, T.A., Bahi, L., Akhssas, A., Ouadif, L., Benkmil, R. (2020). Electrical resistivity tomography contribution to the characterization of underground cavities in the region of Safi, Morocco. In E3S Web of Conferences, 150: 03023. https://doi.org/10.1051/e3sconf/202015003023
[38] Kidanu, S., Varnavina, A., Anderson, N., Torgashov, E. (2020). Pseudo-3D-electrical resistivity tomography imaging of subsurface structure of a sinkhole—A case study in Greene County, Missouri. AIMS Geosciences, 6(1): 54-70. https://doi.org/10.3934/geosci.2020005
[39] Deceuster, J., Delgranche, J., Kaufmann, O. (2006). 2D cross-borehole resistivity tomographies below foundations as a tool to design proper remedial actions in covered karst. Journal of Applied Geophysics, 60(1): 68-86. https://doi.org/10.1016/j.jappgeo.2005.12.005
[40] Andrade-Gómez, L., Rebolledo-Vieyra, M., Andrade, J.L., López, P.Z., Estrada-Contreras, J. (2019). Karstic aquifer structure from geoelectrical modeling in the Ring of Sinkholes, Mexico. Hydrogeology Journal, 27(7): 2365-2376. https://doi.org/10.1007/s10040-019-02016-w
[41] Torrese, P. (2020). Investigating karst aquifers: Using pseudo 3-D electrical resistivity tomography to identify major karst features. Journal of Hydrology, 580: 124257. https://doi.org/10.1016/j.jhydrol.2019.124257
[42] Satitpittakul, A., Vachiratienchai, C., Siripunvaraporn, W. (2013). Factors influencing cavity detection in Karst terrain on two-dimensional (2-D) direct current (DC) resistivity survey: A case study from the western part of Thailand. Engineering Geology, 152(1): 162-171. https://doi.org/10.1016/j.enggeo.2012.10.015
[43] Seddique, A.A., Masuda, H., Anma, R., Bhattacharya, P., Yokoo, Y., Shimizu, Y. (2019). Hydrogeochemical and isotopic signatures for the identification of seawater intrusion in the paleobeach aquifer of Cox's Bazar city and its surrounding area, south-east Bangladesh. Groundwater for Sustainable Development, 9: 100215. https://doi.org/10.1016/j.gsd.2019.100215
[44] Ulm, W., Prins, C., Thuro, K., Krautblatter, M., Schulz, R. (2019). Testing the effectiveness of an inverse Wenner-Schlumberger array for geoelectrical karst void reconnaissance, on the Swabian Alb high plain, new line Wendlingen–Ulm, southwestern Germany. Engineering Geology, 249: 71-76. https://doi.org/10.1016/j.enggeo.2018.12.014
[45] Cheng, Q., Chen, X., Tao, M., Binley, A. (2019). Characterization of karst structures using quasi-3D electrical resistivity tomography. Environmental Earth Sciences, 78(9): 1-12. https://doi.org/10.1007/s12665-019-8284-2
[46] Eppelbaum, L.V. (2007). Revealing of subterranean karst using modern analysis of potential and quasi-potential fields. In 20th EEGS Symposium on the Application of Geophysics to Engineering and Environmental Problems, p. 179. https://doi.org/10.3997/2214-4609-pdb.179.0797-810
[47] Yatini, Y. (2018). Influence of clay on time domain induced polarization. Indones. J. Sci. Technol., 3(1): 1-10.
[48] Zhou, K., Zhang, S., Huang, Z., Zhang, J. (2019). An improved TSVD-GCV inversion algorithm of pore size distribution in time-domain induced polarization using migration Hankel matrix. Journal of Petroleum Science and Engineering, 183: 106368. https://doi.org/10.1016/j.petrol.2019.106368
[49] Gan, J.J., Zhang, Y.X., Xiao, L., Zhang, Y.X., Xiao, L. (2020). An application of the high-density electrical resistivity method for detecting slide zones in deep-seated landslides in limestone areas. J. Appl. Geophys., https://doi.org/10.1016/j.jappgeo.2020.104013
[50] Zhu, J., Currens, J.C., Dinger, J.S. (2011). Challenges of using electrical resistivity method to locate karst conduits—a field case in the Inner Bluegrass Region, Kentucky. Journal of Applied Geophysics, 75(3): 523-530. https://doi.org/10.1016/j.jappgeo.2011.08.009
[51] Oliveti, I., Cardarelli, E. (2017). 2D approach for modelling self-potential anomalies: Application to synthetic and real data. Bollettino di Geofisica Teorica ed Applicata, 58(4). https://doi.org/10.4430/bgta0198
[52] Artugyan, L., Urdea, P. (2014). Using spontaneous potential (SP) as a geophysical method for karst terrains investigation in the Mărghitaş Plateau (Banat Mountains, Romania). Revista de Geomorfologie, 16: 45-53.
[53] Jardani, A., Dupont, J.P., Revil, A. (2006). Self‐potential signals associated with preferential groundwater flow pathways in sinkholes. Journal of Geophysical Research: Solid Earth, 111(B9). https://doi.org/10.1029/2005JB004231
[54] Baggett, J., Abbasi, A., Monsalve, J., Bishop, R., Ripepi, N., Hole, J. (2020). Ground-penetrating radar for karst detection in underground stone mines. Mining, Metallurgy & Exploration, 37(1): 153-165. https://doi.org/10.1007/s42461-019-00144-1
[55] Widyastuti, M., Riyanto, I.A., Naufal, M., Ramadhan, F., Rahmawati, N. (2019). Catchment area analysis of guntur karst spring gunung kidul regency, Java, Indonesia. In IOP Conference Series: Earth and Environmental Science, 256(1): 012008. https://doi.org/10.1088/1755-1315/256/1/012008
[56] Kalhor, K., Ghasemizadeh, R., Rajic, L., Alshawabkeh, A. (2019). Assessment of groundwater quality and remediation in karst aquifers: A review. Groundwater for Sustainable Development, 8: 104-121. https://doi.org/10.1016/j.gsd.2018.10.004
[57] Salih, M.M. (2021). Developing spectral reflectance measurement system for environmental remote sensing applications. International Journal of Design & Nature and Ecodynamics, 16(1): 22-39. https://doi.org/10.org/10.18280/ijdne/160105
[58] Fernandes, A.C.P., Martins, L.M.O., Fernandes, L.F.S., Cortes, R.M.V., Pacheco, F.A.L. (2020). Exploring the effects of landscape metrics in water quality, Ave River basin case study. International Journal of Design & Nature and Ecodynamics, 15(1): 65-72. https://doi.org/10.18280/ijdne.150109
[59] Bin, L., Liu, Z.Y., Li, S., et al. (2017). Comprehensive surface geophysical investigation of karst caves ahead of the tunnel face: A case study in the Xiaoheyan section of the water supply project from Songhua River, Jilin, China. Journal of Applied Geophysics, 144: 37-49. https://doi.org/10.1016/j.jappgeo.2017.06.013
[60] Slater, L.D., Sandberg, S.K. (2000). Resistivity and induced polarization monitoring of salt transport under natural hydraulic gradients. Geophysics, 65(2): 408-420. https://doi.org/10.1190/1.1444735
[61] Zhu, J., Nolte, A.M., Jacobs, N., Ye, M. (2020). Using machine learning to identify karst sinkholes from LiDAR-derived topographic depressions in the Bluegrass Region of Kentucky. Journal of Hydrology, 588: 125049. https://doi.org/10.1016/j.jhydrol.2020.125049
[62] Oliveti, I., Cardarelli, E. (2019). Self-potential data inversion for environmental and hydrogeological investigations. Pure and Applied Geophysics, 176(8): 3607-3628. https://doi.org/10.1007/s00024-019-02155-x