Muammar H. Attaee
© 2022 IIETA. This article is published by IIETA and is licensed under the CC BY 4.0 license (http://creativecommons.org/licenses/by/4.0/).
OPEN ACCESS
The effect of vegetation cover (VC), in addition to environmental changes, is one of the most critical aspects affecting the erosion of the soil of river banks. Therefore, this paper investigated the influence of vegetation cover (VC) on the erosion of Tigris River banks in Samarra City. The study was conducted with multiple monthly research periods (May, June, July, and August) during the summer of 2021for testing the soil erosion in twelve sites on Tigris River banks. A mini jet erosion test (mini JET) device was used in this work to reduce testing times, save energy, and provide a low cost method. At each site two JETs were conducted, one on a soil covered with vegetation and other on a bare soil. The monthly average values of the soil erodibility coefficient (kd), the critical shear stress (τc), and the percentage of VC (VC%) were computed for the soils with VC and the bare soils at each site. It was concluded that improvement of soil erodibility resistance could be achieved by the existence of VC due to an increase in soil organic matter (OM) content. It was noted that the kd had more decreasing with the existence of VC compared to the bare soils at the twelve sites, while the τc showed more increasing. It was also discovered that the lowest value of kd (= 0.4 cm3/N. s) occurred at a VC% of 32.2% at site no. 12. The findings of this study supported the results obtained from previous researches which studied the effect of VC on bare soils. Finally, the study recommended that the VC% on the Tigris River banks within Samarra City be more than 32.2% to reduce the erosion of river banks as well as to preserve the morphology of the river.
soil erodibility parameters, vegetation cover, mini jet device, Tigris River, Samara city
Establishment of vegetation is an effective biological strategy for erosion control. Bank erosion is a type of water erosion that has a number of negative consequences, including increased turbidity, degradation of river bank areas, and challenges created by silt deposited downstream. River bank erosion can be slowed down through the use of biological means in recognized sensitive portions.
Soil erosion is one of the most serious environmental issues in the world, incurring billions of dollars in damages each year and affecting long-term national economy. Mining processing, construction, smelting, road construction, and agricultural reclamation all have an impact on soil erosion because they decrease vegetation cover, increase runoff, and create erosion [1].
Bank erosion results in the destruction of fertile fields adjacent to rivers and the downstream transport of sediments by water flow [2]. Sediment transport from slopes to river systems is largely dependent on the presence/absence of vegetation in river beds, and this should be taken into consideration when assessing landscape degradation and/or recovery [3]. There has been a surge of interest recently in the influence of vegetation establishment on the soil's resilience to erosion. Elimination of vegetation diminishes the resilience of the river bank surface to erosion [4]. As a result, vegetation loss reduces soil resistance to erosion and augments runoff generation. The material eroded off banks enters rivers' water flows immediately, causing turbidity and a degradation of the water's quality [5, 6]. Bank erosion occurs when the shear tension of flowing water exceeds the resistance of the soil. The application of biological approaches to control erosion is a priority for erosion control programmes due to their compliance with the environment and cost savings (by establishing a connection between vegetation and hydrologic processes) [7, 8]. Additionally, riverbanks are ideal locations for native plant establishment, which increases soil resistance to scouring by water [9, 10].
The application of vegetation techniques is an effective way to prevent soil erosion caused by water since vegetation is a key factor that impacts soil erosion [11]. The combined impacts of leaves, stems, roots, and litter allow plants to intercept rainfall, diminish erosion effects, and control surface runoff, thus completing the role of water management [12]. The activity of plant leaf tissue in intercepting rainwater reduces effective rainfall on a slope and the impact of erosion on the surfaces. Furthermore, plant leaves and stems may efficiently reduce the kinetic energy of raindrops and distribute a large raindrop into a small drop of water, resulting in less energy sprayed on the soil [13]. Physical characteristics of soil, such as soil strength, structural stability, and aggregate stability, all of which are related to soil erodibility, can be enhanced by vegetation root development. Furthermore, the roots can boost the capacity of soil infiltration, contributing in improvement of soil quality. Furthermore, vegetation has a significant impact on soil erosion due to its ability to alter hydraulic parameters as well as runoff and sediment yield conditions [14].
According to Le Bissonnais & and Arrouays [15], increased vegetation cover results in an increase in organic matter. Soil erodibility increases when organic carbon content declines, reducing infiltration and possibly causing erosion through increased runoff.
The significance of cryptogams (a form of vegetation cover) in runoff and erosion control was investigated by Gaskin and Gardner [16]. The stated advantage of cryptogams in minimizing soil erosion by water in semi-arid environments is particularly relevant for this study. As a result, cryptogams appear to provide a comparable level of protection against runoff and raindrop erosion to the soil surface as weed cover. The application of weed and cryptogam cover had been recommended to protect the soil surface from rainfall kinetic energy and surface water detention.
Langhans et al. [17] showed that the microorganisms such as algae form a vegetative cover have filamentous growth forms leading to bind soil particles together. These filaments secrete sticky polysaccharide sheaths surrounding their cells, which help to bind soil particles together.
Issa et al. [18] investigated the structural stability of soils and found that microorganisms like blue algae may have the potential to agglomerate soil particles. The protective role of algae cover is mostly due to soil aggregation, which is aided by polysaccharide exudates and algae filaments physical bonding. These have an impact on erodibility and give significant erosion resistance. Two types of vegetation cover were investigated by Hashim et al. [1] (blue algae and green algae). Throughout the observation period, dead algae attached to and bonded soil particles together, contributing to soil stability and increasing moisture and nutrient retention before decomposition.
Briaud et al. [19] pioneered the concept of classifying soil erosion according to soil type. They categorized the erosion of different types of soils depending on the relation between the shear stress of soil and the rate of erosion.
The goal of this research is to discover out how the soil erodibility parameters (erodibility coefficient, kd, and critical shear stress, τc) of Tigris River banks in Samarra City, and the fact that recovery of vegetation cover is primarily target for reducing soil erodibility at that reach of Tigris River in Samarra City.
The erosion rate of cohesive stream banks is frequently calculated employing the excess shear stress equation [20-22], which is stated as follows:
$\varepsilon_{r}=k_{d}\left(\tau-\tau_{c}\right)^{a}$ (1)
where [23]:
$\mathcal{\varepsilon}_{r}$: Erosion rate (cm/s),
kd: Erodibility coefficient (cm3/ (N.s)),
$a$: Empirical exponent commonly assumed to be unity,
τ: Average boundary shear stress (N/m2),
τc: Critical shear stress (N/m2).
Also, the submerged jet erosion test (JET) was designed for both in situ and laboratory measurements of these parameters [24].
“Vegetation has a considerable influence on the surface and mass stability of slopes. Both the type of vegetation and the manner by which the slope degrades have an effect on the stabilizing or protective effects of vegetation. The protective effects of woody vegetation on mass stability range from mechanical reinforcement and restraint provided by the roots and stems to changes in the slope hydrology caused by soil moisture extraction via evapotranspiration. Slope vegetation loss or removal might result in increased erosion rates or more frequent slope failure. Numerous field and laboratory studies published in the technical literature can convincingly prove this cause and effect relationship.” [25].
The banks of Tigris River characterize as productive places for agriculture in many Iraqi lands because of the fertility of soil and the vicinity of water [26, 27]. Referencing to the previous studies, the existence of vegetation cover on the river banks is considered beneficial from an economic point of view and in terms of preserving the morphology of the river. Therefore, it is necessity to preserve the natural vegetation, beneficial and environmentally harmless, found on Tigris River banks, and to aim for growing vegetation sending back beneficial economics and preserving the morphology of Tigris River.
3.1 Mini JET device
a. Mini JET device
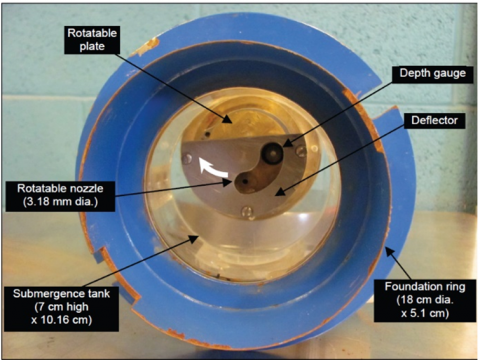
b. Rotatable of the device
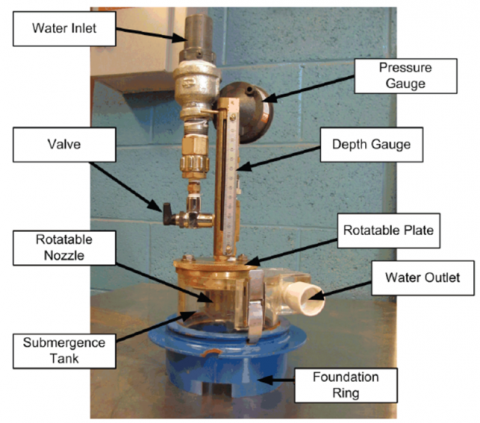
Figure 1. Mini JET device
This investigation utilized the laboratory submerged micro JET apparatus depicted in Figure 1, which was recently designed by Hanson [28]. It is a new miniaturized version of Hanson and Hunt's original JET gadget [29]. The employed device is smaller and lighter than the original (975 cm3 and 4.2 kg) (28130 cm3 and 12.6 kg). As a result, it can be handled more simply in the field as well as in the laboratory. In comparison to the original JET device, the employed device requires less water and labour in the field to deliver the appropriate volume of water. Pressure gauge, exit and intake water, depth gauge, rotatable plate (depth gauge and nozzle), submergence tank, foundation ring, valve, and hoses comprise this equipment.
An Adjustable head tank is utilized to get the desired water pressure. Scour measurements are taken with the depth gauge. The nozzle on the rotating plate measures 3.18 mm in diameter. This rotatable plate is employed to keep water out of the soil sample at the start of the test and at multiple scour depth readings throughout the test run. The submergence tank measures 70 mm in height, 101.6 mm in diameter, and has a wall thickness of 6.4 mm. The submergence tank does not have a top opening, and the rotatable plate and depth gauge are mounted on the tank's top. When utilized in the field, the foundation ring is 180 mm in diameter and is driven 51 mm into the soil.
3.2 Study area and soil characteristics
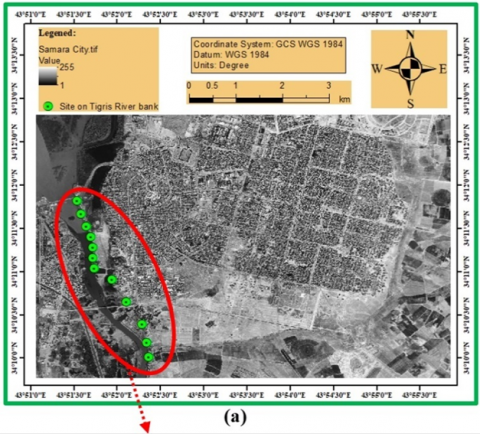
Samarra is an Iraqi city. It is located on the east bank of the Tigris River (Figure 2 (a)), of about 125 km to the north of Baghdad City, in Salahuddin Governorate. Samarra City's principal supply of drinking water is the Tigris River. This city's climate is classified as arid to semiarid, with hot summers and freezing winters. In the current study, twelve sites on Tigris River banks within Samarra City were chosen, as shown in Figure 2 (a and b), to determine the effect of vegetation cover on soil erodibility parameters (kd and τc) of Tigris River banks within this city. The coordinates of these sites and the distances between them were shown in Table 1.
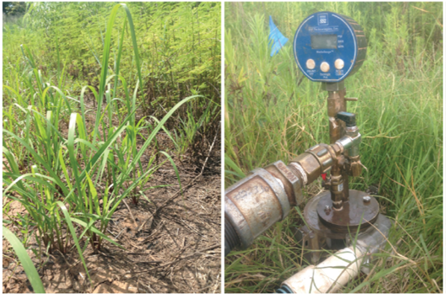
The vegetation cover in the twelve sites was found approximately in a blue-green colour as shown in Figure 3. It is also noted that this colour is approximately predominant one wherever VC founded on banks of Tigris River within Samarra City.
Table 1. Locations of twelve sites on Tigris River bank within Samarra City
|
Site no. |
Coordinates |
Distance (m) |
|
|
Longitude |
Latitude |
||
|
1 |
34° 11' 50" N |
43° 51' 33" E |
|
|
2 |
34° 11' 39" N |
43° 51' 36" E |
291.110 |
|
3 |
34° 11' 32" N |
43° 51' 40" E |
289.939 |
|
4 |
34° 11' 24" N |
43° 51' 44" E |
230.523 |
|
5 |
34° 11' 17" N |
43° 51' 44" E |
234.020 |
|
6 |
34° 11' 10" N |
43° 51' 44" E |
223.209 |
|
7 |
34° 11' 03" N |
43° 51' 44" E |
222.247 |
|
8 |
34° 10' 56" N |
43° 51' 58" E |
388.555 |
|
9 |
34° 10' 38" N |
43° 52' 05" E |
552938 |
|
10 |
34° 10' 23" N |
43° 52' 16" E |
545.651 |
|
11 |
34° 10' 12" N |
43° 52' 20" E |
407.980 |
|
12 |
34° 10' 02" N |
43° 52' 23" E |
312.703 |
|
|
|
|
Ʃ = 3698.875 m= 3.7 km |
Figure 2. Distribution of twelve sites plotting on satellite image of Samarra City (0.0011 cm error)
3.3 Field procedure and sampling
In the current work, twelve pairs of JETs (24 tests) were conducted in twelve sites (Figure 2 and Table 1) on Tigris River banks in Samarra City to compare the soil erodibility parameters between the soils with VC and the bare soils. At each site, the mini JET device was used to conduct two JETs side by side on the soil with VC and the bare soil (Figure 4). Then, a cylinder of 5 cm diameter and 5 cm depth was used to collect two soil samples from the covered and the bare soils at each site (24 soil samples). The JETs sets and the soil samples sets were conducted monthly (May, June, July, and August) during the summer of 2021.
A constant water pressure head of 90 cm for all tests was desirably set. Hence, a constant head tank with a surface approximately 60 cm above the employed device's outflow was used to maintain the water pressure head of 90 cm during the tests. To conduct the test on vegetation-covered soil, the foundation ring of the mini JET device was positioned slightly off centre of the plant stems to guarantee the impinging jet made contact with the soil and roots rather than the stem. Before the test, vegetation stems were trimmed to roughly 1 cm above the soil surface. After detaching the device from the foundation ring, any remaining water was allowed to drain and infiltrate until the scour hole was entirely dry and the foundation ring was removed. Using an Excell spreadsheet tool provided by Daly et al. [30] and the Blaisdell et al. [31] solution, the data from the employed device were utilized to derive kd and τc. If the scour depth was greater than 15 mm in the first two 15 second time intervals, the data were removed from the analysis assuming that the scour depth measurements were for loosened soil created during the insertion of the foundation ring for these in situ soils [32].
Figure 3. In situ vegetation cover at Tigris River banks within Samarra City
Figure 4. Site of field JET (using mini-JET device) with side-by-side soil covered with vegetation and bare soil
The soil samples were collected from the ground around the scour hole for the test on the soil with VC and the bare soil. The soil samples (24 samples) were taken to determine the physical and the chemical characteristics of soil according to the ASTM standards. For all monthly tests in all sites, the physical and chemical characteristics of the soils with VC were found with very close convergent values and also the same very close convergence was found for the bare soil. Therefore, the monthly (4 months) and spatial (12 sites) average tests values for the soils with VC and also for the bare soils were considered to be extended along Tigris River banks within Samarra City as shown in Table 2. Hence, the overall classification of the soil of Tigris River banks in the study area was to be as sandy clay loam according to the United States Department of Agriculture (USDA).
Table 2. Monthly and spatially average values of some physical and chemical characteristics of soil of Tigris River banks in Samarra City
|
Soil characteristics* |
Units |
Soil with VC |
Bare soil |
|
OM |
% |
2.6 |
1.8 |
|
Sand |
% |
53.2 |
53.2 |
|
Silt |
% |
10 |
10 |
|
Clay |
% |
36.8 |
36.8 |
|
Soil texture |
Sandy clayey loam |
||
3.4 Analytical methods of JET
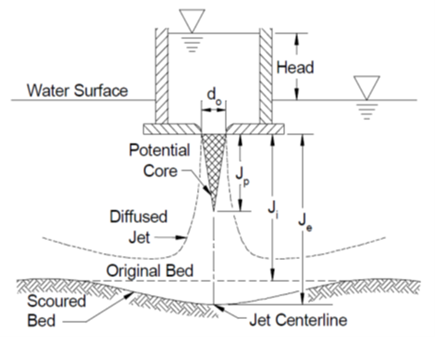
Hanson and Cook [23] calculated the maximum average shear stress along the jet impingement zone boundary $\left(\tau_{j}\right)$ as follows (Figure 5):
Figure 5. Schematic presentation of JET device [23]
$\tau_{j}=\tau_{o}\left(\frac{J_{p}}{J}\right)^{2}$ (2)
where:
$\tau_{o}=C_{f} \rho_{w} U_{o}^{2}$ (3)
and:
$U_{o}=C \sqrt{2 g h}$ (4)
also,
$J_{p}=C_{d} d_{o}$ (5)
$\left\{\begin{array}{c}C_{f}=0.00416 \\ C_{d}=6.3\end{array}\right.$ (6)
where:
$\tau_{o}$: Maximum shear stress due to the jet velocity at the nozzle (N/m2);
Cf: Coefficient of friction;
$U_{o}$: Jet velocity (m/s);
C: discharge coefficient; Al-Madhhachi et al. [28] indicated C values ranging from 0.70 to 0.75 for the mini JET;
h: Pressure head (m);
do: Nozzle diameter (cm);
J: Scour depth (cm);
Jp: Potential core length from jet origin (cm);
Ji: Jet nozzle height (initial jet orifice height);
Je: Equilibrium scour depth.
Also, should be note:
Notes
$J_{p}=6 d_{o}$ (7)
Hence, according to Eq. (2):
As mentioned in the field procedure (Section 3.3), the Excel spreadsheet tool provided by Daly et al. [30] using the Jp developed by the Blaisdell et al. [31] and Eq. (2) were used to determine τc and kd..
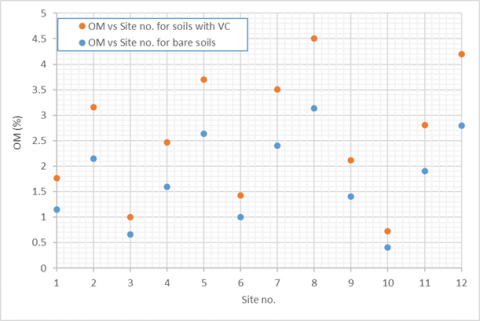
Any physical, chemical, or biological cover can improve the soil erosion resistance if the kd is reduced and the τc is increased [33, 34]. The final results of the current study showed that the presence of VC on the soils of the Tigris River banks within Samarra City reduced soil erosion compared to soils that were bare. The major reason was attributed to the increase in OM content in the soils with VC compared to the bare soils as shown in Figure 6. It was noted that the monthly average values of kd and OM for the soils of Tigris River banks with VC at the twelve sites showed a more significant decrease in kd with an increase in OM content compared to the bare soils at those sites, as shown in Figure 7. On the other hand, the monthly average values of τc and OM for the soils with VC in the twelve sites on the Tigris River banks showed a greater increase in τc with an increase in OM content compared to the bare soils at those sites, as shown in Figure 8.
Then, referring to Figures 6 through 8, it was clearly showed that the two significant sites were 8 and 10. These two sites had the extreme values as shown in Table 3. Commonly, the detection data were referred to that the increase in OM content led to improve soil erodibility parameters of Tigris River banks taking into the physical and chemical characteristics of soil at the sites.
Figure 6. Monthly average values of OM content for the soils with VC and the bare soils at twelve sites on Tigris River banks in Samarra City
Figure 7. Relation between the monthly average values of kd and OM content for the soils with VC and the bare soils at twelve sites on Tigris River banks in Samarra City
Table 3. Monthly average values of OM, kd, and τcat site no. 8 and site no. 10 (significant sites)
|
Site no. |
Soil surface |
OM (%) |
Increase in OM |
kd (cm3/N.s) |
Decrease in kd |
τc (N/m2) |
Increase in τc |
|
8 |
with VC |
4.5 |
$=\left(1-\frac{3.1}{4.5}\right) \times 100 \cong 31 \%$ |
0.4 |
$=\left(1-\frac{0.4}{2}\right) \times 100=80 \%$ |
4.2 |
$=\left(1-\frac{2.7}{4.2}\right) \times 100 \cong 36$ |
|
Bare |
3.1 |
2 |
2.7 |
||||
|
10 |
with VC |
0.7 |
$=\left(1-\frac{0.4}{0.7}\right) \times 100 \cong 43$ |
3.8 |
$=\left(1-\frac{3.8}{5.1}\right) \times 100 \cong 26 \%$ |
0.8 |
$=\left(1-\frac{0.2}{0.8}\right) \times 100=75$ |
|
Bare |
0.4 |
5.1 |
0.2 |
Figure 8. Relation between the monthly average values of τc and OM content for the soils with VC and the bare soils at twelve sites on Tigris River banks in Samarra City
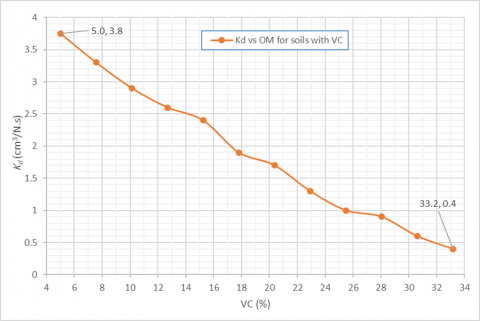
Figure 9. Relation between the monthly average values of kd and VC% for the soils with VC at twelve sites on Tigris River banks in Samarra City
Hence, it is concluded that the findings of the current study agree with those obtained by Hashim et al. [1], which showed an increase in OM content led to soil protection from water erosion. Finally, this study assessed the soil erosion at the twelve sites on the Tigris River banks within Samarra City with respect to the percentage of cover of vegetation (VC%) at those sites. The VC% was approximately evaluated with respect to the bare soil at each site. Figure 9 illustrations the relationship between the monthly average values of kd and VC% at the twelve sites on the Tigris River banks in Samarra City. It was noted that the minimum value of kd was equal to 0.4 cm3/N. s, corresponding to a VC% of 32.2%. Therefore, it was recommended to have vegetation cover of more than 32.2% on the Tigris River banks within Samarra City to reduce soil erosion at the banks of the river as well as preserve the morphology of the river.
The purpose of the current study was to determine the influence of vegetation cover (VC) on the erosion of the banks of the Tigris River in Samarra City. Throughout the summer of 2021, the study tested soil erosion in twelve places along the Tigris River banks using multiple monthly research periods (May, June, July, and August). This work utilized a micro jet erosion test (mini JET) apparatus to shorten testing periods, conserve energy, and give a low-cost technique. Two JETs were done at each site, one on vegetation-covered soil and one on bare soil. Accordingly, it can conclude the below points:
|
a |
empirical exponent commonly assumed to be unity |
|
C |
discharge coefficient; Al-Madhhachi et al. [28] indicated C values ranging from 0.70 to 0.75 for the mini JET |
|
Cf |
Coefficient of friction |
|
do |
nozzle diameter (cm) |
|
h |
pressure head (m) |
|
JET |
jet erosion test |
|
J |
scour depth (cm) |
|
Je |
equilibrium scour depth |
|
Ji |
Jet nozzle height (initial jet orifice height) |
|
Jp |
potential core length from jet origin (cm) |
|
kd |
erodibility coefficient (cm3/ (N.s)) |
|
OM |
organic matter content (%) |
|
Uo |
jet velocity (m/s) |
|
Greek symbols |
|
|
$\varepsilon_{r}$ |
erosion rate (cm/s) |
|
τ |
average boundary shear stress (N/m2) |
|
τc |
critical shear stress (N/m2) |
|
$\tau_{o}$ |
maximum shear stress due to the jet velocity at the nozzle (N/m2) |
[1] Hashim, Z.E., Al-Madhhachi, A.S.T., Alzubaidi, L.A. (2020). Behavior of soil erodibility parameters due to biological soil crusts using jet erosion tests. Ecological Engineering, 153: 105903. https://doi.org/10.1016/j.ecoleng.2020.105903
[2] Lawler, D.M., Couperthwaite, J., Bull, L.J., Harris, N.M. (1997). Bank erosion events and processes in the Upper Severn basin. Hydrology and Earth System Sciences, 1(3): 523-534. https://doi.org/10.5194/hess-1-523-1997
[3] Molina, A., Govers, G., Putte, A., Poesen, J., Vanacker, V. (2009). Assessing the reduction of the hydrological connectivity of gully systems through vegetation restoration: Field experiments and numerical modelling. Hydrology and Earth System Sciences, 13(10): 1823-1836.
[4] Rosso, R., Rulli, M.C., Bocchiola, D. (2007). Transient catchment hydrology after wildfires in a Mediterranean basin: runoff, sediment and woody debris. Hydrology and Earth System Sciences, 11(1): 125-140. https://doi.org/10.5194/hess-11-125-2007
[5] Broadmeadow, S., Nisbet, T.R. (2004). The effects of riparian forest management on the freshwater environment: A literature review of best management practice. Hydrology and Earth System Sciences, 8(3): 286-305.
[6] Hively, W.D., Gérard-Marchant, P., Steenhuis, T.S. (2006). Distributed hydrological modeling of total dissolved phosphorus transport in an agricultural landscape, part II: dissolved phosphorus transport. Hydrology and Earth System Sciences, 10(2): 263-276. https://doi.org/10.5194/hess-10-263-2006
[7] Ludwig, J.A., Wilcox, B.P., Breshears, D.D., Tongway, D.J., Imeson, A.C. (2005). Vegetation patches and runoff–erosion as interacting ecohydrological processes in semiarid landscapes. Ecology, 86(2): 288-297.
[8] Saco, P.M., Willgoose, G.R., Hancock, G.R. (2007). Eco-geomorphology of banded vegetation patterns in arid and semi-arid regions. Hydrology and Earth System Sciences, 11(6): 1717-1730. https://doi.org/10.5194/hess-11-1717-2007
[9] Lee, K.H., Burke, E.J., Shuttleworth, W., Harlow, R. (2002). Influence of vegetation on SMOS mission retrievals. Hydrology and Earth System Sciences, 6(2): 153-166. https://doi.org/10.5194/hess-6-153-2002
[10] Lee, K.H., Chawn Harlow, R., Burke, E.J., Shuttleworth, W.J. (2002). Application of a plane-stratified emission model to predict the effects of vegetation in passive microwave radiometry. Hydrology and Earth System Sciences, 6(2): 139-152. https://doi.org/10.5194/hess-6-139-2002
[11] Wang, Q., Zhao, G., Liu, Y., Zhang, P., Chai, J. (2016). Effects of vegetation types on yield of surface runoff and sediment, loss of nitrogen and phosphorus along loess slope land. Transactions of the Chinese Society of Agricultural Engineering, 32(14): 195-201.
[12] Li, H.T., Zhao, Y.J., Li, G.R., Hu, X.S., Lu, H.J., Zhu, H.L. (2014). Experimental research on slope protection with vegetation under situ rainfall simulation in cold and arid environment of loess area. Research of Soil & Water Conservation, 6: 304-311.
[13] Gao, Y., Zhu, B., Zhou, P., Tang, J.L., Wang, T., Miao, C.Y. (2009). Effects of vegetation cover on phosphorus loss from a hillslope cropland of purple soil under simulated rainfall: A case study in China. Nutrient Cycling in Agroecosystems, 85(3): 263-273. https://doi.org/10.1007/s10705-009-9265-8
[14] Zhang, Q., Wang, Z., Wang, D., Liu, J. (2017). Advances in researches of the effects of grassland vegetation on soil erosion in loess plateau. Advances in Earth Science, 32(10): 1093-1101. https://doi.org/10.11867/j.issn.1001-8166.2017.10.1093
[15] Le Bissonnais, Y., Arrouays, D. (1997). Aggregate stability and assessment of soil crustability and erodibility: II. Application to humic loamy soils with various organic carbon contents. European Journal of Soil Science, 48(1): 39-48. https://doi.org/10.1111/j.1365-2389.1997.tb00183.x
[16] Gaskin, S., Gardner, R. (2001). The role of cryptogams in runoff and erosion control on Bariland in the Nepal middle hills of the Southern Himalaya. Earth Surface Processes and Landforms: The Journal of the British Geomorphological Research Group, 26(12): 1303-1315. https://doi.org/10.1002/esp.277
[17] Langhans, T.M., Storm, C., Schwabe, A. (2009). Community assembly of biological soil crusts of different successional stages in a temperate sand ecosystem, as assessed by direct determination and enrichment techniques. Microbial Ecology, 58(2): 394-407. https://doi.org/10.1007/s00248-009-9532-x
[18] Issa, O.M., Le Bissonnais, Y., Défarge, C., Trichet, J. (2001). Role of a cyanobacterial cover on structural stability of sandy soils in the Sahelian part of western Niger. Geoderma, 101(3-4): 15-30. https://doi.org/10.1016/S0016-7061(00)00093-8
[19] Briaud, J.L., Govindasamy, A.V., Shafii, I. (2017). Erosion charts for selected geomaterials. Journal of Geotechnical and Geoenvironmental Engineering, 143(10): 04017072. https://doi.org/10.1061/(ASCE)GT.1943-5606.0001771
[20] Partheniades, E. (1965). Erosion and deposition of cohesive soils. Journal of the Hydraulics Division, 91(1): 105-139. https://doi.org/10.1061/JYCEAJ.0001165
[21] Hanson, G.J. (1990). Surface erodibility of earthen channels at high stresses part II-developing an in situ testing device. Transactions of the ASAE, 33(1): 132-0137. https://doi.org/10.13031/2013.31306
[22] Hanson, G.J. (1990). Surface erodibility of earthen channels at high stresses part I-open channel testing. Transactions of the ASAE, 33(1): 127-0131. https://doi.org/10.13031/2013.31305
[23] Hanson, G.J., Cook, K.R. (2004). Apparatus, test procedures, and analytical methods to measure soil erodibility in situ. Applied Engineering in Agriculture, 20(4): 455.
[24] Hanson, G.J., Simon, A. (2001). Erodibility of cohesive streambeds in the loess area of the midwestern USA. Hydrological Processes, 15(1): 23-38. https://doi.org/10.1002/hyp.149
[25] Gray, D.H., Sotir, R.B. (1996). Biotechnical and Soil Bioengineering Slope Stabilization: A Practical Guide for Erosion Control. John Wiley & Sons.
[26] Al-Taee, M.M.H., Al-Adilli, A., Sivakugan, N. (2017). Analysis of behaviour of soil surrounding around Baghdad Metro at Baghdad City Center during and after tunnel excavation using the finite element method. International Journal of Civil Engineering and Technology (IJCIET), 8(10): 31-40.
[27] Al-Taee, M.H., Al-Adili, A., Sivakugan, N. (2017). Predicting movement of soil around Baghdad Metro Under buildings loads using three dimensional numerical simulation. International Journal of Civil Engineering and Technology (IJCIET), 8(10): 1096-1106.
[28] Al-Madhhachi, A.S.T., Hanson, G.J., Fox, G.A., Tyagi, A.K., Bulut, R. (2013). Measuring soil erodibility using a laboratory “mini” JET. Transactions of the ASABE, 56(3): 901-910.
[29] Hanson, G.J., Hunt, S.L. (2007). Lessons learned using laboratory JET method to measure soil erodibility of compacted soils. Applied Engineering in Agriculture, 23(3): 305-312.
[30] Daly, E.R., Fox, G.A., Miller, R.B., Al-Madhhachi, A.S.T. (2013). A scour depth approach for deriving erodibility parameters from jet erosion tests. Transactions of the ASABE, 56(6): 1343-1351.
[31] Blaisdell, F.W., Clayton L.A., Hebaus, C.G. (1981). Ultimate dimension of local scour. J. Hydraulics Div. ASCE, 107(3): 327-337.
[32] McNichol, B., Kassa, K., Fox, G., Miller, R., Guertault, L. (2017). Erodibility parameters derived from jet and flume erosion tests on root- permeated soils. Journal of Contemporary Water Research & Education, 160: 119-131. https://doi.org/10.1111/j.1936-704X.2017.03244.x
[33] Al-Adili, A., Al-Taee, M. (2020). Three-dimensional numerical model of Baghdad metro with fluctuation of ground water. In IOP Conference Series: Materials Science and Engineering, 737(1): 012151. https://doi.org/10.1088/1757-899X/737/1/012151
[34] Qamar, A.M., Khan, R.U., Alsuhibany, S.A. (2021). Large-scale bibliometric analysis of coronavirus. International Journal of Design & Nature and Ecodynamics, 16(5): 531-541. https://doi.org/10.18280/ijdne.160507