Alexis Cordovés García* | Alexis Cordovés Rodríguez | Karla Tatiana Núñez Buñay | Arlys M. Lastre Aleaga | Leandro L. Lorente-Leyva
© 2022 IIETA. This article is published by IIETA and is licensed under the CC BY 4.0 license (http://creativecommons.org/licenses/by/4.0/).
OPEN ACCESS
The aim of this research is to determine the average fluid velocity values and the average total pressure at the outlet of the ventilation system conduit for the drying, by air impulsion, of pineapples in packing plants, in order to ensure the required humidity level of the crown for its proper packaging. The CAD model of the air conduction was obtained in Solidworks and Computational Fluid Dynamics (CFD) techniques were applied to simulate the performance of the ventilation system. Air was indicated as the type of fluid, and an internal analysis of the pipe with roughness Rz = 3.2 μm. As a computational domain, the pipeline was established, from the connection to the fan to the outlet diffuser. As boundary conditions were established; a W and Z Manufacturing regenerative fan at the inlet of the flow pipe 618,439 m3/h, and at the outlet of the pipe the value of atmospheric pressure. As a result of the simulation, an average velocity value at the diffuser outlet of 127.294 m/s was obtained, higher than the required 96.06 m/s. An average total pressure value of 111718.73 Pa was obtained in the conduit suitable for the proposed purposes. For the conveyor belt, it is recommended to use, in each row of pineapples, the simulated fan with a simple diffuser with a rectangular section of 1 x 20 cm, or a regenerative fan with a flow of 1248.77 m3/h and a diffuser with two-outlet bifurcation.
CAD/CAE integration, ventilation system, computational fluid dynamics (CFD), pineapple drying, packing plants
The application of Computer Aided Design (CAD) tools in high-performance engineering design is nowadays indispensable. The creation of geometrical models of mechanical components and installations and the subsequent evaluation, allows the analysis and simulation of their performance prior to manufacturing, and finally to obtain all the necessary design documentation [1-3].
CAD tools range from vector-based applications and 2-dimensional (2D) drawing systems to 3-dimensional (3D) modeling using solid and parametric surface modelers. It is basically a database of geometric entities (points, lines, arcs, splines, surfaces and solids) that can be operated through a graphical interface to obtain the final design.
In the CAD system database, the properties of each graphic entity are defined: layer, line style, color, thickness, geometric definition, etc., which enable product and process modeling. In addition, extended databases with other properties such as cost, material, etc., can be associated to the entities or sets of these, allowing CAD systems to be linked to management and production systems. From the geometric models obtained, construction drawings can be generated with the dimensional description and annotations for the delivery of the specific technical documentation of each project [4, 5].
Within the framework of CAD systems, concepts such as Simultaneous or Concurrent Engineering and Design for Manufacture (DFM) have been developed, where design is considered as the first phase in the manufacture of the item [6]. In this way, the final design of the product is reached after the completion of several cycles with the successive stages of modeling, simulation, design calculations and analysis with the application of the Finite Element Method (FEM) and the creation of virtual prototypes from the application of virtual reality techniques, where the simulation of the real behavior of the article is achieved using computer-based prototypes [3]. All this work is accomplished with increased design accuracy and quality and a drastic reduction in processing time over traditional design systems [7, 8].
The SolidWorks Premium CAD system has tools for computational fluid dynamics analysis, as part of the SolidWorks Simulation module, which is a valuable aid during the evaluation of the design of hydraulic and pneumatic systems, and in the decision-making process, for the improvement of the final quality of the product, based on the application of numerical methods in engineering [9, 10].
Computational Fluid Dynamics (CFD) is increasingly used in the diagnosis of performance problems in fluid handling systems or to achieve improvements in their design. For example, the development of related work to the analysis of air flow patterns in internal combustion engines [11, 12], in the simulation of the aerodynamic behavior of truck air deflectors and their influence on fuel consumption [13], in the design of racing car spoilers [14], the study of the flow pattern in nozzles [15], the study of fluid dynamic behavior in cyclone separators to determine performance and pressure drop [16], among other important aerodynamic studies.
In the present research, CFD analysis of pineapple drying by air impulsion was carried out, with the purpose of verifying the values of speed and pressure delivered by the ventilation system, which were experimentally determined under production conditions in packing plants of this product for export. Through the application of CAD/CAE techniques, the variant analysis of the system to be used was carried out, which contributed to the decision-making process on which flow impulse equipment to select for the ventilation system, as well as the geometric and dimensional characteristics of the air conduction.
2.1 Pineapple packing process in packing plants
The packing process is part of the post-harvest treatment of pineapple and includes a set of stages from receipt of the fruit at the plant, cleaning and purification, processing in line, to packing, palletizing and storage for distribution to the final destination. The equipment installed in the plant should ensure the continuous flow of fruit in the production line and contribute to achieving the highest possible overall efficiency in the process.
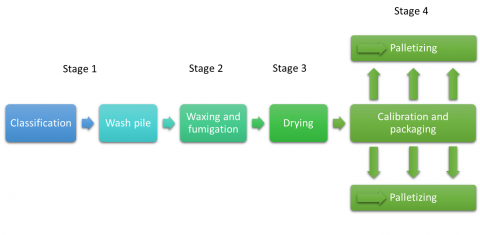
Figure 1 shows the production flow diagram in pineapple packing plants. The process begins with a Classification section where the fruits that do not meet the requirements for export are separated. Convenient fruits are conveyed to the Wash pile, both sections make up Stage 1 of the process. Stage 2 includes Waxing and fumigation and is intended to improve the appearance of the fruit and extend its commercial life. Stage 3 corresponds to the Drying of the pineapple in which it must reach 7% humidity for proper packaging. Stage 4 comprises the Calibration and packaging in which the product is separated according to its weight in the caliber to which it corresponds and is placed in the container or box, finally the boxes are placed on Pallets to be taken to the conservation chambers and subsequent transportation to the marketing destination.
Figure 1. Diagram of the production flow in pineapple packing plants
2.1.1 Pineapple drying process
Pineapples coming out of the washing pile and subsequent waxing have high humidity, which should be reduced so as not to cause dripping. Excessive humidity deteriorates the cardboard packaging that contains them when packed, while insufficient humidity conspires against the shelf life of the fruit until it is placed on the market. The objective of the pineapple drying process is to ensure a moisture content that satisfies both requirements; the specialized literature recommends 7% moisture content of the product before packaging [17].
The drying system in packing plants combines draining with suction or forced ventilation, which presupposes the extension of the path of the waxed pineapple on the conveyor to promote its draining and the corresponding recovery of the distilled wax by means of a collector located under the conveyor. The ventilation system normally uses axial or centrifugal fans with different performance in the process.
The preliminary analysis of the solutions implemented for pineapple drying in the packing companies under study suggests that, in general, the process runs with irregularities, without a study of the best design practices used in the leading companies of the sector at international level, which has led to inefficient drying systems with excessive noise levels in accordance with current occupational health and safety standards.
A suitable drying system presupposes the following advantages for the company:
Reduction of the drying time of the pineapple and the reduction of its path in the packing line.
Better utilization of the available space in the packing plant with the possibility of achieving an increase in productivity.
Improved production conditions and reduced noise levels on the line.
2.2 Determination of air flow and velocity required for pineapple drying in the production line of packing plants
To determine the magnitude of air flow and velocity to ensure adequate drying of the pineapple, field tests were carried out on a sample of pineapples subjected to a variable speed regime with a centrifugal fan whose characteristics are shown in Table 1.
Table 1. Characteristics of impulsion tests with a 50 mm outlet diameter fan and 1.8 m long hose
|
Fan (BLOWER) Output 50 mm |
|
Independent motor: 3 HP (2.25 kW) |
|
Motor angular speed: 3480 rpm |
|
Amperage: 32 A |
|
Flexible hose: |
|
Diameter: 50 mm |
|
Length: 1.8 m |
|
Motor pulley diameter: 152.4 mm (6") |
|
Fan pulley diameter: 76.2 mm (3") |
|
Drive ratio: 2 |
|
Fan Angular Speed: 6990 rpm |
|
Noise Level: 63 dB |
|
Efficiency: Medium-High |
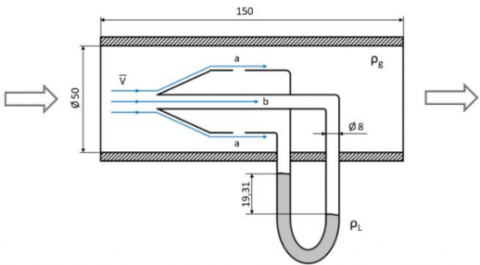
A Pitot tube (see Figure 2) was constructed to determine the total or stagnation pressure (pt) and the static pressure (ps) reached. Bernoulli's equation relates both pressure values to the fluid velocity for a known air density (ρ) (see Eq. (1)). The cylinder of inner diameter Ø50 mm in Figure 2, constitutes the pipe through which the fluid flows whose magnitude and velocity must be determined, the velocity vector indicates the direction and sense followed by the fluid. The Ø8 mm bent tube inserted inside the pipe contains a certain volume of liquid (water). One end of the tube is placed directly in the central zone of the flow stream inside the pipe to avoid the influence of losses occurring in the layers adjacent to the inner wall of the pipe. The other end of the pipe is connected at the end of the pipeline to an orifice section where the static pressure (ps) in the pipe is measured.
When the fan is off, by the law of communicating vessels, the level of the liquid column inside the pipe is equalized. When the fan is turned on, the air driven inside the pipe penetrates the end of the pipe located inside it and pushes the liquid column due to the action of the dynamic pressure (pd), which depends on the fluid velocity and its density, this raises the total pressure (pt) inside the pipe, until the velocity at the point of the pipe mouth becomes zero and no more fluid enters from the pipe. At this instant, a maximum height differential of the column "h" between the ends of the liquid column has been reached, which represents the average value of the measurements made, corresponding to 19.31 mm (see Table 2).
Legend:
$\bar{V}:$ fluid velocity vector
$\rho_{g}:$ Gas density
$\rho_{l}:$ Liquid density
Figure 2. Pitot tube used to measure the air velocity at the duct outlet
Table 2. Liquid column height measurements made with the Pitot tube
|
Water column measurements |
||
|
Measurements |
Value |
Unit |
|
1 |
19.3 |
cm |
|
2 |
19.5 |
cm |
|
3 |
19.4 |
cm |
|
4 |
19.3 |
cm |
|
5 |
18.9 |
cm |
|
6 |
19.5 |
cm |
|
7 |
18.8 |
cm |
|
8 |
19.5 |
cm |
|
9 |
19.3 |
cm |
|
10 |
19.4 |
cm |
|
11 |
19.5 |
cm |
|
12 |
19.3 |
cm |
|
13 |
19.4 |
cm |
|
14 |
19.3 |
cm |
|
15 |
19.3 |
cm |
|
Average Value |
19.31 |
cm |
As expressed, a Pitot tube allows two pressures to be measured simultaneously, the total pressure (pt) and the static pressure (ps). Bernoulli's equation shows that:
$p t=p s+\left(\frac{\rho v^{2}}{2}\right)$ (1)
where:
pt: total or stagnation pressure (Pa);
ps: static pressure (Pa);
ρ: air density (kg/m3);
v: fluid velocity (m/s).
As can be deduced from Eq. (1), the differential pressure measured through the Pitot tube is proportional to the square of the fluid velocity:
$v=\sqrt{\frac{2\left(p_{t}-p_{s}\right)}{\rho}}$ (2)
The dynamic pressure is determined as:
$p d=p t-p s=\frac{1}{2} \rho v^{2}=\rho_{L} \cdot g \cdot h$ (3)
where:
pd: dynamic pressure (Pa);
$\rho_{L}$: density of the liquid (kg/m3);
g : gravity (9.8 m/s2);
h : height differential of the liquid column (m).
Substituting Eq. (3) into Eq. (2) we have:
$v=\sqrt{\frac{2 \cdot \rho_{L} \cdot g \cdot h}{\rho}}$ (4)
2.2.1 Calculation of the speed value at the duct outlet
Eq. (4) is used to determine the value of the fluid velocity:
Datos:
$\rho_{L}$: 997 kg/m3;
g: 9.8 m/s2;
h: 0.1931 m;
ρ: 0.92 kg/m3 (air density at an altitude of 625 meters above sea level and a temperature of 21°).
$v=\sqrt{\frac{2.997 * 9,8 * 0,1931}{0,92}}$
$v=64.04 \mathrm{~m} / \mathrm{s}$
2.2.2 Calculation of the magnitude of the flow delivered by the fan at the duct outlet
To calculate the magnitude of the flow at the duct outlet, the well-known continuity equation is used (Eq. (5)).
$Q=v \cdot A$ (5)
where:
Q: Magnitude of the air flow at the fan outlet.
A: Cross-sectional area of the fan outlet (for an outlet diameter of 50 mm).
$Q=64,04 \frac{\mathrm{m}}{\mathrm{s}} \cdot 0,00196 \mathrm{~m}^{2}$
$Q=0,1257 \frac{\mathrm{m}^{3}}{\mathrm{~s}}=452,44 \mathrm{~m}^{3} / \mathrm{h}=266,30 \mathrm{cfm}$
Finally, the values of air speed and air flow at the fan outlet will be affected by a safety coefficient of magnitude equal to 1.5, to ensure that the drying installation satisfactorily fulfills its service destination under real production conditions, by not considering factors such as the drying temperature at the fan outlet, the temperature and humidity distribution in the room, the magnitude and direction of the air flow outside the pipeline, the path of the pineapple conveyor that may or may not favor the runoff of the pineapple before being deposited in the container, the reduction in the functional efficiency of mechanical ventilation equipment, among other factors.
$v=64,04^{*} 1,5=96,06 \mathrm{~m} / \mathrm{s}$
$Q=452,44 * 1,5=678,66 \mathrm{~m}^{3} / \mathrm{h}=399,45 \mathrm{cfm}$
2.3 Design of the pineapple drying installation in packing plants, using CAD tools
Due to the conditions of high CAD/CAE integration provided by the current versions of SolidWorks, it was decided to design a prototype of a pineapple drying plant in packing plants, and the CFD simulation, using the SolidWorks Simulation module. The geometrical and dimensional characteristics of the CAD model of the installation are described below.
2.3.1 Design of the air ducting system from the fan to the conveyor belt
The installation of the drying system will follow the scheme shown in Figure 3. As can be seen, the pineapples placed on the conveyor (1) will follow the path indicated by the arrow the fan (2) will be installed at the base of the structure, and the conduction pipe of the impelled air (3) should follow a trajectory with a wide radius to reduce losses along the conduction of the fluid until it reaches the diffuser (4).
Figure 3. General diagram of the fan installation and air ducting system
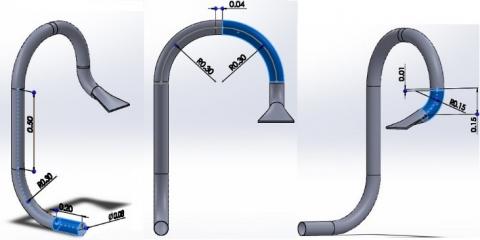
Initially the ducting will exit in a trajectory parallel to the floor level. At 20 cm from the fan outlet, it will curve upwards following a 90° angle with a radius of curvature of 30 cm (see Figure 4). Then a vertical section of 50 cm length is extended to start a new curvature of 30 cm radius, a small straight section of only 4 cm is conceived, which has the function of serving as an adapter between the curves located at both ends, with the possibility of adjusting its dimension according to the need of the belt conveyor dimensions of the company in which it is going to be used.
The next curved section also has a radius of 30 cm, then an adapter is located between curves of only 1 cm in length, to start a truncated elbow of radius 15 cm and a height between the extreme axes of 15 cm.
Figure 4. Design of the air conduction from the fan to the conveyor belt
Next, a diffuser is placed, which is a transformation from circular to rectangular section to direct the flow more effectively along the crown of the pineapple (see Figure 5). The diffuser starts from a circular section with an internal diameter of 7.62 cm to an internal rectangular section of 1 x 20 cm, sufficient to cover the full width of the crown.
The cones are conveyed over the conveyor in two parallel rows (see Figure 6), the diffuser design presented here covers only one row. The use of two ventilation systems, one for each row, can be considered, or in another case, a single system with a double diffuser, one air outlet direction for each row of pinecones, can be used. In this case, the use of a fan with double flow capacity should be considered for an adequate drying of the pineapple crown in both rows.
Figure 5. Diffuser design located at the end of the air duct
Figure 6. Distribution of pineapples in two rows on the conveyor
2.4 Proposed fan to meet pineapple drying requirements
Based on the determined values of air flow and velocity that satisfy the product drying requirements in the production line of the packing plants under study, an analysis of possible ventilation units that, due to their characteristics, could satisfy these requirements was carried out (see Table 3).
Table 3. Possible ventilation units for the air supply system
|
ID |
Supplier |
Fan Type |
Characteristics |
|
01 |
USA (Republic Manufacturing) |
Regenerative |
HRB 800, 8.5 HP, 3F (220 V) 60Hz, 3500 rpm, 599,751 m3/h - 353 CFM, Discharge 2.5”, Noise Level: 78 dB |
|
02 |
Centrifugal |
RB 1200 HC, 15 HP, 3F (220-440 V), 3500 rpm, 700 m3/h - 412 CFM, Discharge 4”, Noise Level: 82 dB |
|
|
03 |
USA (W and Z Manufacturing) |
Regenerative |
GHBH 010361R8 11,5 HP 3F (480 V) 618.439 m3/h -364 CFM, Discharge 2.5” |
|
04 |
Regenerative |
GHBH 017361R9 19,4 HP 3F (480 V) 1248,77 m3/h -735 CFM, Discharge 4” |
2.5 Simulation of the air flow in the drying plant with CAD/CAE tools
Once the 3D model of the air duct and the diffuser for drying the pineapple was obtained, the dynamic simulation (CFD) of the behavior of the air flow driven by the fan was carried out for the conditions determined in the research. For this purpose, the SolidWorks Simulation module, which is embedded in the CAD package, was used.
2.5.1 Initial conditions for the CAE simulation of driving
The initial conditions for the study were assigned:
Working units (SI), type of fluid (air), type of analysis (internal pipe), value of the surface roughness of the pipeline (Rz = 3.2 smooth pipe).
As "Boundary Condition" at the inlet of the pipeline, the fan was located with a flow rate of 618,439 m3/h = 364 cfm. Atmospheric pressure was defined as the boundary condition at the outlet of the duct.
The following were defined as surface goals: the average fluid velocity values and the average total pressure at which the fluid is delivered at the outlet of the pipeline.
Additional Physical Calculation Options:
Heat Transfer Analysis: Heat conduction in solids: Off
Flow Type: Laminar and turbulent
Time-Dependent Analysis: Off
Gravity: Off
Radiation:
Humidity: Off
Default Wall Roughness: 3.2 micrometer
Figure 7 shows the successful completion dialog of the project solver. As can be seen, 5559 control volumes were generated in conduction, reaching model convergence in 108 iterations.
Figure 7. Solver output for the simulation of the project: Pineapple drying
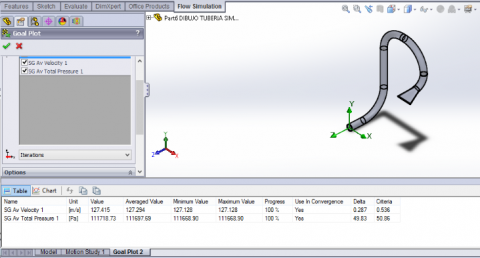
Figure 8. Result of the execution of the Solver for the project simulation: Pineapple drying
Figure 8 shows the results achieved for average fluid velocity and average total pressure, which are the study objectives.
Figure 9 (a) and (b) shows the simulation of the velocity target in driving while the simulation of the pressure target is shown in Figure 10 (a) and (b).
(a)
(b)
Figure 9. Simulation result for the "speed" driving objective
(a)
(b)
Figure 10. Simulation result for the "pressure" driving objective
The following results were obtained when performing the CAE simulation of the CAD model of the ventilation-driven air conduction system for pineapple drying in packing plants:
The simulated fan was the one indicated in Table 3 with ID 03, from W and Z Manufacturing, which delivers a flow rate of 618,439 m3/h - 364 cfm.
The average fluid velocity value obtained in the pipeline during the simulation was 127.294 m/s, while the maximum velocity value of 139.707 m/s was obtained at the outlet of the diffuser (see Figure 9).
An average value of the total pressure in the pipeline of 111697.69 Pa was obtained. The lowest pressure value was reached at the outlet of the diffuser equal to 101224.02 Pa (see Figure 10).
The values of velocity and pressure shown correspond to a single air duct, and a cylindrical to rectangular diffuser, with a cross section at the outlet of 1 x 20 cm.
Of the fans under study, the W and Z Manufacturing regenerative fan with ID 03 in Table 3, provides adequate flow and velocity values to satisfy the pineapple drying requirements. The velocity value of 139.707 m/s obtained at the outlet of the diffuser during the CFD simulation is higher than the required value of 96.06 m/s determined in section 2.2. The fan flow value of 618.439 m3/h - 364 cfm, according to the manufacturer's data, is slightly lower (less than 10%) than the required 678.66 m3/h - 399.45 cfm, also determined in section 2.2.
The values of velocity and flow determined in the field tests were affected by a safety coefficient equal to 1.5, considering the production conditions of the packing plants and their possible variations, by not considering factors such as the drying temperature at the fan outlet, the temperature and humidity distribution in the room, the magnitude and direction of the air flow outside the pipeline, the path of the pineapple conveyor that may or may not favor the runoff of the pineapple before being deposited in the container, the reduction in the functional efficiency of mechanical ventilation equipment, among other factors.
The results obtained are satisfactory for the diffuser outlet dimensions of 1 x 20 cm, which suggests its use in the drying of a single row of pineapple. For the drying of two rows, it will be required the location of two ventilation installations of similar characteristics, one for each row, or the use of the fan with ID 04, of 1248.77 m3/h - 735 cfm, with a bifurcation of two diffusers of equal section of 1 x 20 cm.
Figures 9 (a) and (b), and 10 (a) and (b) show a fluid path corresponding to a laminar regime, with flow lines that hardly intersect, which presupposes a design of the duct with the shape and dimensions of the cross sections of the duct and diffuser suitable for the magnitude of the flow supplied by the fan, with the delivery of satisfactory speed and pressure values at the outlet of the diffuser.
A high-pressure value is appreciated practically in the whole duct with an average value of 111697.69 Pa (see Figure 8), decreasing the pressure value when approaching the end of the diffuser since it discharges directly to the production line (atmospheric pressure 101 325 Pa).
The study carried out in pineapple packing plants for export reveals dissatisfaction due to inadequacies in the drying system, related to the excessive time the pineapples remain in the line for draining, the low efficiency of the ventilation system used and the excessive noise level with possible affectations to production personnel.
The objective of the study was to determine the values of speed and pressure at the outlet of the ventilation system, to ensure the required moisture level in the fruit, and thus avoid damage to the package due to excess moisture and, on the other hand, prolong its conservation until its arrival at the final destination.
Through the research carried out, an air velocity value of 64.04 m/s was obtained at the outlet of the fan, which was adequate to reach the required humidity of the fruit; this value was determined by applying Bernoulli's equation according to the value of the average height of the liquid column obtained in a Pitot tube. For safety reasons this value was affected by a coefficient equal to 1.5 when considering possible variations of the specific conditions in the production plants, which led to a requirement of 96.06 m/s with a flow of 678.66 m3/h - 399.45 cfm.
The CAD model of the air handling system was obtained, and the CAE analysis was performed through CFD fluid dynamic simulation using the SolidWork Flow Simulations tool. The performance of a fan delivering 618,439 m3/h - 364 cfm was simulated to satisfy the drying requirements in a row of pineapple on the conveyor belt, which leads to recommend the installation of two of these units to cover both rows and to use a fan delivering a flow of 1248.77 m3/h - 735 with a bifurcation of two diffusers.
The research reinforced the CFD approach as a robust tool for the evaluation and simulation of fluid flow in pipeline ventilation systems and the influence of the geometry of the duct elements on the results obtained by ensuring a laminar regime of the fluid.
The proposed ventilation units (Regenerative Ventilators), generate a noise level lower than 85 dB, which is allowed by the current environmental standards for 8-hour working days.
[1] Feliciano, Y.A., Varela, C.A.T., Guativas, J.A.V., Lorente-Leyva, L.L., Peluffo-Ordóñez, D.H. (2021). Evaluation of working temperature in wind turbine bearings by simulation of lubricant level. International Journal of Design & Nature and Ecodynamics, 16(1): 99-104. https://doi.org/10.18280/ijdne.160113
[2] Castaño-Urrego, C.A., Lopez-Perez, J.R., Forero-Rubiano, R.A., Tlapanco-Rios, E.I. (2020). Método de comparación de resultados de modelado CAD-CAE contra probetas de ensayo destructivo. Acta Universitaria, 30: 1-16. https://doi.org/10.15174/au.2020.2668
[3] Sánchez, F.J., Fernández de la Puente Sarriá, A., Llorente-Geniz, J. (2004). Técnicas de Prototipado Rápido. In: XVI Congreso Internacional de Ingeniería Gráfica. Sevilla, España: Universidad de Sevilla. https://idus.us.es/handle/11441/32352.
[4] Rougier, T., Bouvy, Q., Casalino, D., Appelbaum, J., Kleinclaus, C. (2015). Design of quieter landing gears through lattice-Boltzmann CFD simulations. In 21st AIAA/CEAS Aeroacoustics Conference, Dallas Texas, USA. https://doi.org/10.2514/6.2015-3259
[5] Wong, S.F., Ho, W.I., Vong, A., Lam, C.C., Kam, W.S. (2012). Ergonomic design knowledge base in web-enabled quick response system. In 2012 International Symposium on Management of Technology (ISMOT), pp. 22-26. https://doi.org/10.1109/ISMOT.2012.6679421
[6] Chang, P.C., Lin, J.J., Dzan, W.Y. (2012). Forecasting of manufacturing cost in mobile phone products by case-based reasoning and artificial neural network models. Journal of Intelligent Manufacturing, 21(4): 1-15. https://doi.org/10.1007/s10845-010-0390-7
[7] Croccolo, D., De Agostinis, M., Vincenzi, N. (2011) Structural analysis of an articulated urban bus chassis via FEM: A methodology applied to a case study. Strojniški vestnik-Journal of Mechanical Engineering, 57(11): 799-809. https://doi.org/10.5545/sv-jme.2011.077
[8] Campos-Vázquez, A., Escamilla-Navarro, A., González-López, A. (2013) Análisis experimental-numérico de la plantilla para el conformado plástico mediante embutido de una abrazadera metálica. Científica, 17(2): 67-76. https://www.redalyc.org/articulo.oa?id=61429574002.
[9] SolidWorks. (2021). Technical Reference SolidWorks Flow Simulation. https://www.cati.com/wp-content/uploads/swflow2021-technical-reference.pdf.
[10] SolidWorks. (2020). Tutorials SolidWorks Flow Simulation 2020. https://www.academia.edu/41718721/Solidworks_flow_simulation_2020_tutorial.
[11] Santos, C., Pérez, L., Duarte Forero, J. (2020). CFD analysis of the airflow behavior in the intake system of a low-displacement diesel engine. INGECUC, 16(2): 285-298. http://doi.org/10.17981/ingecuc.16.2.2020.23
[12] Lozano Antón, A. (2018). Cálculo CFD de la turbulencia en toberas de inyección mediante simulaciones les para su aplicación al cálculo de la atomización primaria mediante DNS. Universitat Politècnica de València. https://riunet.upv.es/handle/10251/106782.
[13] Guanuche, D.J., Chimbo, Á.R., Pantoja, E.H., Martínez, P.D. (2021). Estudio aerodinámico de un deflector de aire para camiones y su influencia en el consumo de combustible. Revista Científica y Tecnológica UPSE, 8(1): 25-31. https://doi.org/10.26423/rctu.v8i1.557
[14] Samaniego, G.F., Guerrero, B., Antamba, J.F. (2021). Aerodynamic design analysis of a racing airfoil by computational fluid dynamic (CFD) numerical simulations. Información Tecnológica, 32(2): 19-28. https://dx.doi.org/10.4067/S0718-07642021000200019
[15] Tolentino-Masgo, S.L.B., Parco, M.A., Caraballo, S., Lacruz, L., Marcano, V., Ferreira, J., Mírez, J. (2021). Análisis numérico del comportamiento del flujo en la sección de la garganta de una tobera cónica experimental. Enfoque UTE, 12(1): 12-28. https://doi.org/10.29019/enfoqueute.676
[16] Solano Timana, W.E. (2021). Análisis fluidinámico con software CFD del ciclón de entrada simple de separación de gas para determinar el rendimiento y perdída de carga. Tesis en Grado Académico de Bachiller en Ingeniería Mecánica Eléctrica. Universidad Señor de Sipán, Perú. https://repositorio.uss.edu.pe/handle/20.500.12802/8083.
[17] Arias Velázquez, C.J., Toledo Hevia, J. (2007). Manual de manejo postcosecha de frutas tropicales (Papaya, Piña, Plátano, Cítricos). https://www.fao.org/documents/card/es/c/3898a360-5ae8-4f64-a648-96ef9630b73b/.