Rabi Rabi* | Lhoucine Oufni | El-Houcine Youssoufi | Cherki Satif | Khamiss Cheikh | Youssef Errami
© 2021 IIETA. This article is published by IIETA and is licensed under the CC BY 4.0 license (http://creativecommons.org/licenses/by/4.0/).
OPEN ACCESS
Human exposure to radon indoor air has become a great concern. Using the Computational Fluid Dynamics (CFD) technique, we investigated the efficiency of ventilation systems for indoor radon reduction. In order to optimize ventilation for the bathroom, we applied the impact of ventilation on radon distribution in the bathroom, in which we characterized airflow and radon level regulation in the ventilated space. Radon Scout Plus is used to measure radon amounts in the bathroom as part of the validation process. The simulation results are consistent with the experimental outcomes. In addition, the annual effective dosage of Radon in the bathroom has been calculated.
radon, ventilation, bathroom, computational fluid dynamics (CFD), effective dose
Radon is a radioactive gas that is absorbed in sewage that can penetrate buildings by tap water or showers [1-3]. The water is the most significant cause of radon indoors [4-6]. However, the calculation of the distribution of radon concentrations arising from water is critical for determining the radiation exposure obtained from radon inhalation and its indoor progeny.
Computational Fluid Dynamics (CFD) has recently been used as a useful method for simulating 222Rn and 220Rn properties in indoor air [7-10]. Furthermore, research into the prediction of indoor radon distribution and the performance of ventilation systems in reducing radon [11-13]. But, a major limitation of these studies is not taking into account the influence the exhalation of radon from the water.
The action of radon in the bathroom was predicted using computational fluid dynamics (CFD) numerical simulation in this analysis. Furthermore, the radon source from the water flush was measured and used as an input parameter in the CFD simulation. The experimental validation was affected by measuring the concentration of radon in the bathroom using Radon Scout Plus detector. Moreover, the annual effective dose from radon in the bathroom was studied.
2.1 Physical model
In this paper, we modeled three ventilation design schemes as shown in Figure 1.
• In Scheme A, air was supplied through a hole in the door and exhausted through a hole in the bathroom ceiling.
• In Scheme B, both the supply and exhaust openings are found in the bathroom ceiling.
• In Scheme C, the vertical exhaust opening was situated on the wall next to the toilet seat, while the supply opening was located on the bathroom ceiling.
The size of the bathroom in this study was 1.5 m × 2.5 m × 1.4 m (length-X, height-Y, and width-Z). In both of the cases tested, the exhaust and supply openings in Scheme A and Scheme B were 0.3 m×0.3 m, which was the size of an ordinary opening. The size of the supply and exhaust opening in Scheme C was 0.5 m×0.5 m and 1.8 m×0.2 m (height-Y and width-Z), respectively.
Figure 1. Three ventilation schemes in the bathroom (1-supply air opening (0.3 m × 0.3 m), 2-exhaust air opening (0.3 m × 0.3 m), 3-door, 4-toilet tank, 5-supply air opening (0.5 m × 0.5 m), 6-verticle exhaust air opening (1.8 m × 0.2 m)
2.2 Mathematic model
In the turbulent regime, the in-bathroom airflow was believed to be steady-state, Newtonian, and noncompressible. The temperature in the bathroom was thought to be steady and consistent. The mass and momentum conservation equations using these considerations are written [14]:
$\frac{\partial \mathrm{u}}{\partial \mathrm{x}}+\frac{\partial \mathrm{v}}{\partial \mathrm{y}}+\frac{\partial \mathrm{w}}{\partial \mathrm{z}}=0$ (1)
$u \frac{\partial u}{\partial x}+v \frac{\partial u}{\partial y}+w \frac{\partial u}{\partial z}=-\frac{1}{\rho} \frac{\partial p}{\partial x}+v\left(\frac{\partial^{2} u}{\partial^{2} x}+\frac{\partial^{2} u}{\partial^{2} y}+\frac{\partial^{2} u}{\partial^{2} z}\right)$ (2)
$\mathrm{u} \frac{\partial \mathrm{v}}{\partial \mathrm{x}}+\mathrm{v} \frac{\partial \mathrm{v}}{\partial \mathrm{y}}+\mathrm{w} \frac{\partial \mathrm{v}}{\partial \mathrm{z}}=-\frac{1}{\rho} \frac{\partial \mathrm{p}}{\partial \mathrm{y}}+v\left(\frac{\partial^{2} \mathrm{v}}{\partial^{2} \mathrm{x}}+\frac{\partial^{2} \mathrm{v}}{\partial^{2} \mathrm{y}}+\frac{\partial^{2} \mathrm{v}}{\partial^{2} \mathrm{z}}\right)$ (3)
$\mathrm{u} \frac{\partial \mathrm{w}}{\partial \mathrm{x}}+\mathrm{v} \frac{\partial \mathrm{w}}{\partial \mathrm{y}}+\mathrm{w} \frac{\partial \mathrm{w}}{\partial \mathrm{z}}=-\frac{1}{\rho} \frac{\partial \mathrm{p}}{\partial \mathrm{z}}+v\left(\frac{\partial^{2} \mathrm{w}}{\partial^{2} \mathrm{x}}+\frac{\partial^{2} \mathrm{w}}{\partial^{2} \mathrm{y}}+\frac{\partial^{2} \mathrm{w}}{\partial^{2} \mathrm{z}}\right)$ (4)
where: u, v and w are the Cartesian velocity components, p is the pressure, $\rho$ is mixture density $\left(\right.$ Air- $\left.^{222} \mathrm{Rn}\right), v=1.510^{-5} \mathrm{~m}^{2} \cdot \mathrm{s}^{-1}$ kinematic viscosity.
Dispersion of radon gas in the studied bathroom was simulated using the following equation [14]:
$\mathrm{u} \frac{\partial \mathrm{c}}{\partial \mathrm{x}}+\mathrm{v} \frac{\partial \mathrm{c}}{\partial \mathrm{y}}+\mathrm{w} \frac{\partial \mathrm{c}}{\partial \mathrm{z}}=\mathrm{D}\left(\frac{\partial^{2} \mathrm{c}}{\partial^{2} \mathrm{x}}+\frac{\partial^{2} \mathrm{c}}{\partial^{2} \mathrm{y}}+\frac{\partial^{2} \mathrm{c}}{\partial^{2} \mathrm{z}}\right)-\lambda \mathrm{c}$ (5)
where: c represents radon concentration in the bathroom $\left(\right.$ Bq. $\left.m^{-3}\right), D=1.210^{-5} \mathrm{~m}^{2} \cdot \mathrm{s}^{-1}$ is the radon diffusion coefficient [14], u, v and w are air flow velocity, $\lambda=2.110^{-6} \mathrm{~s}^{-1}$ is the radon decay constant.
3.1 Boundary conditions
In this modeling, a pressure boundary was used to reflect the airflow in the supply air opening in this simulation. At the exhaust opening, the velocity inlet boundary state was applied at seven levels: 0.0084 m.s-1, 0.084 m.s-1, 0.164 m.s-1, 0.328 m.s-1, 0.656 m.s-1, 0.98 m.s-1, 1.31 m.s-1, 1.64 m.s-1, 3.28 m. s-1, 4.92 m. s-1, which correspond to the air change rate of 0.5 h-1, 5 h-1, 10 h-1, 20 h-1, 40 h-1, 60 h-1, 80 h-1, 100 h-1, 200 h-1, 300 h-1, respectively. In addition, the radon source in the bathroom was thought to be the wall, the flush, the floor, and the ceiling. Solid-state nuclear monitor detectors (SSNTDs) were used to measure radon concentrations in the walls, floors, and ceilings, while detector AlphaGUARD was used to measure radon concentrations in the water. Table 1 shows the boundary conditions [12].
3.2 Numerical procedure
To simulate the radon distribution within the bathroom, the Fluent code was used, which is based on the Finite Volume Method (FVM). The relationship between velocity and pressure is determined using the SIMPLE algorithm, which is an iterative solution process. For both variables, the convergence of residuals is set to 10-6.
The radon level in the water flush was measured using the AlphaGUARD PQ2000 (Genitron Instruments, GmbH, Germany) and a suitable unit (Aqua Kit) [15]. After letting the water run for 5 minutes, a 20 mL sample was taken with vessels attached to the detector through the pump.
The following equation was used to determine the radon content in the water sample [16]:
$c_{\text {water }}=\frac{c_{\text {air }}\left(\frac{V_{\text {system }}-V_{\text {sample }}}{V_{\text {sample }}}-k\right)-c_{0}}{1000}$ (6)
where, $\mathrm{C}_{\text {water }}$ is radon concentration in a water sample (Bq.L-1), $\mathrm{C}_{\text {air }}$ is radon concentration in the measuring set-up after expelling the radon from the water indicated by AlphaGUARD (Bq.m-3), $\mathrm{c}_{0}$ is the background radon concentration measured just before sampling for an empty set-up (Bq.m-3), $V_{\text {system }}$ is the interior volume of the measurement set-up (mL), $\mathrm{V}_{\text {sample }}$ is the volume of the water sample (mL) and k is the diffusion coefficient which depends on the temperature of the water sample.
The final result is calculated by taking into consideration the value of the diffusion coefficient, which depends on the temperature [16]:
$\mathrm{k}=0.106+0.405 \mathrm{e}^{-0.052 \mathrm{~T}}$ (7)
Table 1. Boundary conditions and parameterswhere, k is the diffusion coefficient of radon; T is the temperature of water [°C].
|
Sample |
$\mathbf{A}_{c}\left({ }^{222} \mathrm{Rn}\right)$ (Bq.m-3) |
|
Plaster (ceiling) [12] |
150.60 |
|
Concrete (walls) [12] |
280.20 |
|
Marble (floor) [12] |
194.30 |
|
Water (flush) |
1031.80 |
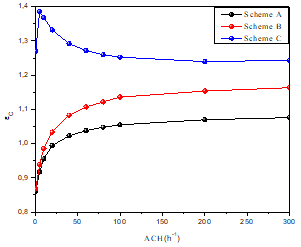
The cumulative radon delivery effectiveness $\varepsilon_{\mathrm{C}}$ offers a quantitative index relating to how the contaminant is spread in the bathroom. The below is an example of how to express this parameter:
$\varepsilon_{\mathrm{C}}=\frac{\mathrm{c}_{\text {outlet }}-\mathrm{c}_{\text {inlet }}}{\mathrm{c}_{\text {average }}-\mathrm{c}_{\text {inlet }}}$ (18)
where: $\mathrm{C}_{\text {outlet }}$ is the average concentration of radon at the outlet. C $_{\text {average }}$ is the average radon concentration of radon all over the inside of the bathroom. $\mathrm{C}_{\text {inlet }}$ is the average concentration of radon at the inlet.
6.1 Radon distribution
It is important to understand how the combination air-radon spreads about and distributes in the bathroom in order to remove radon concentration. Figure 2 depicts the flow pattern for the air velocity vectors as a function of air change rates ACH= 0.5, 10, 20, 40, 60, 80, 100, 200, and 300 h-1 for all three ventilation schemes previously mentioned.
Figure 2 shows that the ventilation system in Scheme C will transport radon a shorter distance to the outlet opening, while the ventilation systems in Schemes B and C will transport radon a longer distance, expanding their residence time inside the bathroom.
Figure 2. Air velocity vectors of bathroom central plane (Z = 0.70 m)
Table 2. Average radon concentration (Bq.m-3) for various air change rates
|
ACH (h-1) |
Average radon concentration (Bq.m-3) |
||
|
Schema A |
Schema B |
Schema C |
|
|
0.5 |
250.04 |
248.75 |
239.49 |
|
5 |
247.53 |
250.88 |
204.26 |
|
10 |
244.37 |
248.84 |
191.06 |
|
20 |
236.42 |
241.65 |
178.63 |
|
40 |
229.15 |
231.21 |
167.94 |
|
60 |
224.35 |
224.31 |
161.40 |
|
80 |
220.35 |
219.30 |
157.14 |
|
100 |
217.12 |
220.29 |
153.87 |
|
200 |
207.60 |
203.73 |
145.19 |
|
300 |
202.55 |
197.80 |
141.85 |
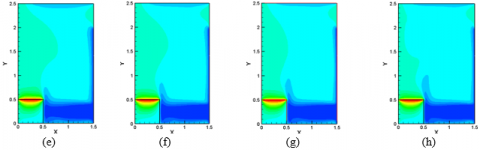
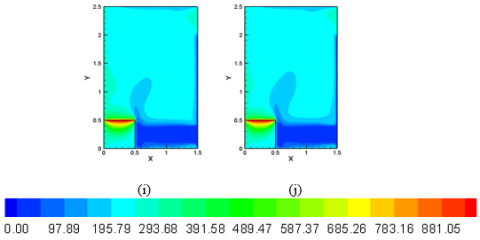
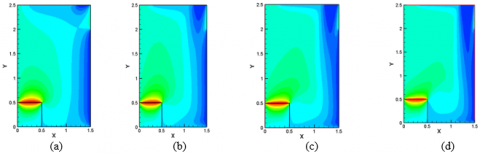
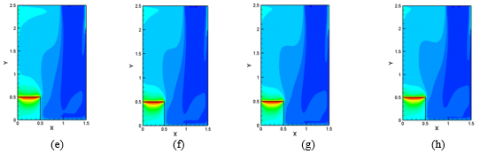
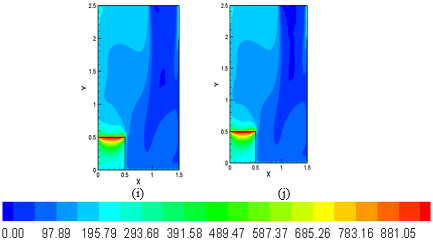
Figures 3, 4, and 5 show the contours of radon concentrations at plane (Z=0.7 m) at various air shift speeds. Because of the influence of air velocity, the radon concentration in Scheme A exceeds 300 Bq.m-3 inside the toilet, except near the air inlet (i.e., lower concentrations). The radon concentration is very low (100 Bq.m-3 or less) near the door in Scheme B, but rises to 500 Bq.m-3 near the toilet seat and much higher in the ventilation areas (e.g., over 600 Bq.m-3 at the height of 1.6 m in the rear). In most of the areas inside the bathroom for Scheme C, the radon concentration was under 200 Bq.m-3, with a few anomalies above the ventilation range, where the concentration was over 300 Bq.m-3. Furthermore, as compared to Scheme A and Scheme B, the radon concentration near the door was significantly lower in Scheme C.
Table 2 displays the total radon concentration in the bathroom as a result of air shift concentrations for the three schemes presented in this report. The radon concentration decreases steadily according to the ventilation for the three systems, as seen in this table. This explains that the ventilation flow has a significant impact on the radon concentration. Indeed, the increase in the ventilation flow promotes the transport and evacuation of radon.
6.2 Overall ventilation effectiveness for the removal of pollutants
The radon reduction effectiveness $\varepsilon_{\mathrm{C}}$, includes a numerical index of radon distribution within the bathroom; the higher the number, the more homogeneous the radon distribution. Since radon can be stratified into specific areas with elevated amounts, it can be difficult to observe the whole radon spectrum using only average concentration values, this air quality metric is very significant in building construction. Figure 6 shows the results of $\varepsilon_{\mathrm{C}}$, for the three schemes considered in this work, and for different air change rates.
Figure 6 shows that Scheme A gives the highest value of when the air shift frequencies (ACH = 300 h-1) are used. This behaviour suggests that air can be delivered at higher velocities to enhance the relationship between the clean air inlet and the radon concentration in the bathroom. Scheme B shows qualitatively similar behavior. The radon concentration distribution in Scheme C approaches a maximal value for ACH = 5 h-1 and then remains relatively stable. By evaluating Schemes, A, B, and C, it is clear that Scheme C has the highest radon distribution volume. As a result, it exhibits the highest efficiency in terms of air quality.
Figure 3. Contours of radon concentration (Bq.m-3) as a function of air change rate, for scheme A at symmetrical plane (Z = 0.70 m). (a ACH =0.5), (b ACH =5), (c ACH =10), (d ACH =20) and (e ACH =40), (f ACH =60), (g ACH =80), (h ACH =100), (i ACH =200) and (j ACH =300)
Figure 4. Contours of radon concentration (Bqm-3) as a function of air change rate, for scheme B at symmetrical plane (Z = 0.70 m). (a ACH =0.5), (b ACH =5), (c ACH =10), (d ACH =20) and (e ACH =40), (f ACH =60), (g ACH =80), (h ACH =100), (i ACH =200) and (j ACH =300)
Figure 5. Contours of radon concentration (Bqm-3) as a function of air change rate, for scheme C at symmetrical plane (Z = 0.70 m). (a ACH =0.5), (b ACH =5), (c ACH =10), (d ACH =20) and (e ACH =40), (f ACH =60), (g ACH =80), (h ACH =100), (i ACH =200) and (j ACH =300)
6.3 Experimental results
Figure 6. Overall ventilation effectiveness for the removal of radon pollutants in the bathroom for 0.5 < ACH< 300
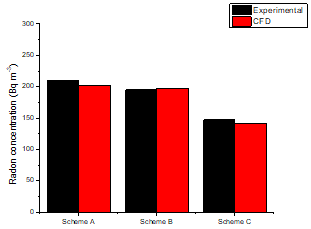
Figure 7. Comparison of CFD results with experimental measurements
Radon measurements were taken in each of the three ventilation schemes at a rate of 300 h-1 air transition. The radon detector Radon Scout Plus (SARAD, GmbH, Dresden, Germany) was mounted at 1.50 m above ground for the measurements. The outcomes are depicted in Figure 7. We note that the findings of the CFD simulation are within 4.25 percent of the experimental results. As a result, it appears that the CFD procedures used in this analysis will make accurate predictions of airflow characteristics and indoor radon concentration.
6.4 Estimation of annual effective dose
The annual effective dose (mSv.y-1.h-1 of exposure) from radon to the general population was also calculated using the formula below:
$\mathrm{E}=\mathrm{A}_{\mathrm{c}}\left({ }^{222} \mathrm{Rn}\right) . \mathrm{F} . \mathrm{t} . \mathrm{D}$ (9)
Table 3 indicates the total effective dosage received by individuals who were put in various schemes in the bathroom model (scheme A, scheme B, and scheme C), as seen in Figure 1. The annual successful doses obtained by individuals put in schemes A and B are greater than those received by those placed in scheme C, which is attributed to the fact that scheme C has the best air quality results. These effective dosage levels are lower than the ICRP suggested limit of 3–10 mSv.y-1.where, Ac(222Rn) is the radon activity or radon concentration in the shower air (Bq.m-3), F= 0.6 is the equilibrium factor between radon and its progeny in bathroom, t = 1 h.y-1 and D= 9.0.10-6 mSv. (Bq/m3.h)-1 is the dose conversion factor.
Table 3. Average radon concentration and annual effective doses (AED) calculated in the bathroom
|
Bathroom model |
Radon concentration (Bq. m-3) |
Effective dose (10-7 Sv.y-1.h-1 exposure) |
|
Scheme A |
210.00 |
11.34 |
|
Scheme B |
195.00 |
10.53 |
|
Scheme C |
147.00 |
7.93 |
We used CFD to simulate the distribution of radon concentration and air velocity in a bathroom in this analysis. We used the modeling findings to compare the effects of different bathroom ventilation designs on radon safety, and we found an optimum ventilation scheme that kept the radon concentration in the bathroom’s occupancy zone minimal. Based on the simulation results, we determine that scheme C (i.e., overhead air supply with rear-wall exhaust) is the best model for constructing a bathroom. Ventilation is a safe tool for radon dilution because it serves to improve indoor air quality while still lowering radon levels in the toilet.
[1] Rabi, R., Oufni, L., Cheikh, K., Youssoufi, E., Badry, H., Errami, Y. (2021). Modeling of radon and its short-lived decay products during showering: dose to adult members of the public. World Journal of Nuclear Science and Technology, 11(2): 84-99. https://doi.org/10.4236/wjnst.2021.112006
[2] Ouabi, H. (2009). Modeling of radon and its short-lived decay products emanating from tap water used inside a house: dose to adult members of the public. Appl. Radiat. Isot., 67(1): 115-121. https://doi.org/10.1016/j.apradiso.2008.07.010
[3] Rabi, R., Oufni, L., Youssoufi, E., Cheikh, K., Badry, H., Errami, Y. (2021). Modeling of the distribution of radon and its decay in a traditional hammam: Dose to adult members of the public. American Journal of Environmental Protection, 10(4): 12-21. http://www.sciencepublishinggroup.com/j/ajep
[4] Oufni, L., Misdaq, M.A., Amrane, M. (2005). Radon level and radon effective dose rate determination in Moroccan dwellings using SSNTDs. Radiat. Measur., 40(1): 118. https://doi.org/10.1016/j.radmeas.2005.02.007
[5] Amrane, M., Oufni, L., Misdaq, M.A. (2014). Attached and unattached fractions of short-lived radon decay products in outdoor environments: Effect on the human respiratory system. Radiat. Prot. Dosimetry, 162(3): 400-409. https://doi.org/10.1093/rpd/nct338
[6] Zhou, W., Iida, T., Moriizumi, J., Aoyagi, T., Takahashi, I. (2001). Simulation of the concentrations and distributions of indoor radon and thoron. Radiat. Prot. Dosimetry, 93(4): 357-367. https://doi.org/10.1093/oxfordjournals.rpd.a006448
[7] Akbari, K., Mahmoudi, J., Ghanbari, M. (2013). Influence of indoor air conditions on radon concentration in a detached house. J. Environ. Radioact., 116: 166. https://doi.org/10.1016/j.jenvrad.2012.08.013
[8] Rabi, R., Oufni, L. (2017). A theoretical investigation of the distribution of indoor radon concentrations. Indian J. Phys., 91: 471-479. https://doi.org/10.1007/s12648-016-0932-8
[9] Chauhan, N., Chauhan, R.P., Joshi, M., Agarwal, T.K., Aggarwal, P., Sahoo, B.K. (2014). Study of indoor radon distribution using measurements and CFD modeling. J. Environ. Radioact., 136: 105-111. https://doi.org/10.1016/j.jenvrad.2014.05.020
[10] de With, G., de Jong, P. (2011). CFD modelling of thoron and thoron progeny in the indoor environment. Radiat. Prot. Dosimetry, 145(2-3): 138-144. https://doi.org/10.1093/rpd/ncr056
[11] Rabi, R., Oufni, L. (2017). Study of radon dispersion in typical dwelling using CFD modeling combined with passive-active measurements. Radiat. Phys. Chem., 139: 40-48. https://doi.org/10.1016/j.radphyschem.2017.04.012
[12] Agarwal, T.K., Joshi, M., Sahoo, B.K., Kanse, S.D., Sapra, B.K. (2016). Effect of 220Rn gas concentration distribution on its transmission from a delay chamber: evolving a CFD-based uniformity index. Radiat. Prot. Dosimetry, 168(4): 546-552. https://doi.org/10.1093/rpd/ncv361
[13] Agarwal, T.K., Sahoo, B.K., Gaware, J.J., Joshi, M., Sapra, B.K. (2014). CFD based simulation of thoron (220Rn) concentration in a delay chamber for mitigation application. J. Environ. Radio., 136: 16-21. https://doi.org/10.1016/j.jenvrad.2014.05.003
[14] Correa, J.N., Paschuk, S.A., Schelin, H.R., Barbosa, L., Sadula, T., Matsuzaki, C.A. (2009). Measurements of radon concentraon level in drinking water at urban area of Criba (Brazil). Internaonal Nuclear Atlanc Conference INAC 2009, Rio.
[15] Rabi, R., Oufni, L. (2018). A theoretical and experimental investigation of spatial distribution of radon in a typical ventilated room. MAPAN-Journal of Metrology Society of India 33: 123-130. https://doi.org/10.1007/s12647-017-0238-0
[16] International Commission on Radiological Protection. (2016). Proceedings of the Third International Symposium on the System of Radiological Protection. Annals of the ICRP, 45(1).