Mfoniso Asuquo Enoh* | Richard Ebere Njoku | Esomchukwu Chinagorom Igbokwe
© 2021 IIETA. This article is published by IIETA and is licensed under the CC BY 4.0 license (http://creativecommons.org/licenses/by/4.0/).
OPEN ACCESS
Hydrocarbon micro – seepages are light hydrocarbon that cause oxidation – reduction reaction on the earth’s surface, resulting in alterations and anomalies such as red bed bleaching, ferrous iron enrichment and increase in the concentration of clay minerals and carbonate in overlying soils and sediments. Remote sensing has become a valuable tool in hydrocarbon micro – seepage studies and have been successfully used to interpret surface alterations and anomalies of minerals. In this study, Landsat 7 ETM+ remotely sensed data was utilized for interpreting the onshore hydrocarbon micro – seepage induced alterations zone in Ugwueme. Spectral enhancements techniques such as the principal component analysis (PCA), band ratio (BR) and false color composite (FCC) were adopted for delineating alteration zones. With Landsat 7 ETM+ band selection, and for PCA, the 1457PC3, 1345PC2 and 3457PC4 are the most suitable PC image for spectral enhancement of ferric iron, ferrous iron and clay minerals. Band ratio index such as (3/1), (7/5) and (2+5)/(3+4) also yields better enhancement for anomalous micro – seepage. The study shows that PCA, BR, FCC are good spectral enhancement techniques for interpreting hydrocarbon micro – seepage alterations in overlying soils and sediments.
alterations, anomalies, band ratio, hydrocarbon micro – seepage, Landsat 7 ETM+ data, principal component and spectral enhancement
Hydrocarbon oil and gas that leak from the earth’s underground impermeable reservoirs often seep [1]. These reservoirs leak because of their imperfectly sealed nature and under high pressure, leaking hydrocarbon oil and gas migrate vertically or nearly vertically through various network of geological faults, fractures and bedding plane to shallow level and finally emerge at the earth’s surface as hydrocarbon micro-seepage [2-4]. The vertical migration of hydrocarbon micro-seepage along geological faults, fractures and weak bedding plane is known as Chimney Effect [5].
Hydrocarbon micro–seepage has been recognized as one of the world most devastating catastrophe. Its effect has led to decrease biodiversity and alterations to soil, sediments and vegetation [6]. Researchers such as Van der Meer et al. [7] opined that micro-seepage alters the chemical and mineralogical composition of the soil and sediments, resulting in a change in its color, structure, radioactive, electric and magnetic properties. Micro–seepage increases the concentration of surface hydrocarbon gases (methane, ethane and propane) leading to mineralogical alterations and geo-botanical anomalies [8, 9]. Increase concentration of hydrocarbon gases displace the normal soil atmosphere, decrease soil oxygen and changes the soil chemistry. Microbes play an important role in the oxidation of hydrocarbon micro-seepage [9]. The activities of these microbes give rise to the various surface manifestations of oil and gas seepages, which aid in the formation of surface oxidation-reduction zones, which is responsible for the development of the different hydrocarbon-induced chemical and mineralogical changes [9, 10]. Noomen [11] reported that the long term effect of hydrocarbon micro-seepage can influence the Eh and ph of the soil, thereby affecting its mineral stability, chemical reactivity, and with changes in their spectral reflectance [12, 13].
The traditional methods for investigating hydrocarbon micro-seepage are very expensive, destructive and time consuming, with its application only observed in the field, and around drilling areas [14]. Remote Sensing has proven to be an important tool for studying hydrocarbon micro – seepage. When compared with the traditional methods, remote sensing is less expensive, non-destructive and rapid in mapping hydrocarbon seepage prone zones [9, 11, 12, 14,]. Landsat multispectral data is an excellent sensor for interpreting anomalous areas and delineating zones of mineral alterations. Landsat sensors have bands (b1, b2, b3, b4, b5 and b7) and are widely used for delineation of hydrocarbon micro – seepage prone zones viz spectral enhancement techniques such as Principal Component Analysis (PCA), Band Ratio (BR) and False Color Composite (FCC). In this study, Landsat 7 ETM+ data is utilized to interpret areas of hydrocarbon micro-seepage in the onshore environment of Ugwueme, South-Eastern Nigeria. The PCA, BR and FCC were the various spectral enhancement techniques adopted for the study. Here, the anomalous areas of red bed bleaching, clay and carbonate alterations were interpreted with enhanced remotely sensed satellite data.
Hydrocarbon micro - seepage are expressions found on the earth’s surface due to variation in sub-surface pressure, which force oil and gas to migrate vertically or nearly vertically from impermeable sealed reservoir through underlying rocks to shallow surface and then emerge on the earth’s surface [2, 3, 15]. Vertical migration of hydrocarbon oil and gas through the subsurface strata is controlled by some processes such as effusion, diffusion and solution [12].
Hydrocarbon micro-seepage are categorized as low weight hydrocarbon (mostly methane, ethane, propane and other gases including carbon dioxide) and higher weight hydrocarbon [7, 16]. Low weight hydrocarbon often adopts a vertical or nearly vertical routes in which oil and gas flow through while the higher weight hydrocarbon migrate along cracks, joints and faults within the earth’s underlying rocks. Methane (CH4) and Carbon-dioxide (CO2) are the most common gases associated with hydrocarbon micro-seepage. CH4 and CO2 have an absorption, found between 0.4-2.5 µm in the electromagnetic spectrum, which diffuse into the near surface, producing local pollution and global warming [2].
The long term effect of petroleum oil and gas, produces an anomaly redox zones which has led to the development of various arrays of chemical, physical, botanical, microbiological and micrological changes in soils and sediments [10, 17]. Shi et al., [5] noted that among these changes, remote sensing can only be used to study the following alterations:
Bleaching of red beds: Hydrocarbon micro-seepage often bleach or decolorized the red beds coating of ferric iron bearing oxide, and then reduces its ferrous material [8, 9].
Clay mineral alterations: Clay minerals such as smectite and illite changes to kaolinite in areas of hydrocarbon micro-seepage prone zones. Minerals rich in kaolinite often show bright value with clay band ratio images [18].
Carbonate mineral alterations and concentration: This are formed due to the byproduct of oxidation, particularly methane, with one of the following reactions:
Aerobic reaction:
CH4 + 2O2 + Ca2+ → CaCO3 + H2O + 2H+ (1)
Anaerobic reaction:
CH4 + SO42+ + Ca2+ → CaCO3 + H2S + H2O (2)
From Eqns. (1) and (2), and during aerobic and anaerobic reactions, carbon dioxide (CO2) is evolved and its interaction with water yield bicarbonates. Bicarbonates often integrate with calcium and magnesium in underlying ground water to precipitates as clay and carbonate minerals, which show spectral features at 2.2µm and 2.35µm respectively [19].
3.1 Location and extent
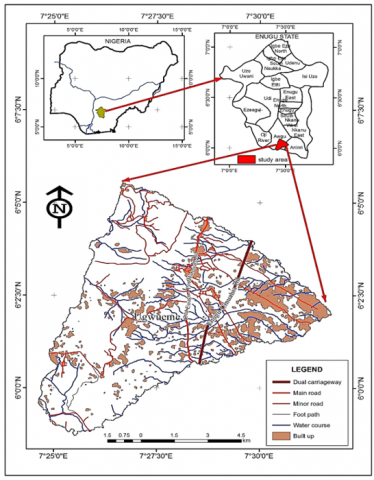
Geographically, Ugwueme and its environs covers an approximate area of 82 km. The region is located between 6°0ʹ00ʹʹN and 6°07ʹ00ʹʹN Latitude and 7°24ʹ00ʹʹE and 7°30ʹ00ʹʹE Longitude of co-ordinates in the South-Eastern geopolitical zone of Nigeria. Ugwueme is bordered by Awgu and Onoli towns in the Eastern direction; Nkwe and Mgbidi in the Northern direction and Lokpanta in the South - Western direction. The study area is situated on a fairly elevated area, and is accessed through a laterite road which connects Ugwueme and Amada through the expressed road linking Enugu and Port Harcourt. Figure 1 shows the location and extent map of Ugwueme.
3.2 Climate, vegetation and geology
Ugwueme is situated within the guinea savanna vegetation belt, characterized with stunted and luxuriant trees [20]. The region experiences two major climates, the wet season which starts from April and ends in September and the dry season which begins in October and ends in March the following year. During the dry season, Ugwueme often experiences dryness, which is associated with the North-East trade wind blowing from the Sahara desert. During the wet season, the study area experiences a total rainfall, estimated to be between 1750 mm and 2000 mm, with rapid soil erosion, leaching and flooding. This condition is believed to be the leading factor which aid oil and gas outflow as seepages at the cuesta slope area in the study area during and after the wet season [21, 22]. The geology and stratigraphy of Ugwueme is highlight in Nigeria’s geological map. The region is underlay by four major formations (Awgu, Owelli, Mamu and Ajali deposits) and five important lithology (dark shale, heterlith sediments, white bedded sandstone, medium and coarse grained sediments). The Owelli deposits are grouped as ferruginous mixture of medium and coarse grained materials, estimated to be about 250 m thick [23]. Within the hydrocarbon seepage location, the Owelli deposit exceed 130 m thick and lies on the Awgu formations [24]. The Awgu deposits is estimated to be up to 400 m thick and overlay the Ezeaku deposits, which consists of a well-sorted and bedded shale.
Figure 1. Location and extent of Ugwueme
4.1 Materials (Date used and pre-processing)
Landsat 7 ETM+ remotely sensed satellite data with spatial resolution of 30 m was downloaded freely from the earth explorer USGS.gov website on 17th December 2000. The website was accessed with path 188 rows 55 and 56 covering the study area. The data is cloud free and was projected to the Universal Transverse Mercator (UTM) zone 32N coordinate system on World Geodetic System (WGS) 1984 ellipsoid. The sensor was geometrically corrected and then processed with the ArcGIS 10.5 and the Erdas Imagine 9.2 software. Field studies was observed in May, 2017 in the study area.
4.2 Methods
4.2.1 Image enhancement techniques
To give prominence in the study to the different anomalous mineral assemblages, three spectral enhancement techniques, the principal component analysis (PCA), band ratio (BR) and false color composite (FCC)] were adopted.
4.2.2 Band rationing
Band rationing is a technique which is widely used in remote sensing for enhancing satellite data. It involves dividing the digital number (DN) of one of the bands of a remotely sensed satellite data with the digital number of another band of the same data [25]. The technique is used to highlight features which cannot be seen in the raw band. To enhance clay and carbonate minerals, the band ratio is (7/5 ratio). This depict that these minerals has strong absorption in the ETM+ band 7 (2.08 – 2.35µm) and high reflectance in the ETM+ band 5 (1.55 – 1.75µm), hence areas of these minerals are highlighted as bright pixel. Color composite band ratio of (3/1 ratio) enhances ferric iron. Here, ferric iron has high reflectance in ETM+ band 3 and high absorption in ETM+ band 1, hence areas of rich ferric iron are represented as bright pixels while areas of low ferric iron are shown with dark pixels. The standard band rationing for delineating areas of ferrous iron, as proposed by Rockwell (2013) is (b2 + b5)/(b3 + b4) ratio.
4.2.3 Principal component analysis (PCA) and Crosta technique
The PCA is a statistical tool which permits reorganization of data in any factors and with the aid of linear transformation, project the data to a new axes component, which are uncorrelated, called the principal components (PCs) [5]. Crosta method is determined by examining the PCA of the eigenvector loadings so as to ascertain the PC image on which information will be concentrate towards the spectral signatures of directed targets [25]. The principal components (PCs) are labelled PC1, PC2, PC3 and so on. The first principal component (PC1) denotes the highest degree of variability of input images, next by (PC2, PC3…). The eigenvectors which are highlighted in PCA explain the linear integration of weighted valued input of the image data, situated in PC, while the eigenvalues show the degree of a particular variance, which is allocated to a stated factor. Eigenvalues denoted as low represent a more or less variance, which are insignificant, and eigenvalues with very low results may be ignored [15, 26]. The Crosta technique, which is a selective principal component analysis (PCA) have been adopted in this study. The Crosta (selective PCA) techniques take into consideration the degree and adopt a sign of the eigenvector loading in order to highlight the necessary PC images [25, 27]. Landsat 7 ETM+ have 6 bands (b1, b2, b3. b4, b5 and b7), with four of the bands adopted for PCA studies. Table 1 depicts the standard assemblage of minerals for Image enhancement with Landsat 7 ETM+ for mineralogical alteration studies.
Table 1. Assemblage of Minerals for Image enhancement with Landsat 7 ETM+ [25, 28]
|
Assemblage of minerals |
Band combinations |
Input methods |
|
Ferric Iron |
1457PC3; b3/b1 |
PCA; band ratio |
|
Ferrous Iron |
1345PC2; (b2 + b5)/(b3 + b4) |
PCA; band ratio |
|
Clay and carbonate minerals |
3457PC4; b7/b5 |
PCA; band ratio |
5.1 Crosta technique [selective principal component analysis (PCA)]
Landsat 7 ETM+ data is analyzed with selected PCA to show areas, which are rich in ferrous iron, ferric iron alteration, clay and carbonate mineral alterations respectively.
5.1.1 PC showing red bed bleaching
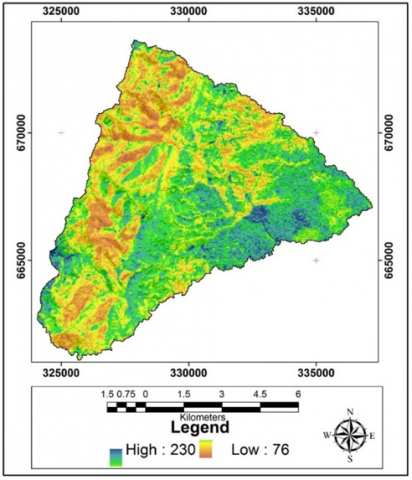
Four Landsat 7 ETM+ bands were chosen from the bands (b1, b2, b3, b4, b5 and b7) for PCA application. From the band selection, the PCA technique shows that the 1457-PC3 (second principal component of the input bands 1457) is the most suitable PC image for spectral enhancement of ferric iron (Figure 2a). The negative loading for the image bands 4 and 5 and the positive loading for image bands 1 and 7 (Table 2), suggest that bleached zones with band inputs 1457 will be shown as dark pixels.
Table 2. Principal component analysis (PCA) of Landsat 7 ETM+ bands 1457
|
Input band |
Band 1 |
Band 4 |
Band 5 |
Band 7 |
Eigenvalue (%) |
|
PC 1 |
6.87793 |
0.25916 |
22.88396 |
25.70226 |
90.6991 |
|
PC 2 |
0.25916 |
18.70438 |
-3.60323 |
7.57724 |
7.1899 |
|
PC 3 |
22.88396 |
-3.60323 |
123.2757 |
135.1732 |
1.3436 |
|
PC 4 |
25.70226 |
7.57724 |
135.1732 |
166.6061 |
0.7674 |
5.1.2 PC indicating ferrous iron (Fe2+)
The acidic nature of the induced-hydrocarbon oil and gas micro-seepage environment reduces ferric iron components by promoting the development of ferrous iron materials (Fe2+) which include pyrite and pyrrhotite. With Landsat 7 ETM+ data, ferrous iron materials indicate a greater absorption ability in the fourth bands and then improve on the radiance reflectance in the first and third bands of the satellite image. Four Landsat 7 ETM+ bands were chosen from the bands (b1, b2, b3, b4, b5 and b7) for PCA study. From the band selection, and for the PCA, the 1345-PC2 is the most ideal PC image for spectral enhancement of ferrous iron materials (Figure 2b). The negative loading for the image bands (b3 and b4) and the positive loading for bands (b1 and b5) (Table 3) indicate that ferrous iron materials on the image are depicted as dark pixels with band combinations 1345.
Table 3. Principal component analysis (PCA) of Landsat 7 ETM+ bands 1345
|
Input band |
Band 1 |
Band 3 |
Band 4 |
Band 5 |
Eigenvalue (%) |
|
PC 1 |
6.87793 |
15.76621 |
0.25916 |
25.70226 |
88.3995 |
|
PC 2 |
15.76621 |
46.16995 |
-2.39002 |
79.48648 |
8.7401 |
|
PC 3 |
0.25916 |
-2.39002 |
18.70438 |
7.57724 |
2.4773 |
|
PC 4 |
20.50126 |
79.48648 |
7.57724 |
166.6061 |
0.3832 |
5.1.3 PC highlighting clay and carbonate mineral features
Clay and carbonate minerals respectively express spectral characteristics at locations 1.4 µm, 1.75 µm, 1.9 µm, 2.2 µm and 2.35 µm [19]. Four Landsat 7 ETM+ bands were chosen within the bands (b1, b2, b3, b4, b5 and b7) for the PCA analysis. From the band selection, and for PCA, the 3457-PC3 (third principal component of the input bands 3457) best suit the PC image for spectral enhancement of clay and carbonate minerals interpretation (Figure 2c). The negative loading for the image bands (b3, b4 and b7) and the positive loading for band (b5) (Table 4) highlight clay and carbonate features as dark pixel.
Table 4. Principal component analysis (PCA) of Landsat 7 ETM+ bands 3457
|
Input band |
Band 3 |
Band 4 |
Band 5 |
Band 7 |
Eigenvalue (%) |
|
PC 1 |
46.16995 |
-2.39002 |
79.48648 |
70.76094 |
90.988 |
|
PC 2 |
-2.39002 |
18.70438 |
7.57724 |
-3.60323 |
6.6499 |
|
PC 3 |
79.48648 |
7.57724 |
166.6061 |
135.1732 |
1.271 |
|
PC 4 |
70.76094 |
-3.60323 |
135.1732 |
123.2757 |
1.0912 |
5.2 Band ratio technique
The band ratio is an important technique for enhancing selected minerals associated with hydrocarbon oil and gas studies [7, 25]. Sequel to the spectral properties of induced oil and gas micro-seepage, three band ratio index have been adopted for this study.
(a)
(b)
(c)
Figure 2. Principal Component (PC) image showing (a) 1457PC3 which highlight areas of ferric iron (Fe3+) mineral-rich as high pixel and ferric iron mineral-poor (bleaching of red beds) areas as low pixel values; (b) 1345PC2 which expound zones of ferrous iron (Fe2+) features in excess as low pixel values; (c) 3457PC4 which indicate clay mineral and carbonate zones as low pixel values
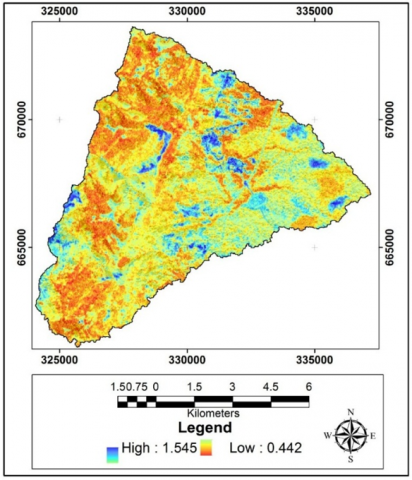
5.2.1 Ferric iron (Fe3+) mineral index
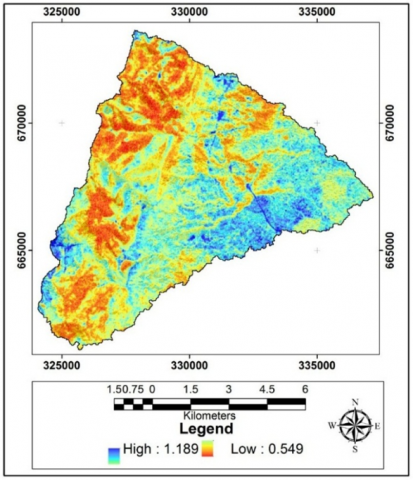
The band ratio index to enhance ferric iron is (b3/b1 ratio). Areas which are rich with ferric iron minerals are shown as high or bright pixels with Landsat 7 ETM+ while spots with dark pixels represent ferric iron low areas. Pixels which are shown to be dark indicate areas of red bed bleaching. The ferric iron band ratio index map for the study is shown in Figure 3a.
5.2.2 Ferrous iron (Fe2+) mineral index
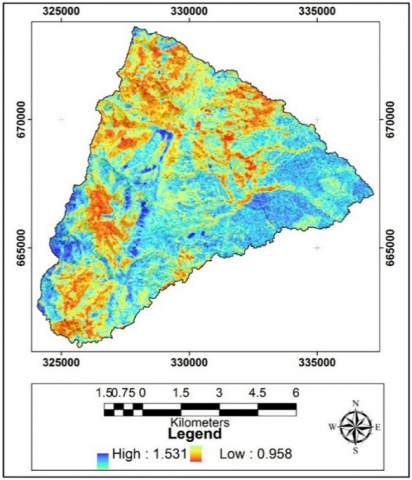
The band ratio index with Landsat 7 ETM+ as proposed by Rockwell (2013) to enhance ferrous iron materials is (b2 + b5)/(b3 + b4). Areas with bright or high pixels in the image are areas with ferrous iron minerals as shown in Figure 3b.
5.2.3 Clay and carbonate mineral index
The band combination index to enhance clay and carbonate features with Landsat 7 ETM+ sensor is (b7/b5 ratio). Areas with low pixels are interpreted as clay and carbonate and as shown in Figure 3c.
5.3 Spectral reflectance of soils and sediments
Soils and Sediments often absorb and reflect solar radiations differently. The characteristics of their spectral reflectance is dependent upon the spectral of the materials and their texture properties [26]. Spectral reflectance is the rate of solar reflectance from a surface which is attributed to wavelength. Within the electromagnetic spectrum, various surfaces often reflect solar energy in different ways. These variation in solar energy reflectance often aid in identifying the different surface materials by considering their spectral reflectance. Different spectral reflectance graph shows the reflectance of materials with respect to their wavelengths. Minerals such as clay-shale shows absorption features at the range of 1.2-2.3 µm. Iron oxide shows absorption characteristics at 0.87 µm value, related to Fe3+. while ferrous iron expresses their spectral feature at 1.0 µm [26].
Figure 4 depicts the spectral reflectance curve of minerals. The reflectance values of the minerals are plotted against the wavelength to highlight their degree of reflectance with respect to each other. The materials have their categories of spectral absorption features, which were subdivided into classes, with class 1 showing the areas exhibiting absorption features at 0.55; class 2 highlighting areas with dominant absorption features at 0.75 while class 4 are zones displaying shallow absorption features and at 0.46 value. The class 5 indicate zero distinct absorption features. The study depicts the minerals with absorption features close to 0.4-0.55 and 0.7-0.9 µm are iron bearing minerals (Figure 5).
(a)
(b)
(c)
Figure 3. Band ratio image index (a) (b2 + b5) (b3 + b4) expound ferrous iron (Fe2+) features as high pixel values (b) b3/b1 representing ferric iron (Fe3+) features poor areas as low pixel values (c) b7/b5 indicating clay features and carbonate abundance areas as low pixel values
Figure 4. Spectral reflectance curve of the minerals
Figure 5. Spectral absorption features
Remote Sensing is an important tool for induced hydrocarbon micro-seepage studies. The technology offers a cheap, non-destructive and a more effective means of studying mineralogical alterations and anomalies than the traditional method. At the earth’s surface, induced hydrocarbon micro-seepage alterations of soil and sediments occur in various forms. Among these forms, ferric iron reduction (Red bed bleaching), clay and carbonate mineral alterations and ferrous iron enrichment show abnormal spectral signature, which can be studied with Remote Sensing technique. In this study, Landsat 7 ETM+ was used to interpret the onshore induced hydrocarbon micro-seepage alteration and anomalies viz spectral enhancement techniques such as PCA, band ratio and false color composite (FCC) in Ugwueme. With Landsat 7 ETM+, and for PCA, the PC images of 1457PC3 (third PC image on bands 1, 4, 5 and 7), 1345PC2 and 3457PC4 highlight excellent spectral enhancement for delineating alterations and anomalous areas. Band ratio index such as (3/1), (7/5) and [(2 + 5)/(3 + 4)] also yields better spectral enhancement for alterations and anomalous micro-seepage studies. The result shows that Landsat 7 ETM+ data is an effective remote sensing sensor for mineralogical alterations and anomalies studies.
The authors wish to thank Professor Francis Ifeanyi Okeke of the Department of Geoinformatics and Surveying, University of Nigeria and Professor Lazarus Mustapha Ojigi of the Department of Geomatics, Ahmadu Bello University, Zaria, Nigeria for their immense contributions, toward the success of this study.
|
ETM+ |
Enhanced Thematic Mapper Plus |
|
PCA |
Principal Component Analysis |
|
BR |
Band Ratio |
|
FCC |
False Color Composite |
|
PC |
Principal Component |
|
et al |
et alia |
|
Eh |
Activity of electrons |
|
ph |
Hydrogen ions |
|
CH4 |
Methane |
|
CO2 |
carbon-dioxide |
|
µm |
Micro-meters |
|
2O2 |
Oxygen |
|
Ca2+ |
Calcium ions |
|
CaCO3 |
Calcium carbonate |
|
H2O |
Water |
|
2H+ |
Hydrogen ions |
|
SO42+ |
Sulfate ions |
|
H2S |
Hydrogen sulfide |
|
km |
Kilometers |
|
N |
Nitrogen |
|
mm |
Millimeters |
|
m |
Meters |
|
USGS |
United States Geological Surveys |
|
UTM |
Universal Transverse Mercator |
|
WGS |
World Geodetic System |
|
DN |
Digital Number |
|
Fe2+ |
Ferrous iron |
|
Fe3+ |
Ferric iron |
|
b |
Bands |
[1] Enoh, M.A., Okeke, U.C., Barinua, N.Y. (2020). Modelling and delineation of hydrocarbon micro-seepage prone zones on soil and sediment in Ugwueme, South Eastern Nigeria with Soil Adjustment Vegetation Index (SAVI). International Journal of Plant & Soil Science, pp. 13-33. https://doi.org/10.9734/IJPSS/2020/v32i1330355
[2] Etiope, G. (2015). Natural gas seepage. The Earth’s Hydrocarbon Degassing, Springer, 640. https://doi.org/10.1007%2F978-3-319-14601-0
[3] Rubio, V. (2002). Correlation of the onshore hydrocarbon seepages with the geo-structural characterization in the Venura Basin, Santa Barbara area, California (Doctoral dissertation, PhD. thesis).
[4] Schumacher, D. (2002). Hydrocarbon geochemistry exploration for petroleum. AAPG Memoir, 66: 184-204.
[5] Shi P., Fu, B., Ninomiya Y. (2010): Detecting lithology features from ASTER VNIR-SWIR multispectral data in arid region: Case study in Eastern Kalpin uplift, Southern Tian Shan. Chinese Journal of Geology, 45(1): 333-347.
[6] Fu, B., Zheng, G., Ninomiya, Y., Wang, C., Sun, G. (2007). Mapping hydrocarbon‐induced mineralogical alteration in the northern Tian Shan using ASTER multispectral data. Terra Nova, 19(4): 225-231. https://doi.org/10.1111/j.1365-3121.2007.00739.x
[7] Van der Meer, F., Van Dijk, P., Van Der Werff, H., Yang, H. (2002). Remote sensing and petroleum seepage: A review and case study. Terra Nova, 14(1): 1-17. https://doi.org/10.1046/j.1365-3121.2002.00390.x
[8] Donovan, T.J. (1974). Petroleum microseepage at Cement, Oklahoma: evidence and mechanism. AAPG Bulletin, 58(3): 429-446. https://doi.org/10.1306/83D9140C-16C7-11D7-8645000102C1865D
[9] Schumacher, D. (1996). Hydrocarbon-induced alteration of soils and sediments. American Association of Petroleum geologists, 71-89.
[10] Saunders, D.F., Burson, K.R., Thompson, C.K. (1999). Model for hydrocarbon microseepage and related near-surface alterations. AAPG bulletin, 83(1): 170-185. https://doi.org/10.1306/00AA9A34-1730-11D7-8645000102C1865D
[11] Noomen, M.F. (2007). Hyperspectral reflectance of vegetation affected by underground hydrocarbon gas seepage.
[12] Yang, H., Van der, Meer., Zhang, J., Kroonenberg, S. (2002). Direct detection of onshore microseepage with Remote Sensing techniques. Remote Sensing Reviews, 18: 5-7, 13.
[13] Smith, K.L., Steven, M.D., Colls, J.J. (2004). Spectral responses of pot-grown plants to displacement of soil oxygen. International Journal of Remote Sensing, 25(20): 4395-4410. https://doi.org/10.1080/01431160410001729172
[14] Yang, H., Meer, F.V.D., Zhang, J., Kroonenberg, S.B. (2000). Direct detection of onshore hydrocarbon microseepages by remote sensing techniques. Remote Sensing Reviews, 18(1): 1-18. https://doi.org/10.1080/02757250009532381
[15] Sabins, F.F. (1999). Remote sensing for mineral exploration. Ore geology reviews, 14(3-4): 157-183. https://doi.org/10.1016/S0169-1368(99)00007-4
[16] Olah, G.A., Molnár, Á. (2003). Hydrocarbon Chemistry. John Wiley & Sons.
[17] Schumacher, D. (1999). Surface geochemical exploration for petroleum. Exploring for Oil and Gas Traps. AAPG, Tulsa, OK.
[18] Schumacher, D. (2002). Hydrocarbon geochemical exploration for petroleum. AAPG, Memoir 66: 184-204.
[19] Hunt, J.M. (1979). Petroleum Geochemistry and Geology, W.H. Freeman Co.
[20] Ozoko, D., Onyeabor, C. (2017). Water quality assessment of Ugwueme surface and ground water system. International Journal of Science and Research, 6(9): 833-838.
[21] Ofomata, G.E. (1975). Landform Region. Ethiope Publishing House, Benin, 33-34.
[22] Okeke, H.C. (2006). Elemental and physicochemical analysis of crude oil extract from Ugwueme tar sand deposit.
[23] Simpson, A. (1956). The Nigerian coal fields. Geology of Owerri and Benue provinces. Bulletin of Geological Survey of Nigeria, 24.
[24] Kogbe, C. (1975). Cretaceous and Paleogene sediments of Southern Nigeria. In Geology of Nigeria.
[25] Tangestani, M.H., Moore, F. (2000). Iron oxide and hydroxyl enhancement using the Crosta Method: A case study from the Zagros Belt, Fars Province, Iran. International Journal of Applied Earth Observation and Geoinformation, 2(2): 140-146. https://doi.org/10.1016/S0303-2434(00)85007-2
[26] Gupta, R.P. (2017). Remote Sensing Geology. Springer.
[27] Loughlin, W. (1999). Principal Component Analysis for alteration mapping. Photogrammetric Engineering Remote Sensing of Environment, 79: 60-71.
[28] Rockwell, B.W. (2013). Automated mapping of mineral groups and green vegetation from Landsat Thematic Mapper imagery with an example from the San Juan Mountains, Colorado. US Geological Survey Scientific Investigations Map, 3252.