Mohammed Mejbel Salih
© 2021 IIETA. This article is published by IIETA and is licensed under the CC BY 4.0 license (http://creativecommons.org/licenses/by/4.0/).
OPEN ACCESS
As water is the backbone of life and the essence of human survival, it has become very necessary to monitor the quality of water resources, In recent years, remote sensing techniques have been introduced on a large scale in the various branches of sciences, the latest technologies of the remote sensing are used through a system assembled in a laboratory that works as an intensity measuring device for the incident and reflected light from objects. The new system is used to calculate the spectral signature within the visible bands of polluted water on a part of the Tigris River in Baghdad. In addition, conducting field tests to verify the reliability of the satellite images of the same study area, noting that these visuals are made through which the spectral footprint of any area in the space image is calculated and after making field measurements on polluted water and comparing it with the actual behavior of the reflected energy from these waters. The results were in conformity with the field measurements and it becomes possible for the beneficiaries to use this technology as a tool to monitor the quality of water by using the spectral signature of water.
spectral reflectance, remote sensing, lux meter
The main problem in certain parts of the world including our country, the wastewater is pumped directly to the rivers without any form of treatment [1]. This operation contaminates the water that is used by the people. Therefore, it is very highly important to classify the wastewater [2]. The water absorbs part of the energy incident on its surface and reflects another part of the energy [3]. The reflectance properties of water are a function of the water and the wastes in the water (organic, and or inorganic materials) [4]. If the water has a large amount of sediment present, then a higher visible reflectance will result compared to the clearer waters [5].
Numerous studies have been made using the Remote sensing technique in many applications relating to environmental issues. Adeola et al. [6] employed the Remote sensing technique to determine breeding habitats. The study used the Nkomazi municipality as a case study. In Makurdi Town of Benue State, Stephen et al. [7] have examined the physical growth and expansion using remote sensing techniques. In another respect, Adefisan et al. [8] used a remote sensing technique to set areas vulnerable to flood hazards. The study selected Ibadan Metropolis as a case study for achieving this goal. Ige et al. [9] examined the use of remote sensing to detect changes in land cover in Abuja and all factors affecting the thermal environment. In order to reduce the impact on ecological sustainability, Onamuti et al. [10] used remote sensing to estimate the level of the shrinkage of Chad Lake.
Peter et el. [11] Focused on Their study on dealing with the values of the reflection sensitivities of solar radiation using a precise physics-based technique, as well as simulating the actual measured sun radiation concentration ranges and the values of the visual properties of representative water bodies, in addition to the values of the spectra of the bottom layer practically measured. Henna-Reetta et al. [12] are publish, describe and record the values of the spectral reflectance data for the seasonal snow surface (dry, wet, shaded), in addition to recording and describing the data values in forest lands (lichen, mosses) as well as forest canopy areas (for fir trees and pine trees, branch areas) which are the main and important elements of the landscape for the natural in the northern regions.
Genuis [13] discussed the relationship between environmental medicine, human exposure, and adverse health outcomes in most health education programs by using remote sensing. The study showed that there is a large lack of information in environmental medicine on the risks to users of modern technology. In another respect and in order to monitor desertification, Xiao et al. [14] used a remote sensing technique to infer the physical properties of the topsoil and to know its texture. Demattê et al. [15] employed remote sensing technique to study the soil attributes through multi-temporal satellite image information. Aasen et al. [16] highlighted and discussed the modern remote sensing techniques in addition to analyzing the limitations and potential for this technique. Wójtowicz et al. [17] have concentrated on the use of remote sensing techniques to maximize the viability of agricultural crop production and to protect the environment. Mutanga et al. [18] studied remote sensing and its potential to estimate and map the spread of pests and diseases in agricultural crops. The study said that there are many challenges to these techniques and their applications to monitor crop diseases. Leblanc et al. [19] considered that remote sensing techniques are an excellent approach to distinguish polar bears and other mammals from clean snow. Pessoa et al. [20] investigated the possibility of remote sensing technology in detecting soil salinity by knowing its properties. The findings indicated that despite the effectiveness of the method, there are significant challenges in determining soil salinity.
The main objective of this paper is to determine the spectral signature for wastewater through the luxmeter by measuring the intensity of the incident and reflected light from the water surface. Thus, the ability to classify the wastewater and determine whether this type of water is usable after treatment or it is unusable even though after treatment. The method used in this paper based on the visible spectra of the electromagnetic spectrum as a principle of remote sensing and its application to classify the water quality.
The Tigris is the eastern member of the two great rivers that define Mesopotamia, the other being the Euphrates. The river flows south from the mountains of southeastern Turkey through Iraq and empties into the Arabic Gulf. It is known that the Tigris River is considered one of the main important sources in meeting the water need in Iraq. Many pollutants enter the river every day, as in the rivers of the world through the sanitary sewers, the Tigris River from rivers that form bends and several islands due to the slow flow of water in with an inclination to the south or by an amount (0.1m/km), this causes sedimentation in the running water.
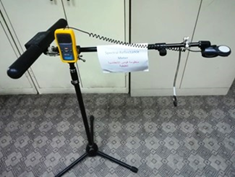
The water need increases continuously. Various uses in all fields and now water is an important element in the environment and human life. Therefore, the research relied on a precise and continuous study. This research aims to study the physical properties to know the spectral footprint of the Tigris River water. Contaminated near from area of pollutant sources, In the present study, three methods were utilized for collecting data from the river by using white, green, and red filters the direct measurement of the intensity of visible light reflected from the water surface by luxmeter reflectance system Figure 1 on the height of 125 cm by using three filters (white, red and green). Indirect measurement of the intensity of the light incident upon the sensor of luxmeter when the sensor is directed to the sun-ray and by using the same filters.
Figure 1. luxmeter reflectance system
Since the reflecting signature is obtained from the reflected light which incident on the water under investigation, therefore the light concept must be investigated and known [21]. Light is electromagnetic energy that incident on the water and part of this energy is reflected, photon energy that is dependent upon the wavelength of the light. The energy of a photon can be calculated by:
Photo from reflected energy:
$\mathrm{E}=\mathrm{hc} / \lambda$ (1)
(E) unit of joule.
h= plank’s constant = (6.625) × (10 E-14) J.s
c= Speed of the light = 2.998 ×10 E8 m/s.
When electromagnetic energy is incident to any given water surface or any surface this energy, which is carried by photons in the visible range, would interact with the substances available in the water. Various fractions of the incident energy at the points available in the water are reflected, absorbed, and or transmitted [22]. Two processes can lead to enabling the sensor to detect the presence of an object in the water via the reflected energy from the surface of the water under investigation.
The first one is the reflected part of the illumination energy which is detected by sensor [23]. The irradiation energy is given by E, while the reflected radiant emittance is given by M. The reflectance of an object in the water or in anywhere is a physical property of the object independent of the illumination conditions.
It is a unitless quantity and it is given by:
Reflectane $\rho=\frac{\mathrm{M}}{\mathrm{E}}$ (2)
As it is stated that there are three types of the fraction of incident energy, reflected absorbed and or transmitted. Applying the principle of conservation of energy, it can be stated interrelationship among these three energy interactions as:
$\mathrm{E}_{\mathrm{I}}(\lambda)=\mathrm{E}_{\mathrm{R}}(\gamma)+\mathrm{E}_{\mathrm{A}}(\gamma)+\mathrm{E}_{\mathrm{T}}(\gamma)$ (3)
where,
EI=incident energy;
ER=reflected energy;
EA=absorbed energy;
ET=transmitted energy;
with all energy components being a function of wavelength λ.
The reflection coefficient or spectral Reflectance [p(λ)] is the ratio of the reflected energy to incident energy as a function of wavelength. Various materials in the water have different spectral reflectance characteristics.
The reflectance characteristics of the substance with the waste features are expressed:
$\mathrm{p}(\lambda)=\left[\mathrm{E}_{\mathrm{R}}(\mathrm{d}) / \mathrm{E}_{\mathrm{I}}(\lambda)\right] \times 100$ (4)
where, p(λ) = spectral reflectance (reflectivity) at a particular wavelength.
ER(λ) = Reflected energy from an object at a particular wavelength.
EI(λ) = Incident energy upon the object particular wavelength.
The relation between p(λ) and (λ)can be drawn as a curve and it is called the spectral reflectance curve. This varies with the variation in the chemical composition and physical condition of the features of the wastewater [24].
4.1 Reflectance data set (lux meter system)
A luxmeter is an important main part. This system is designed and implemented for this research. Luxmeter is a device used for the measurement of light intensity, specifically the intensity which comes from the sun source brightness shown in Figure 2. This is the aim of than measurement of the actual light energy produced by or reflected from an object or light source. The given measure the reflected amount of light energy (lux) from both pure and wastewater to calculate the reflectance ratio. The amount of energy reflected in both cases depends on reflectance signature of the water. The results obtained from both types of water are compared with premeasured data of pure water to discriminate the wastewater from pure water. To determine the reflectance of the wastewater and pure water, the light incident on both types of water are also measured by luxmeter.
Figure 2. Luxmeter device
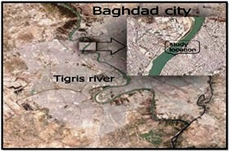
Data collection to measure reflectance signature using luxmeter system. To determine the reflectance signature of the wastewater, the river Tigris which is one of two, great rivers in the mid-Baghdad city in Iraq Figure 3 and Figure 4 that define Mesopotamia.
The data collection process was done through different times of the day. On a sunny day on 30 December 2019 in Adhamiya city in place as shown as the yellow mark in Figure 5 on the side of the river.
Figure 3. Baghdad city
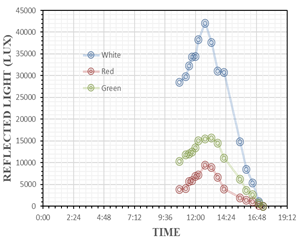
Data collection was done through different times during the day via three filters white, green, and red [25, 26]. The red filter allows only red wavelengths to reach the sensor while the green filter allows only green wavelengths to reach the sensor and both of them prevent other wavelengths to reach the sensor. The white filter represents the sensor itself in the place where the light enters the sensor so all the sunlight will reach the sensor. The data collection process was done in two stages at each filter and, it made the reading of intensity of light when the sensor directed toward the water Figure 5 and another reading when the sensor directed toward sky Figure 6 (Direct to sunlight). Data (intensity of light via lux meter) were in Table 1.
When we calculate reflectance that produced through dividing the intensity of light reflecting from the water surface to the intensity of light incident upon it, we found the value of reflectance as shown in the Table 2. As these results and investigations coincide with [1, 12, 21].
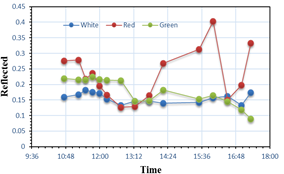
Allows to the red and green wavelengths to reach the sensor Figure 7, it is known that the green wavelength ranges from 0.5 µm to 0.57 µm and the red wavelength ranges from 0.61 µm to 0.69 µm when we take the reading to the intensity of light must be at a specific wavelength finally Figure 8 the relation and the data as follows in the Table 3.
Figure 4. Area of study (Tigris river)
Figure 5. Intensity reflected light of Tigris`s water by three filters (white, red, green)
Figure 6. Light intensity of the sun by three filters (white, red, green) reflected from waste water
Table 1. Intensity of light via a luxmeter system (wastewater)
|
No. |
Time |
On sky (lux) |
Green (lux) |
On sky (lux) |
Red (lux) |
On sky (lux) |
White (lux) |
|
1 |
10:45 |
10340 |
2270 |
3880 |
1071 |
28500 |
4550 |
|
2 |
11:15 |
11820 |
2540 |
4100 |
1144 |
29800 |
4990 |
|
3 |
11:30 |
12060 |
2600 |
5680 |
1240 |
32300 |
5880 |
|
4 |
11:45 |
12510 |
2810 |
5970 |
1408 |
34400 |
6030 |
|
5 |
12:00 |
13500 |
2920 |
6850 |
1335 |
34500 |
5930 |
|
6 |
12:15 |
15050 |
3210 |
7180 |
1198 |
38300 |
5840 |
|
7 |
12:45 |
15500 |
3300 |
9440 |
1195 |
42100 |
5580 |
|
8 |
13:15 |
15730 |
2310 |
8950 |
1159 |
37700 |
5500 |
|
9 |
13:45 |
14590 |
2150 |
6650 |
1094 |
31100 |
4540 |
|
10 |
14:15 |
11110 |
2030 |
3970 |
1063 |
30800 |
4310 |
|
11 |
15:30 |
6300 |
961 |
1970 |
616 |
14850 |
2120 |
|
12 |
16:00 |
3630 |
598 |
1384 |
559 |
8490 |
1337 |
|
13 |
16:30 |
2710 |
392 |
1063 |
160 |
5420 |
881 |
|
14 |
17:00 |
789 |
93.4 |
228 |
45 |
1131 |
151.1 |
|
15 |
17:20 |
25.7 |
2.3 |
4.5 |
1.5 |
52.4 |
9.1 |
|
16 |
17:30 |
3.1 |
0 |
1.5 |
0 |
6.9 |
0 |
Figure 7. The relationship between reflectance
Figure 8. Relation between wave lengths (R and G) with reflectance
Table 2. Value of reflectance
|
Refl.(white) |
Refl.(red) |
Refl.(green) |
|
0.15964912 |
0.2760309 |
0.2195358 |
|
0.16744966 |
0.2790244 |
0.21489 |
|
0.18204334 |
0.2183099 |
0.2155887 |
|
0.1752907 |
0.2358459 |
0.2246203 |
|
0.17188406 |
0.1948905 |
0.2162963 |
|
0.15248042 |
0.1668524 |
0.213289 |
|
0.13254157 |
0.126589 |
0.2129032 |
|
0.14588859 |
0.1294972 |
0.1468531 |
|
0.14598071 |
0.1645113 |
0.1473612 |
|
0.13993506 |
0.2677582 |
0.1827183 |
|
0.14276094 |
0.3126904 |
0.1525397 |
|
0.15747939 |
0.4039017 |
0.1647383 |
|
0.16254613 |
0.1505174 |
0.1446494 |
|
0.13359859 |
0.1973684 |
0.1183777 |
|
0.17366412 |
0.3333333 |
0.0894942 |
Table 3. Finally the relation between wavelength and (red and green) reflectance
|
Wavelength |
Ref R+G |
|
0.5 |
0.219536 |
|
0.5088 |
0.21489 |
|
0.5176 |
0.215589 |
|
0.5264 |
0.22462 |
|
0.5352 |
0.216296 |
|
0.544 |
0.213289 |
|
0.5528 |
0.212903 |
|
0.569 |
0.146853 |
|
0.61 |
0.276031 |
|
0.6213 |
0.279024 |
|
0.6326 |
0.21831 |
|
0.6439 |
0.235846 |
|
0.6552 |
0.194891 |
|
0.6665 |
0.166852 |
|
0.67 |
0.126589 |
|
0.696 |
0.129497 |
4.2 Determine spectral reflectance by using Erdas imagine 2014
This function allows the user to view spectral profiles for selected points. It also allows a comparison with laboratory measurements of reflectance for any objects. The spectral libraries have been chosen to provide a reference for the Airborne Visible/Infrared Imaging Spectrometer (AVIRIS) instrument. This spans a range between 0.4 and 0.7 from visible bands microns in the reflected region of the electromagnetic spectrum. In Erdas imagine 2014 the reflectance calculated through this formula below:
$\rho \lambda=\mathrm{M} \rho * \mathrm{Qcal}+\mathrm{A} \rho$ (5)
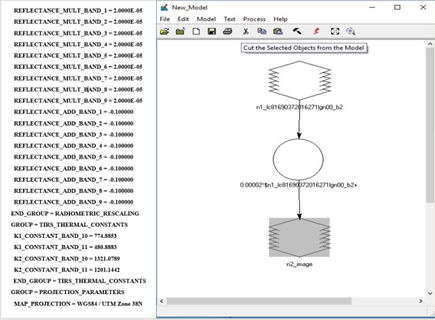
where, ρλ = reflectance, Mρ= reflectance-Mult-Band, Qcal= digital number, Aρ = reflectance-ADD-Band.
Landsat-8Image with multiband can determine the reflectance and then compare the results taken from the field by using luxmeter system. The image is picked up by LANDSAT 8 with 12 bands, all of them in visible range except two were picked up in thermal range, to the analysis of data were as follows:
Identify the study area and making it in the framework through "inquire" in the home page we can find the value of a pixel by mark "+" on the study area.
It is possible to get the value of Mρ&Aρ through text document that attached image Figure 9. as these results and investigations coincide with [1, 11, 12, 21].
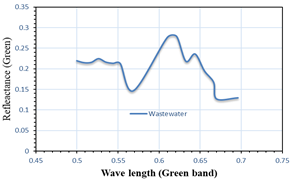
Through the new model of metadata Figure 10, it can make a calculation of an image to output an image with modified raster depend on the value of Aρ&Mρ who is located in the equation mentioned previously. Finally, the value of reflectance for the study area with three bands of wavelength as shown in Table 4 taken from Landsat-8., and Figure 10 showing the reflectance with wavelength (Green –Red) to indicate the signature of wastewater from LST-8., As these results and investigations coincide with [1, 11, 12, 21].
Band 2 >>> Blue >>> 0.45 – 0.51 µm
Reflectance = 0.11016
Band 3 >>> Green >>> 0.53 – 0.59 µm
Reflectance = 0.1054
Band 4 >>> Red >>> 0.64 – 0.67 µm
Reflectance = 0.101
Data collected for reflected light with incident light. This data is a criterion or standard correction for the reflectance that takes it from the satellite Image and from the data in Table 4, as well as the data from the luxmeter recording in Table 3. In general, there is a convergence of the real value between the image of the satellite with the luxmeter system.
The intensity of reflected light of Tigris`s water in green wavelength is much higher than the intensity of reflected light in red wavelength. Both of them increased gradually at the time to an end to about the middle of the day and then decreases.
The value of a reflective spectral increase at the peak of the day (about 0.4) when using a red filter while it`s still stable (about 0.15 - 0.25) when using a green filter. Through the results of the field and compare it with the result of the analysis of the program, it can be said that although the spectral reflectance features were similar for all water bodies studied, variations in the magnitude of the reflectance were found all over the spectrum.
Table 4. Metadata reflectance from LST-8 visible
|
Reflectance |
Wavelength |
|
0.11016 |
0.45 |
|
0.1097 |
0.46 |
|
0.10767 |
0.47 |
|
0.212 |
0.53 |
|
0.2054 |
0.55 |
|
0.2058 |
0.58 |
|
0.1952 |
0.64 |
|
0.2089 |
0.66 |
|
0.2152 |
0.67 |
Figure 9. LANDSAT- 8 Image with 12 bands
Figure 10. LST-8 reflectance visible bands (Green –Red)
The reflectance of the river in the entire visible region of the spectrum was much higher than in the clear water. This is caused by higher scattering by suspended matter in the river, therefore:
Minimum reflectance in the blue region of the spectrum (400-500 nm) due to maximum absorption by photosynthetic pigments and by dissolved organic matter.
Maximum reflectance in the green region of the spectrum (around 570 nm) due to minimum absorption by all photosynthetic pigments of phytoplankton.
A minimum of around 580 nm, probably due to absorption by chlorophyll.
To adjusts, image brightness digital number (DN) values for some satellite sensors, similar to an atmospheric correction. The adjustments are based on sun elevation, acquisition date, and sensor properties (gain/bias settings for each band).
The Apparent Reflectance function is used to adjust reflectance, or brightness, values of some satellite imagery based on the scene illumination, and sensor-gain settings. The images are adjusted to a theoretically common illumination condition, so there should be less variation between scenes from different dates and different sensors. This can be useful for image classification, color balancing.
The main achievement of this investigation was to give a spectral signature for wastewater through an instrument for the measurement of light reflected from the wastewater surface. The instrument measures only the intensity of light, model analysis of the spectral yields, and reflection of light's intensity to produce the spectral reflectance of wastewater on the imposition of that device is above the water by the limit of 125 cm, data collected for reflected light and incident light. This data is a criterion or standard correction or confirmation of other programs that deal with image processing such as ErdasImagine, Arc gis, media. The intensity of reflected light of Tigris's water in green wavelength is much higher than the intensity of reflected light in red wavelength. Both of them increased gradually at the time to an end to about the middle of the day, and the decreases. The value of a reflective spectral increase at the peak of the day (about 0.4) when using a red filter while it's still (about 0.15-0.25) when using a green filter. Through the results of the field and compare it with the result of the analysis of the program, it can be concluded that the minimum reflectance in the blue region of the spectrum (400-500nm) due to maximum absorption by photosynthetic pigments and dissolved organic matter. In addition, the maximum reflectance in the green region of the spectrum around (570nm) due to minimum absorption by all photosynthetic pigments of phytoplankton.
[1] Ogashawara, I., Max, J.M. (2014). Improving inland water quality monitoring through remote sensing techniques. ISPRS International Journal of Geo-Information, 3(4): 1234-1255. https://doi.org/10.3390/ijgi3041234
[2] Lathrop, R. (1992). Landsat thematic mapper monitoring of turbid inland water quality. Photogrammetric Engineering & Remote Sensing, 58(4): 465-470.
[3] Pinto, U., Basant, L.M., Shrestha, S., Morris, C. (2012). Understanding the meaning of river health for a community: perspectives from the peri-urban region of the Hawkesbury–Nepean catchment, Australia. Water Policy, 14(5): 766-783. https://doi.org/10.2166/wp.2012.074
[4] Gürsoy, Ö., Birdal, A.C., Özyonar, F., Kasaka. E. (2015). Determining and monitoring the water quality of Kizilirmak River of Turkey: First results. The International Archives of Photogrammetry, Remote Sensing and Spatial Information Sciences, 40(7): 1469. https://doi.org/10.5194/isprsarchives-XL-7-W3-1469-2015
[5] Deye, F., Vincent, F., Michel, P., Ehrmann, S., da Silva, D., Piagnerelli, M., Kimmoun, A., Hamzaoui, O., Lacherade, J.C., de Jonghe, B., Brouard, F., Audoin, C., Monnet, X., Laterre, P.F. (2013). Changes in cardiac arrest patients’ temperature management after the 2013 “TTM” trial: Results from an international survey. Annals of Intensive, 6(1): 737-750. https://dx.doi.org/10.1186%2Fs13613-015-0104-6
[6] Adeola, A.M., Jane, M.O., Joel, O.B., Rautenbach, C.J.W., Ahmed, M.K., Philemon, L.T., Adisa, O.M., Francis, W.N.N. (2017). Landsat satellite derived environmental metric for mapping mosquitoes breeding habitats in the Nkomazi municipality, Mpumalanga Province, South Africa. South African Geographical Journal, 99(1): 14-28. https://doi.org/10.1080/03736245.2015.1117012
[7] Hemba, S., Iortyom, E.T., Orimoleye, I.R., Daniel, D.P. (2017). Analysis of the physical growth and expansion of Makurdi Town using remote sensing and GIS techniques. Imperial Journal of Interdisciplinary Research, 3(7): 821-827.
[8] Adefisan, E.A., Bayo, A.S., Orimoloye, I.R. (2015). Application of geo-spatial technology in identifying areas vulnerable to flooding in Ibadan metropolis. Journal of Environment and Earth Science, 5(14): 153-166.
[9] Ige, S.O., Vincent, O.A., Adeyeri, O.E., Oyekan, K.S.A. (2017). Assessing remotely sensed temperature humidity index as human comfort indicator relative to landuse landcover change in Abuja, Nigeria. Spatial Information Research, 2(4): 523-533. https://doi.org/10.1007/s41324-017-0118-2
[10] Onamuti, O.Y., Emmanuel, C.O., Israel, R.O. (2017). Remote sensing appraisal of Lake Chad shrinkage connotes severe impacts on green economics and socio-economics of the catchment area. Royal Society Open Science, 4(11): 171120. https://doi.org/10.1098/rsos.171120
[11] Peter, G., Arnold, G.D. (2020). Spectral and radiometric measurement requirements for inland, coastal and reef waters. Remote Sens., 12(14): 2247. https://doi.org/10.3390/rs12142247
[12] Hannula1, H.R., Heinilä, K., Böttcher, K., Mattila, O.P., Salminen, M., Pulliainen, J. (2020). Laboratory, field, mast-borne and airborne spectral reflectance measurements of boreal landscape during spring. Earth Syst. Sci. Data, 12: 719-740. https://doi.org/10.5194/essd-12-719-2020
[13] Genuis, S.J. (2008). Fielding a current idea: exploring the public health impact of electromagnetic radiation. Public Health, 122(2): 113-124. https://doi.org/10.1016/j.puhe.2007.04.008
[14] Xiao, J., Shen, Y., Tateishi, R., Bayaer, W. (2006). Development of topsoil grain size index for monitoring desertification in arid land using remote sensing. International Journal of Remote Sensing, 27(12): 2411-2422. https://doi.org/10.1080/01431160600554363
[15] Demattê, J.A.M., Fongaro, C.T., Rizzo, R., Safanelli, J.L. (2018). Geospatial soil sensing system (GEOS3): A powerful data mining procedure to retrieve soil spectral reflectance from satellite images. Remote Sensing of Environment, 212: 161-175. https://doi.org/10.1016/j.rse.2018.04.047
[16] Aasen, H., Honkavaara, E., Lucieer, A., Zarco-Tejada, P.J. (2018). Quantitative remote sensing at ultra-high resolution with UAV spectroscopy: A review of sensor technology, measurement procedures, and data correction workflows. Remote Sensing, 10(7): 1091. https://doi.org/10.3390/rs10071091
[17] Wójtowicz, M., Wójtowicz, A., Piekarczyk, J. (2016). Application of remote sensing methods in agriculture. Communications in Biometry and Crop Science, 11(1): 31-50.
[18] Mutanga, O., Dube, T., Galal, O. (2017). Remote sensing of crop health for food security in Africa: Potentials and constraints. Remote Sensing Applications: Society and Environment, 8: 231-239. https://doi.org/10.1016/j.rsase.2017.10.004
[19] Leblanc, G., Francis, C.M., Soffer, R., Kalacska, M., De Gea, J. (2016). Spectral reflectance of polar bear and other large arctic mammal pelts; potential applications to remote sensing surveys. Remote Sensing, 8(4): 273. https://doi.org/10.3390/rs8040273
[20] Pessoa, L.G.M., Freire, M.B., Wilcox, B.P., Green, C.H., De Araújo, R.J., De Araújo Filho, J.C. (2016). Spectral reflectance characteristics of soils in northeastern Brazil as influenced by salinity levels. Environmental monitoring and assessment, 188(11): 616. https://doi.org/10.1007/s10661-016-5631-6
[21] Botha, E.J., Brando, V.E., Anstee, J.M., Dekker, A.G. (2013). Increased spectral resolution enhances coral detection under varying water conditions. Remote Sensing of Environment, 131: 247-261. https://doi.org/10.1016/j.rse.2012.12.021
[22] Gürsoy, Ö., Atun, R. (2019). Investigating surface water pollution by integrated remotely sensed and field spectral measurement data: A case study. Polish Journal of Environmental Studies, 28(4): 2139-2144. https://doi.org/10.15244/pjoes/90598
[23] Gholizadeh, M.H., Melesse, A., Reddi, L. (2016). A comprehensive review on water quality parameters estimation using remote sensing techniques. Sensors, 16(8): 1298. https://doi.org/10.3390/s16081298
[24] Liu, J.G., Hull, V., Yang, W., Vina, A., Chen, X.D., Ouyang, Z.Y., Zhang, H. (2016). Pandas and People: Coupling Human and Natural Systems for Sustainability. Oxford University Press, U.K. 2016.
[25] Zhang, Y., Giardino, C., Li, L.H. (2017). Water optics and water colour remote sensing. Remote Sens., 9(8): 818. https://doi.org/10.3390/rs9080818
[26] Lillesand, T., Kiefer, R.W., Chipman, J. (2015). Remote Sensing and Image Interpretation. John Wiley & Sons. ISBN: 978-1-118-34328-9.