Jia Huang
© 2020 IIETA. This article is published by IIETA and is licensed under the CC BY 4.0 license (http://creativecommons.org/licenses/by/4.0/).
OPEN ACCESS
With the differentiation of the furniture market, there is a growing demand for children’s furniture. The design of children’s furniture must fully consider the special cognition and preference of children, highlight environmental friendliness and health, and benefit the physical and mental development of children. These design objectives are similar to those of green furniture. Therefore, it is necessary to accurately evaluate the quality of green manufacturing, the key link of green furniture production, with the aid of the excellent data processing technique of artificial intelligence (AI). Thus, this paper summarizes the AI applications in quality testing of children’s furniture and statistical analysis on its greenness, and constructs an evaluation model for green manufacturing quality of children’s furniture. Firstly, the authors introduced the architecture of the green manufacturing system for children’s furniture, and analyzed the product lifecycle and environmental pollutions. On this basis, a complete and scientific evaluation index system (EIS) was constructed. Next, the weight coefficients of the goal layer and criteria layer were determined by the entropy method, and the initial evaluation result were provided. Finally, a comprehensive evaluation model was established for the green manufacturing quality of children’s furniture, based on backpropagation neural network (BPNN), and genetic algorithm with adaptive mutation (AMGA). The proposed EIS and model were proved effective through experiments. The research results provide a reference for the quality evaluation in other fields.
artificial intelligence (AI), children’s furniture, green manufacturing, quality evaluation
Children takes up about a quarter of the population in China. More than half of them have their own learning and living space. With the differentiation of the furniture market, there is a growing demand for children’s furniture [1-3]. Under the premise of practicality, the design of children’s furniture must fully consider the special cognition and preference of children, highlight environmental friendliness and health, and benefit the physical and mental development of children [4-7].
The design objectives of children’s furniture are similar to those of green furniture, which integrates the concept of greenness into every link of furniture production, e.g., design, material selection, manufacturing, packaging, marketing, and recycling. Green manufacturing, the most important link of furniture production, make the processes, routes, and environment of product manufacturing clean and efficient, while minimizing their environmental pollution and energy consumption [8-10].
Thanks to the rapid development of furniture manufacturing, China has grown into the largest furniture exporter in the world. Meanwhile, Europe and North America implement strict environmental regulations on furniture, which promotes furnituremakers to produce modern and largescale green furniture [11-13]. In green furniture manufacturing, the environmental problems mainly concentrate on the treatment of waste gas, wastewater and solid waste and the impact of the manufacturing environment on workers [14-16]. Ekaterinushkina et al. [17] pointed out that the furnituremakers in economically developed areas of China have optimized the structural decoration form and production mode of their products, using new production techniques and equipment, and developed towards high-tech modern manufacturing and management. Mineno et al. [18] suggested that the modern, large-scale and specialized production of green furniture must rely on high and new techniques, such as raw material demand plan, green manufacturing resource plan, flexible integrated intelligent manufacturing system, and digital design assistant system.
Many scholars have investigated the design of green furniture, and achieved fruitful results. Agha and Alnahhal [19] proposed that green furniture design must have five basic features: environmental friendliness, high resource utilization, safety, economy, and disassembly. To promote green furniture design, Winnebeck [20] stressed that the sustainable development of the furniture industry hinges on the continuous advancement of technological innovation in four manufacturing links: green design positioning, green material selection, green process improvement, and green recycling and reuse. Gouvali and Boudolos [21] evaluated the necessity of ecologicalizing furniture manufacturing from the angle of product lifecycle, empirically analyzed the greening of typical furnituremakers in China through comparative analysis, in the light of the theory of industrial ecology, and put forward countermeasures for the government, industry, enterprises, and consumers.
Quite a few foreign scholars have studied children’s green furniture. The relevant standards on furniture design and manufacturing, and environmental protection are relatively mature and stringent. For example, the Nordic Ecolabelling for Furniture and Fitments 1994 set a good precedence for the standards of children’s green furniture. Chonde et al. [22] stated that the design of children’s green furniture must focus on the age group, and pay attention to product versatility, the greenness of raw materials and coatings, and the properness of color brightness. Taking Tripp Trapp, a chair that “grows” with children, for example, Ghobakhloo et al. [23] expounded a modular design method for parts replacement and upgrading of children’s furniture, and summarized three principles for the green design and manufacturing of children’s furniture: following children’s growth, environmentally friendly materials, and space conservation. For the green design of children’s furniture, Rishmawi et al. [24] advised children’s furnituremakers to adopt the decomposable compressed solid wood panels or laminated veneer materials that are certified by Forest Stewardship Council (FSC), the relatively lightweight disassembly and assembly method of wood screws, and green packaging materials like corrugated paper or polyethylene plastic.
Currently, artificial intelligence (AI), a common data analysis method, has been widely used in various fields. The quality testing and greenness evaluation of children’s furniture generate a massive amount of data. With the help of the advantageous AI technology, it is possible to obtain analysis results on product greenness and quality more efficiently and accurately, as well as their correlations with production processes, equipment, and environment. The advanced data analysis helps to accurately predict the future trend of this manufacturing sector.
Through the above analysis, this paper summarizes the AI applications in quality testing of children’s furniture and statistical analysis on its greenness, and constructs an evaluation model for green manufacturing quality of children’s furniture. The remainder of this paper is organized as follows: Section 2 describes the architecture of the green manufacturing system for children’s furniture, analyzes the product lifecycle and environmental pollutions, constructs a complete and scientific evaluation index system (EIS), and presents the calculation methods for some indices; Section 3 determines the weight coefficients of the goal layer and criteria layer by the entropy method, and provides the initial evaluation result; Section 4 introduces backpropagation neural network (BPNN), and genetic algorithm with adaptive mutation (AMGA) to establish a comprehensive evaluation model for the green manufacturing quality of children’s furniture; Section 5 proves the scientific nature of the EIS and the effectiveness of our model through experiments; Section 6 draws the conclusions.
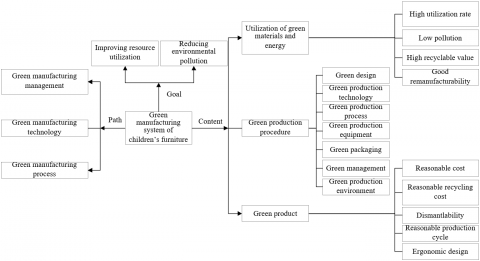
Figure 1. The architecture of the green manufacturing system for children’s furniture
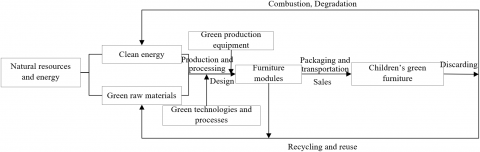
Figure 2. The changes in materials and energy in the lifecycle of children’s green furniture
Based on environmental awareness, the green manufacturing of children’s furniture aims to manufacture children’s furniture with clean and efficient production technologies and processes, meet the goals of green design and consumer demand for green products, improve resource and energy utilization, and reduce environmental pollution. Figure 1 presents the architecture of the green manufacturing system for children’s furniture. It can be seen that the green manufacturing of children’s furniture mainly covers three aspects: improving the green utilization of materials and energy, greening the production procedure, and greening the output products. The lifecycle of children’s green furniture should form a virtuous cycle. Figure 2 provides the changes in materials and energy in the lifecycle of children’s green furniture based on the procedure of output-recycling-remanufacturing.
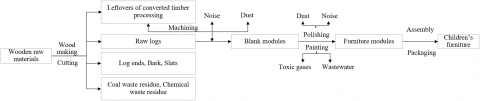
During the manufacturing of children’s furniture, the main pollutants include the dust and noise generated in the machining or polishing of converted timber, the toxic gases and solvents generated in the painting of blank modules, etc. The environmental pollutions in the manufacturing process are analyzed in Figure 3.
Figure 3. The environmental pollutions in the manufacturing of children’s furniture
Based on the architecture of the green manufacturing system of children’s furniture, as well as the analysis on product lifecycle and environmental pollutions, the following EIS was constructed to improve the evaluation accuracy of the green manufacturing quality of children’s furniture:
Layer 1 (evaluation goals)
GM={GM1, GM2, GM3, GM4}={material evaluation, design evaluation, manufacturing evaluation, packaging evaluation}
Layer 2 (index types)
GM1={GM11, GM12, GM13, GM14}={resource type, energy type, environment type, economy type}
GM2={GM21, GM22, GM23}={function type, economy type, environment type}
GM3={GM31, GM32, GM33, GM34}={resource type, energy type, environment type, economy type}
GM4={GM41, GM42, GM43}={resource type, environment type, economy type}
Layer 3 (evaluation criteria)
GM11={GM111, GM112, GM113, GM114, GM115, GM116}={material type, material utilization rate, green material utilization rate, hazardous material utilization rate, material recycling value rate, material remanufacturability}
GM12={GM121, GM122}={energy consumption, material resource-saving rate}
GM13={GM131, GM132, GM133, GM134}={pollutant emissions, pollutant type, hazard level of pollutant to human body, pollution control effect}
GM14={GM141, GM142, GM143}={material cost, pollution control investment, material recycling cost}
GM21={GM211, GM212, GM213, GM214, GM215, GM216, GM217, GM218}={product function, product quality, production cycle, product service life, structural rationality, process stability, ergonomic standardization, modularity}
GM22={GM221, GM222, GM223}={market demand, design cost, process cost}
GM23={GM231, GM232, GM233}={disassembly index, recycling index, remanufacturing index}
GM31={GM311, GM312, GM313, GM314}={equipment resource utilization rate, green manufacturing technology utilization rate, green process utilization rate, ratio of professional technicians}
GM32={GM321, GM322, GM323, GM324}={type of energy consumption, energy-saving rate, equipment resource-saving rate, clean energy utilization rate}
GM33={GM331, GM332, GM333}={energy pollution control effect, manufacturing environment state, impact of manufacturing environment on human body}
GM34={GM341, GM342, GM343}={manufacturing cost, pollution control investment, manufacturing environment management cost}
GM41={GM411, GM412, GM413, GM414, GM415, GM416}={type of packaging materials, utilization rate of packaging materials, utilization rate of green packaging materials, utilization rate of hazardous packaging materials, recycling value rate of packaging materials, remanufacturability of packaging materials}
GM42={GM421}={hazard level of packaging materials to human body}
GM43={GM431, GM432}={packaging material cost, packaging material recycling cost}
The calculation methods of some indices are introduced below.
The recycling value rate of materials and packaging material can be calculated by:
${{\eta }_{RV}}=\frac{{{c}_{R}}\times 2}{c}$ (1)
where, cR is the current estimated price of the recycled children’s furniture; c is the original price of children’s furniture. Obviously, the ηRV is in an ideal state, when the residual value of the recycled children’s furniture is more than half of the original price. In this case, the ηRV value equals 1. The remanufacturability of materials and packaging materials can be calculated by:
${{\eta }_{RM}}={{\eta }_{eco}}\cdot {{\eta }_{rep}}\left( \sum\limits_{i}^{{}}{\frac{{{\omega }_{i}}}{{{\eta }_{i}}}} \right) {{\mu }_{r}}={{\mu }_{t}}{{\mu }_{e}}$ (2)
where, ηeco is the remanufacturing economy index (if the remanufacturing is economic, ηeco=1; otherwise, ηeco=0); ηrep is the disassembly index of key parts or modules; ηi is the process indices of the remanufacturing of the recycled children’s furniture; ωi is the weight of each process relative to the overall manufacturing procedure. The process stability of children’s furniture, which characterizes the improvement of green manufacturing processes, can be calculated by:
${{\eta }_{S}}=1-\frac{\Delta {{n}_{M}}}{{{N}_{M}}}$ (3)
where, Δn is the cumulative number of changes in furniture modules or parts during the manufacturing; NM is the total number of modules or parts. The production cycle of children’s furniture can be calculated by:
${{\eta }_{PC}}=\left\{ \begin{align} & \frac{T-{{T}^{*}}}{T}\text{ 0}<\frac{{{T}^{*}}}{T}<1 \\ & \text{ }0\text{ }\frac{{{T}^{*}}}{T}>\text{1 } \\ \end{align} \right.$ (4)
where, T and T* are the manufacturing time and remanufacturing time of children’s furniture, respectively. The utilization rate of resources and energy in the manufacturing process can be characterized by the resource- and energy-saving rates:
${{\eta }_{U}}=\frac{{{\eta }_{ER}}+{{\eta }_{MR}}+{{\eta }_{ene}}}{3}$ (5)
where, ηres and ηMR are the saving rates of equipment resources and material resources, respectively; ηene is the energy-saving rate. The pollution control effect can be characterized by pollution indices:
${{\eta }_{EPC}}=\frac{{{\eta }_{A}}+{{\eta }_{W}}+{{\eta }_{SW}}+{{\eta }_{PE}}}{4}$ (6)
where, ηA, ηW, and ηSW are the reduction rates of waste gas, wastewater, and solid waste, respectively; ηPE is the pollution reduction rate induced by the use of clean energy in the manufacturing process. The service life of children’s furniture can be characterized by the durability index:
${{\eta }_{PD}}=\frac{{{T}_{DL}}}{10}$ (7)
where, TDL is the design life of children’s furniture. If TDL>10, then ηPD=1; if TDL≤4, the children’s furniture is not durable enough for remanufacturing.
In the proposed EIS, the weight coefficients of the goal layer indices were determined by the entropy method. Firstly, the original evaluation data matrices GM={GMij} were constructed based on all evaluation criteria, where GMij is the value of criterion j under goal i. The original GMs contain evaluation index data of different dimensions and magnitudes. The positive indices and negative indices were respectively normalized by:
$G{{{M}'}_{ij}}=\frac{G{{M}_{ij}}-\underset{j}{\mathop{\min }}\,G{{M}_{ij}}}{\underset{j}{\mathop{\max }}\,G{{M}_{ij}}-\underset{j}{\mathop{\min }}\,G{{M}_{ij}}}$ (8)
$G{{{M}'}_{ij}}=\frac{\underset{j}{\mathop{\max }}\,G{{M}_{ij}}-G{{M}_{ij}}}{\underset{j}{\mathop{\max }}\,G{{M}_{ij}}-\underset{j}{\mathop{\min }}\,G{{M}_{ij}}}$ (9)
Based on the normalized evaluation data matrices GM'={GM'ij}, the information entropy of GM'ij can be calculated by:
${{\tau }_{i}}=-\frac{1}{\ln I}\sum\limits_{j=1}^{m}{\left[ \left( {G{{{{M}'}}_{ij}}}/{\sum\limits_{j=1}^{J}{G{{{{M}'}}_{ij}}}}\; \right)\cdot \ln \left( {G{{{{M}'}}_{ij}}}/{\sum\limits_{j=1}^{J}{G{{{{M}'}}_{ij}}}}\; \right) \right]}$ (10)
where, I is the number of goals; J is the maximum number of evaluation criteria under each goal. Finally, the entropy weight of goal i can be calculated by:
${{\omega }_{i}}=\frac{1-{{\tau }_{i}}}{\sum\limits_{i=1}^{I}{(1-{{\tau }_{i}})}}$ (11)
In this way, a set of index weight on the goal layer was obtained as W=(ω1,ω2,…, ωi).
The data on some subjective evaluation criteria are difficult to obtain or not suitable for measurement. To weigh the relevant indices, the index weights were calculated and sorted by the autocorrelation matrix between evaluation criteria, the correlation matrix between evaluation criteria and the demands of distributors or consumers for the green manufacturing quality of children's furniture, as well as the importance of these demands. Figure 4 explains the workflow of the subjective quality evaluation.
Figure 4. The workflow of subjective quality evaluation
Firstly, the quality demands, which had been acquired through interview and questionnaire survey, were weighed and sorted. The weights were assigned by the following standard: 10 points for strongly important; 5 points for slightly important; 0 point for neutral; -5 points for slightly unimportant; 10 points for strongly unimportant. After the quality demands were matched with evaluation criteria, the authors constructed the autocorrelation matrix between evaluation criteria, and the correlation matrix between quality demands and evaluation criteria. The correlation degree was characterized in six levels: no correlation, strongly weak correlation, slightly weak correlation, general, slightly close correlation, and strongly close correlation. The importance of the weight of each evaluation criterion can be calculated by:
$W{{I}_{ij}}=\sum\limits_{k=1}^{K}{{{r}_{ijk}}\times {{\rho }_{k}}}$ (12)
where, rijk is the degree of correlation between the quality demand of distributor/consumer k and the evaluation criterion j under goal i; ρk is the importance of the quality demand of distributor/consumer; K is the total number of quality demands of distributor/consumer. The absolute weight of an index is positively correlated with its impact on and correlation with other indices. The absolute weight can be calculated by:
$A{{W}_{ij}}=W{{I}_{ij}}+\sum\limits_{l=1,l\ne j}^{J}{W{{I}_{il}}\times \left| {{\sigma }_{il}} \right|}$ (13)
where, σ is the correlation coefficient between indices. Then, the relative weight of each evaluation criterion can be modified through normalization:
${{\omega }_{ij}}=\frac{A{{W}_{ij}}}{\sum\limits_{j=1}^{J}{A{{W}_{ij}}}}$ (14)
Hence, the weights of evaluation criteria for the green manufacturing quality of children’s furniture can be summarized as a set W'=(ωi1,ωi2,…,ωiJ).
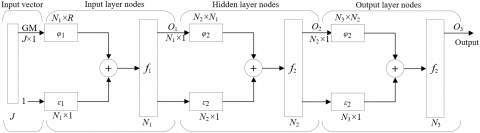
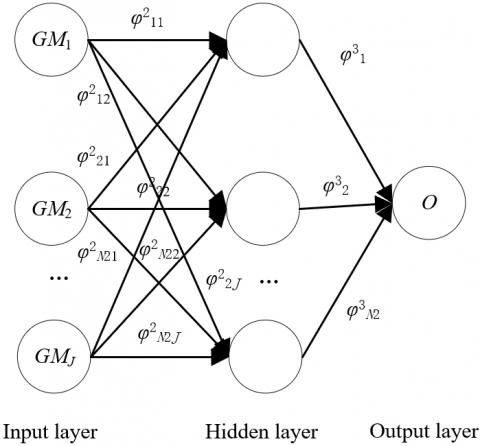
Considering the nonlinear correlations between quality demands and evaluation criteria, this section aims to minimize the subjectivity in evaluation result, so that the evaluation can reflect the true green manufacturing quality of children’s furniture. Based on the results of the preceding sections, BPNN and AMGA were introduced to build up a comprehensive evaluation model for the green manufacturing quality of children’s furniture. Figure 5 provides the vector form of the multi-layer BPNN in MATLAB.
Figure 5. The vector model of multi-layer BPNN
Taking the original evaluation data matrices as the input vectors of the BPNN, the column vectors can be expressed as:
$G{{M}_{ij}}=\left[ G{{M}_{i1}},G{{M}_{i2}},\ldots ,G{{M}_{iJ}} \right]$ (15)
Let N1 be the number of input layer nodes. Then, the bias vector of input layer nodes can be expressed as:
${{\varepsilon }_{1}}=\left[ \varepsilon _{1}^{1},\varepsilon _{2}^{1},\ldots ,\varepsilon _{{{N}_{1}}}^{1} \right]$ (16)
The connection weights between input vectors and input layer nodes can be described as vectors:
${{\phi }_{1}}=\left[ \begin{align} & \phi _{11}^{1} \text{ }\phi _{12}^{1} ... \phi _{1J}^{1} \\ & \phi _{21}^{1} \text{ }\phi _{22}^{1} ... \phi _{2J}^{1} \\ & ... \text{ }... \text{ }... ... \\ & \phi _{{{N}_{1}},1}^{1} \phi _{{{N}_{1}},2}^{1} ... \phi _{{{N}_{1}}J}^{1} \\ \end{align} \right]$ (17)
Under the activation function of f1(⁎), the output of input layer nodes can be expressed as:
${{O}_{1}}={{f}_{1}}\left( {{\phi }_{1}}G{{M}_{ij}}+{{\varepsilon }_{1}} \right)$ (18)
Similarly, the output of hidden layer nodes can be expressed as:
${{O}_{2}}={{f}_{2}}\left( {{\phi }_{2}}{{O}_{1}}+{{\varepsilon }_{2}} \right)$ (19)
The final output of the BPNN can be expressed as:
$O={{f}_{3}}\left( {{\phi }_{3}}{{O}_{2}}+{{\varepsilon }_{3}} \right)$ (20)
In the traditional genetic algorithm (GA), the population diversity is improved through mutation. Here, adaptive optimization is performed at the mutation probability obtained by experiments:
$G=\left(G_{1}+G_{2}\right) / 2$
$=\left(\begin{array}{l}G_{0}-\left(G_{0}-G_{\min }\right) * n_{\text {evo }} / N_{\text {ev }} \\ +G_{0} * \max _{p_{i} \in \Omega} \text { Fitness }\left(p_{k}\right) / \text { Fitness }\end{array}\right) / 2$ (21)
where, Nevo and nevo are the maximum and current number of iterations of the population, respectively; Fitness is the fitness of the population; G1 and G2 are inversely proportional to the number of iterations and the mean fitness, respectively; G0 and Gmin are the preset initial mutation probability and the minimum allowable mutation probability, respectively.
The genetic coding was performed based on the proposed BPNN. Let φij be connection weights and εi be thresholds. The genetic codes can be obtained as (φ211, φ212, …, φ21J, ε21, φ221, φ222, …, φ22J, ε22, …, φ2N21, φ2N22, …, φ2N2J, ε2N2, φ31, …, φ3N2, ε3N2) (Figure 6). The code length is L=N1*N2+N2*1+N2+1.
Figure 6. The genetic coding of the BPNN
Suppose the population size is initially 40. Then, the training error of individuals in the population can be calculated by:
$E=\frac{\sum\limits_{r=1}^{R}{\left( {{O}_{r}}-{{{\hat{O}}}_{r}} \right)}}{2}$ (22)
The fitness function can be defined as:
$Fitness=\frac{1}{E}$ (23)
where, R is the total number of training samples; Or-Ôr is the error in the evaluation result outputted based on the r-th data sample. In genetic operations, the selection probability of an individual is the fitness of the weights and thresholds of the BPNN as a proportion of the total fitness:
$P\left( {{p}_{k}} \right)=\frac{Fitness\left( {{p}_{k}} \right)}{\sum\limits_{k=1}^{40}{Fitness\left( {{p}_{k}} \right)}}$ (24)
Next, the cumulative probability was calculated to judge whether a selected individual could be retained for the next generation:
${{P}^{*}}\left( {{p}_{d}} \right)=\sum\limits_{j=1}^{d}{P\left( {{p}_{k}} \right)}$ (25)
where, P*(pd) is the cumulative probability of individual pd.
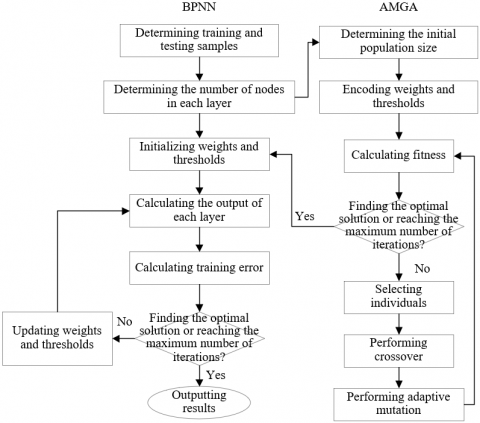
Through the above genetic operations, the population was updated, and the training error and fitness were calculated. Next, the above steps were repeated until the new population tended to be stable. The training of the comprehensive evaluation model is detailed in Figure 7.
Figure 7. The training of the comprehensive evaluation model
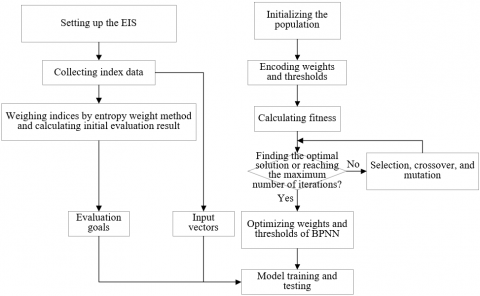
As shown in Figure 7, the first step is to determine the number of nodes in each layer of the BPNN and the initial population size of the GA according to the data samples for the evaluation of green manufacturing quality of children’s furniture. Then, the weights and thresholds of the BPNN were optimized through genetic coding, and the calculation of training error, fitness, and cumulative probability by (16)-(19), making the BPNN faster in convergence. Once the training error reached the preset threshold or the maximum number of iterations was reached, the training of the model was terminated. Figure 8 describes the evaluation procedure of the comprehensive evaluation model. The specific steps of the evaluation are as follows:
Step 1. Analyze the evaluation criteria for the green manufacturing quality of children’s furniture to obtain the initial evaluation result. Then, improve the current manufacturing model based on the optimization strategies and suggestions, and perfect the EIS.
Step 2. Collect the sample data again, adjust the evaluation indices as per the actual condition of the target enterprise, and divide the samples into a training set and a test set.
Step 3. Determine the topology of the BPNN algorithm, and initialize the maximum number of iterations, learning rate, error threshold, and activation function.
Step 4. Import the training samples into the BPNN, and iteratively train the weights and thresholds with the aid of the AMGA.
Step 5. Import the test samples, and judge whether the training effect of the comprehensive evaluation model meets the requirements. If the prediction error fails to reach the termination condition, go back to Step 3; otherwise, go to the next step.
Step 6. Import the evaluation samples to the comprehensive evaluation model to obtain the evaluation result on the green manufacturing quality of children’s furniture.
Figure 8. The evaluation procedure of the comprehensive evaluation model
Contrastive experiments were designed to verify the reasonability of the initial population size set for the AMGA. The population size was set to 10, 20, 30, 40, 50, and 60, in turn. Then, the convergence time and training error of our model were recorded. Table 1 shows the influence of initial population size on model performance. It can be seen that the convergence time of our model increased with the population size. There was not much difference in convergence time, when the population size was 10, 20, 30, and 40. Since the training error minimized at the population size of 40, it is reasonable to initialize the population size as 40.
Table 1. The influence of initial population size on model performance
|
Population size |
Convergence time |
Training error |
|
10 |
175.33ms |
0.2043 |
|
20 |
184.52ms |
0.2167 |
|
30 |
257.24ms |
0.2761 |
|
40 |
267.03ms |
0.2084 |
|
50 |
390.42ms |
0.3266 |
|
60 |
411.32ms |
0.4707 |
To realize effective evaluation, the number of nodes on each layer must be configured properly. The number of input layer nodes was determined as the number of evaluation criteria. The number of hidden layer nodes was derived by empirical formula. Table 2 shows the influence of the number of hidden layer nodes on model performance. It can be seen that the model had the minimum training error, when there were 16 nodes on the hidden layer. One node was deployed on the output layer, because the model outputs only one evaluation result on the green manufacturing quality of children’s furniture.
Table 2. The influence of the number of hidden layer nodes on model performance
|
Number of hidden layer nodes |
Training error |
|
10 |
0.6461 |
|
11 |
0.5832 |
|
12 |
0.6784 |
|
13 |
0.7097 |
|
14 |
0.5478 |
|
15 |
0.4967 |
|
16 |
0.4927 |
|
17 |
0.5476 |
|
18 |
0.7762 |
|
19 |
0.7869 |
|
20 |
0.7910 |
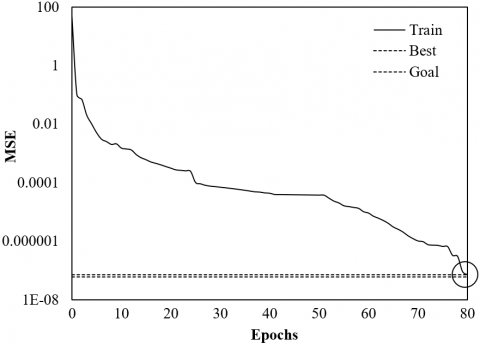
MATLAB was adopted to realize the comprehensive evaluation of the green manufacturing quality of children’s furniture based on entropy method and the BPNN optimized by the AMGA. Figure 9 compares the training error curve before and after AMGA optimization. It can be seen that the output of our model reached the optimal state, i.e., the target state, in 82 iterations, before the BPNN was optimized by AMGA; after the optimization, it only took 19 iterations for our model to reach the optimal state. The convergence accuracy of our model was more than doubled by the AMGA optimization.
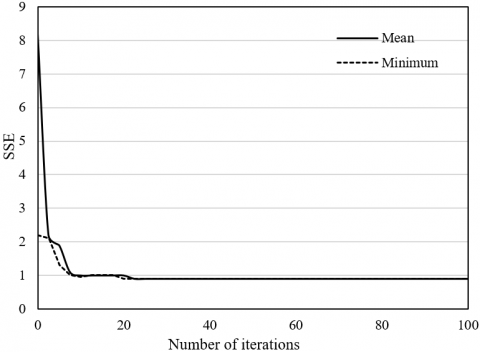
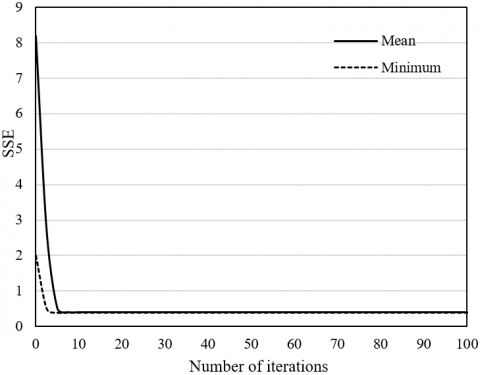
Figure 10 compares the convergence curves of our model before and after the optimization by the AMGA. It can be seen that, before optimization, the mean and minimum training errors stabilized at 0.95 after 23 iterations; after optimization, the network tended to be stable at 0.56 after 7 iterations. The convergence performance was improved by more than 69.5%, and the global optimal solution could be found more rapidly, through the optimization by the AMGA.
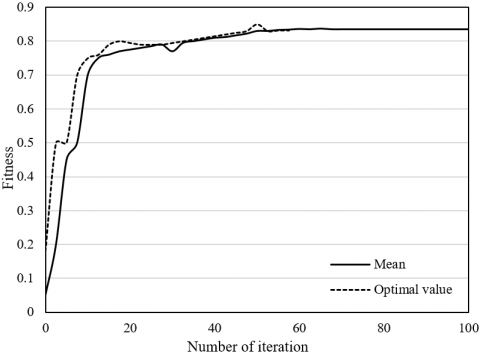
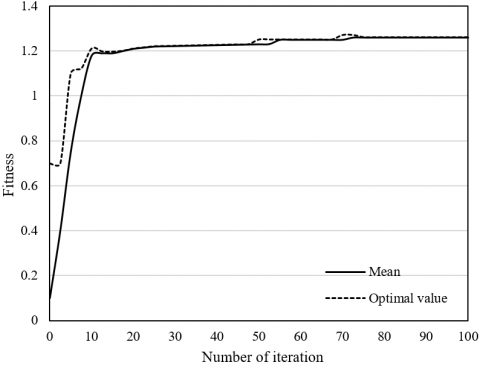
Figure 11 compares the fitness curves before and after the optimization by the AMGA. It can be seen that, before optimization, the mean and optimal fitness values of our model stabilized at 0.835 after 60 iterations; after optimization, these values stabilized at 1.28 after only 30 iterations. Therefore, the optimized model has relatively strong adaptability.
Figure 9. The training error curves before (a) and after (b) the optimization by the AMGA
Note: MSE is short for mean squared error.
Figure 10. The convergence curves before (a) and after (b) the optimization by the AMGA
Note: SSE is short for sum of squared errors.
Figure 11. The fitness curves before (a) and after (b) the optimization by the AMGA
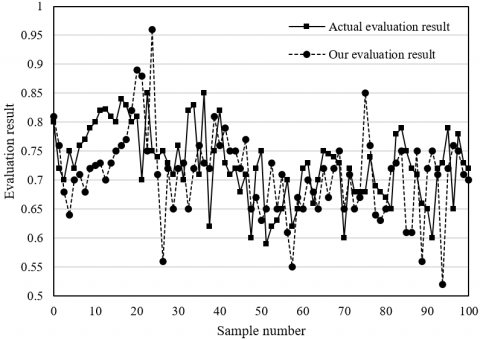
To verify the effectiveness of our model in evaluating the green manufacturing quality of children’s furniture, contrastive experiments were designed on 100 groups of test samples. Figure 12 compares the evaluation results of the models with and without AMGA optimization. It can be seen that the unoptimized model had the larger prediction error, while the optimized model output closer evaluation result to the actual evaluation result.
Figure 12. The evaluation results before (a) and after (b) the optimization by the AMGA
Figure 13 compares the evaluation accuracies between BPNN, GA+BPNN, and our model. It can be seen that the optimized model achieved better evaluation accuracy than traditional models. This testifies the high application value and effectiveness of our model.
Figure 13. The evaluation results of different models
Table 3 compares the mean accuracies of the above three models. It can be seen that BPNN and GA+BPNN achieved a mean accuracy of 85.73% and 90.21%, respectively, on the 100 groups of test samples. The accuracy of our model averaged at 97.89%, 14.18% higher than that of BPNN, and 8.5% higher than that of GA+BPNN. The results fully reflect the superiority of our model in evaluating the green manufacturing quality of children’s furniture.
Table 3. The evaluation accuracies of different models
|
Model |
Mean accuracy |
|
BPNN |
85.73% |
|
GA-BPNN |
90.21% |
|
Our model |
97.89% |
This paper firstly summarizes the applications of AI in quality testing of children’s furniture and statistical analysis on its greenness, and then builds up an evaluation model for green manufacturing quality of children’s furniture. Firstly, a complete and scientific EIS was established based on the architecture of the green manufacturing system for children’s furniture, as well as the product lifecycle and environmental pollutions in the manufacturing process. Secondly, the weight coefficients were assigned to the indices on the goal layer and criteria layer by the entropy method. Afterwards, a comprehensive evaluation model was established for the green manufacturing system of children’s furniture, on the basis of the BPNN optimized by AMGA. Finally, the initial population size and number of nodes on each layer of the BPNN were rationalized through MATLAB simulations. Contrastive experiments show that our model boasts high convergence accuracy and strong adaptability, and outshines traditional models in evaluation accuracy. The proposed model has high application value and effectiveness.
[1] Salvador, C. (2018). Human interaction, emotion and sustainability: Designing wooden children’s furniture. International Conference on Applied Human Factors and Ergonomics, FL, USA, pp. 599-606. https://doi.org/10.1007/978-3-319-94706-8_63
[2] Bai, C., Satir, A. (2020). Barriers for green supplier development programs in manufacturing industry. Resources, Conservation and Recycling, 158: 104756. https://doi.org/10.1016/j.resconrec.2020.104756
[3] Schwarzer, E., Scheithauer, U., Brosche, M., Richter, H. J., Moritz, T. (2017). Deep drawing of ceramic green tapes–a promising technology for producing new lightweight non-planar kiln furniture. Journal of Ceramic Science and Technology, 8(1): 169-175. https://doi.org/10.4416/JCST2016-00106
[4] Dotson, S. (2015). Green furniture: An assesment of furniture society member work. Journal of Green Building, 10(3): 47-66. https://doi.org/10.3992/jgb.10.3.47
[5] Kaur, J., Sidhu, R., Awasthi, A., Chauhan, S., Goyal, S. (2018). A DEMATEL based approach for investigating barriers in green supply chain management in Canadian manufacturing firms. International Journal of Production Research, 56(1-2): 312-332. https://doi.org/10.1080/00207543.2017.1395522
[6] Yacob, P., Maludin, N., Aziz, N.S., Nodesan, S., Zin, A.W.M., Keong, L.E. (2018). Acceptability of sustainable green practices: Perception of electrical & electronics manufacturing SMEs. Chemical Engineering Transactions, 63: 319-324. https://doi.org/10.3303/CET1863054
[7] Wang, X., Chen, L., Dan, B., Wang, F. (2018). Evaluation of EDM process for green manufacturing. The International Journal of Advanced Manufacturing Technology, 94(1-4): 633-641. https://doi.org/10.1007/s00170-017-0892-y
[8] Scheithauer, U., Schwarzer, E., Tscharntke, F., Schmidt, T., Jegust, S., Richter, H.J., Moritz, T., Michaelis, A. (2015). New lightweight kiln furniture made by combination of ceramic green tapes and extrudates. Interceram-International Ceramic Review, 64(4-5): 204-208. https://doi.org/10.1007/BF03401124
[9] Tamthintha, P., Palaprom, K., Nawattanaprasert, K. (2018). A study on perceptions of preschool Children’s furniture design: Pictorial stimuli experiment. MATEC Web of Conferences, 204: 01003. https://doi.org/10.1051/matecconf/201820401003
[10] Ning, S., Li, X. (2019). A scientometric review of emerging trends in green manufacturing. International Conference on Management Science and Engineering Management, Ontario, ON, Canada, pp. 234-247. https://doi.org/10.1007/978-3-030-21248-3_17
[11] Ma, C. (2020). Comparison of cooperation modes in a two-period closed-loop supply chain system considering green manufacturing. Mathematical Problems in Engineering, 2020: 9202370. https://doi.org/10.1155/2020/9202370
[12] Brinyuk, I.A., Radchenko, V.Y. (2018). Design features of developing modular furniture for children. GraphiCon 2018-28th International Conference on Computer Graphics and Vision, pp. 406-408.
[13] Bhat, A., Barnett, S. (2018). Casting simulation: An aid to green manufacturing. 73rd World Foundry Congress "Creative Foundry", WFC 2018 - Proceedings, pp. 545-546.
[14] Singh, S., Haldar, N., Bhattacharya, A. (2018). Offshore manufacturing contract design based on transfer price considering green tax: A bilevel programming approach. International Journal of Production Research, 56(5): 1825-1849. https://doi.org/10.1080/00207543.2016.1144940
[15] Gandhi, N.S., Thanki, S.J., Thakkar, J.J. (2018). Ranking of drivers for integrated lean-green manufacturing for Indian manufacturing SMEs. Journal of Cleaner Production, 171: 675-689. https://doi.org/10.1016/j.jclepro.2017.10.041
[16] Marchese, D.C., Bates, M.E., Keisler, J.M., Alcaraz, M.L., Linkov, I., Olivetti, E.A. (2018). Value of information analysis for life cycle assessment: Uncertain emissions in the green manufacturing of electronic tablets. Journal of Cleaner Production, 197: 1540-1545. https://doi.org/10.1016/j.jclepro.2018.06.113
[17] Ekaterinushkina, A.V., Zhdanova, N.S., Mishukovskaya, J.I. (2018). Study of functional features of furniture and equipment in the design of recreation of children's polyclinics. International Multi-Conference on Industrial Engineering and Modern Technologies, pp. 032028-032028. https://doi.org/1088/1757-899X/463/3/032028
[18] Mineno, A., Takemiya, K., Bae, M. (2018). Questionnaire research to clarify utilization of users' place and furniture in day-service centers for children with severe motor and intellectual disabilities. AIJ Journal of Technology and Design, 24(58): 1155-1160.
[19] Agha, S.R., Alnahhal, M.J. (2012). Neural network and multiple linear regression to predict school children dimensions for ergonomic school furniture design. Applied Ergonomics, 43(6): 979-984. https://doi.org/10.1016/j.apergo.2012.01.007
[20] Winnebeck, K.H. (2011). An abbreviated alternatives assessment process for product designers: a children’s furniture manufacturing case study. Journal of Cleaner Production, 19(5): 464-476. https://doi.org/10.1016/j.jclepro.2010.10.008
[21] Gouvali, M.K., Boudolos, K. (2006). Match between school furniture dimensions and children's anthropometry. Applied Ergonomics, 37(6): 765-773. https://doi.org/10.1016/j.apergo.2005.11.009
[22] Chonde, S., Julaiti, J., Agrawal, D., Chen, C.B., Kumara, S. (2020). Mapping keywords within smart, green, and sustainable manufacturing literature. 2016 Industrial and Systems Engineering Research Conference, Anaheim, United States, pp. 1174-1179.
[23] Ghobakhloo, M., Azar, A., Fathi, M. (2018). Lean-green manufacturing: the enabling role of information technology resource. Kybernetes, 47(9): 1752-1777. https://doi.org/10.1108/K-09-2017-0343
[24] Rishmawi, I., Salarian, M., Vlasea, M. (2018). Tailoring green and sintered density of pure iron parts using binder jetting additive manufacturing. Additive Manufacturing, 24: 508-520. https://doi.org/10.1016/j.addma.2018.10.015