Salah Khennouf | Mounir Bouras*
© 2022 IIETA. This article is published by IIETA and is licensed under the CC BY 4.0 license (http://creativecommons.org/licenses/by/4.0/).
OPEN ACCESS
In this paper, we have proposed a new design, to enhance and simulate a Highly Sensitive Mach-Zehnder Interferometer (MZI) Biochemical sensing platform using a Silicon Rib Waveguide. We considered two different MZI configurations: the first one with an S-bend & Y-junction and the second with an angular Y-junction. We determined the critical cut-off radius and the critical cut-off angle for the S-bend & Y-junction and the angular Y-junction configurations respectively. Based on the analyses of the evanescent field intensity, the mode polarization and cross section dimensions of the Silicon Rib waveguide are optimized using beam propagation method. The critical parameters of the design are calculated to ensure minimal optical losses and a new sensitivity value of 308 dB/RIU with a detection limit of 10-7, which shows the ability of the structure to produce biosensor.
biochemical sensor, optical waveguide, Mach-Zehnder Interferometer (MZI), Silicon-On-Insulator (SOI)
A sensor is an analytical device that can convert biomolecule binding events into thermal, mechanical, optical, or electrical signal. Depending on the type of the obtained signal, the biosensor can be classified as: thermal biosensor, mechanical biosensor, optical biosensor or electrical biosensor. Among the viable biosensing methods, optical methods are in advance due to their dependability and high sensitivity, as well as their high potential for chip-scale integration and a multi-sided sensing platform that includes the ability to manipulate and trap at the nanometer scale.
The integrated optical waveguide sensors in different structures have been reported recently, such as: the surface Plasmon resonator [1], Bragg grating based F-P microcavity [2, 3], PhC microcavity [4, 5], resonator based micro-disk [6, 7], micro-ring resonator [8, 9] and MZI [10, 11]. Among these waveguide sensors, the MZI sensor has another high-sensitivity device, which can be used as a biosensor. In this paper, we have focused on an MZI configuration waveguide with Y-junction -3dB coupler that has shown to overcome these challenges [12]. The design consists of two Y-junction couplers connected to a sensor and a reference arm [13].
The guiding light in a conventional MZI sensor configuration is divided into two arms: the first one with light path containing sample and the other one acting as a reference. If one branch is used in such that analytic molecules can be specifically adsorbed on it, the guided light in that branch will be phase-shifted due to the disturbance of its effective refracting index. The second Y-junction links the two branches, which then interfere with one another [14].
Currently, with the development of CMOS generation, many researchers are now focusing on the combination of the MZI onto the micro/nano platforms. Several integrated MZIs, such as tapered optic fiber [14], porous silicon [13], and silicon nitride waveguide [12], have been widely used in biosensing due to their advantages of low detection limit and high sensitivity. However, the fabrication process is time-consuming and quite expensive.
The aim of this study is to fabricate an MZI device for biochemical sensing using the Silicon-On-Insulator (SOI) resist. This latest is a promising material for realizing a low-loss optical waveguide due to its extremely high refractive index contrast. In addition, high-sensitivity sensors have been realized using SOI-based slot waveguides [12] and nanowire waveguides [9]. Because of its high optical transparence, the SOI is used as a waveguide material in a variety of integrated optical components [10]. The majority of these components, however, are designed for multimode transmission or straight single-mode wave guiding. In the current study, a single mode transmission with a Y-junction component is required for a high-sensitivity MZI biosensor [15].
In this work, we conducted a series of simulations on various structure dimensions and discovered that monomode waveguides do indeed provide high-sensitivity biosensors. We obtained optimal dimensions for an MZI configuration R with high sensitivity in the form of low optical losses during light propagation during this series of simulations. The waveguides’ dimensions have also been presented. The obtained results showed that a variety of waveguide dimensions could be used to achieve monomode propagation. In the future, the low-cost, high-sensitivity polymer MZI chip will benefit many applications in environmental, industrial, and biological detection.
In general, the basic operating principle of these structures for sensing purposes is simple: the optical path is divided into two paths, each of which will change phase due to the interaction (or lack thereof) of the target analyst; the two paths are then reassembled, and the interference signal provided will be displayed. Figure 1 depicts the MZI-based sensor in detail, revealing that the access waveguide has been split in two and that only one of them will communicate with the target analysts.
Figure 1. The MZI configuration
At the output, the conflict among light from both arms is given by:
$I_{\text {out }}=\frac{I_{\text {in }}}{2}(1+\cos (\Delta \varphi))$ (1)
where, $I_{\text {out }}$ and $I_{i n}$ are the output and the input power intensities respectively.
Δφ is a phase difference between both transmission modes due to variations in the optical length, which includes changes in the refractive index of the biosensing arm when detection is performed and provided by:
$\Delta \varphi=\frac{2 \pi}{\lambda} L \Delta n$ (2)
The MZI sensor’s sensitivity is typically defined as a phase change over the variation of the natural index to a specific device length, and it is given by:
$S=\frac{\Delta \varphi}{\Delta n I}$ (3)
∆n is the environmental index change. L is the length of device region or biosensing region.
3.1 Dimensional optimization of waveguide sections
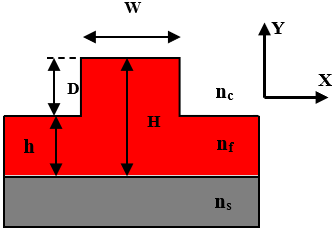
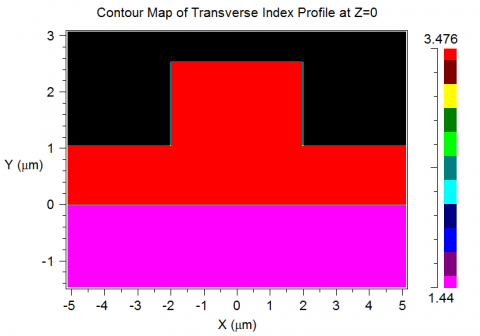
In this paper, the Silicon rib waveguides with cross section will be confined by single mode conditions. Once the mode distributions have been solved using the RSoft CAD tool, they are tested using the simulation software BeamPROP [16]. Figure 2 shows the designed SOI rib waveguides with a large cross section.
Figure 2. SU-8 waveguide index profile using Rsoft CAD
BeamPROP is a powerful tool that may be used to build and compute waveguides and other optical devices. The BeamPROP package is used to create a broad simulation tool for computing light wave propagation in any waveguide designs. The program’s computational core is based on the finite difference beam propagation method (BPM).
The height (H) of the Silicon rib waveguide is set to 3 μm, and the operating wavelength is set to 1.55 μm, so that the refractive index of SiO2 and silicon are 1.44 and 3.48, respectively, to provide good coupling efficiency with the standard single-mode waveguide.
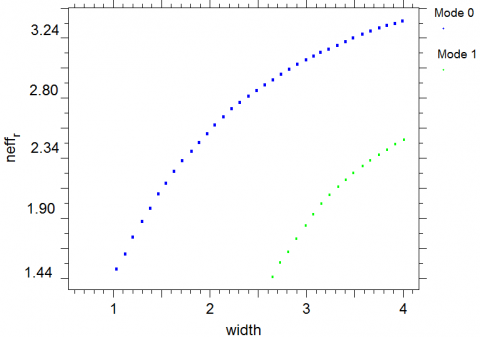
The designed MZI is scanned across the width and height to calculate the number of modes using BeamPROP’s mode computation function. The graph created in Figure 3 shows the many modes that exist for the planned waveguide at various widths [17-19].
Figure 3. Computation mode using BeamPROP simulation
The MZI is scanned while maintaining a constant height, and the modes are determined across the waveguide’s width. The graph in Figure 3 illustrates a trend in which the number of modes increases as the width increases. The actual modes in the waveguide are determined by modeling of the proposed waveguide; Figure 4 shows the basic mode. The number of modes in the waveguide increases as the width and height increase.
The fundamental mode, shown in Figure 4, is a transverse mode profile with maximum power transmitted through the center. The center represents the core with the highest power carrying capacity, through which the Gaussian power is launched Figure 4 shows the difference in the change of the index profile of the Gaussian launch power. The radiation into the cladding can be seen. As we progress to higher modes, the amount of radiation increases. The power loss is known from the radiation and is minimal because most of the light couples in the waveguide core.
(a) TE mode
(b) TM mode
Figure 4. Different mode calculations using BeamPROP for (SOI) rib waveguide
3.2 Chemical / Biological MZI sensor design
The beam combiner and the beam splitter, which are both waveguide branches and are often identical, are the most critical components of the waveguide MZI biosensor design. The MZI configuration reads the evanescent field sensing [16]. The following step is to optimize the MZI structures.
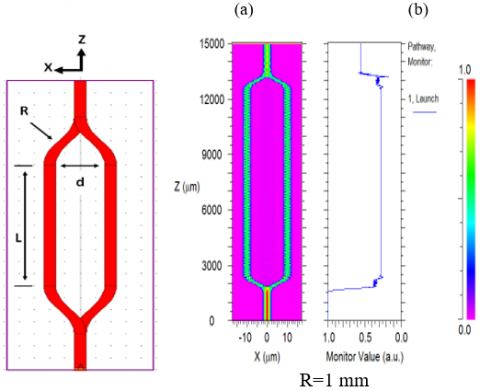
Two distinct geometries (S-bend of radius R and Y-junction of angle θ) are used in the simulations (see Figure 5 & Figure 6). The waveguides’ dimensions were chosen so that the diameters h = 4 nm and w = 4μm.
Figure 5. The MZI Y-junction a) Transverse electric field (b) Variation of power
Figure 6. The MZI S-bend a) Transverse electric field. (b) Variation of power
The Y-branch structure in an MZI device splits the light and recombines it. When building a Y-junction with a constant arm length L, the S-bend configuration exhibits less loss than an angle configuration. The angular loss is 0.56 dB/cm for length L=10 mm, while the S-bend loss is 0.40 dB/cm. When such simulations were repeated for various dimensions, the best results were observed for S-bends with R>5 mm and an angular bends with θ < 2.51°.
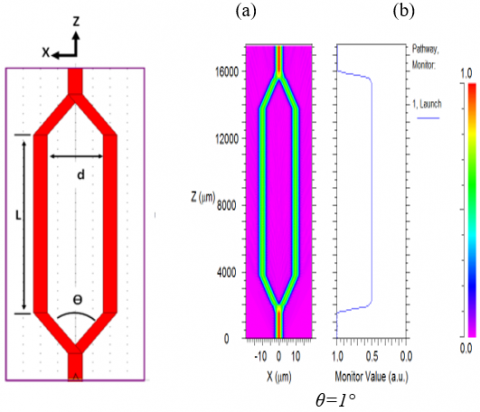
According to the above analysis and results, the schematic of the MZI sensing platform based on SOI rib waveguide with large cross section is illustrated in Figure 7.
Figure 7. The SOI rib waveguide mode propagating along the sensing arm and the reference arm. (a) Schematic of the MZI sensing platform. (b) Normalized power
The transmitted light is coupled into an optical power meter at the output of the sensor chip, and the read out is collected by the computer connected to it. Three main types of sensing experiments were carried out.
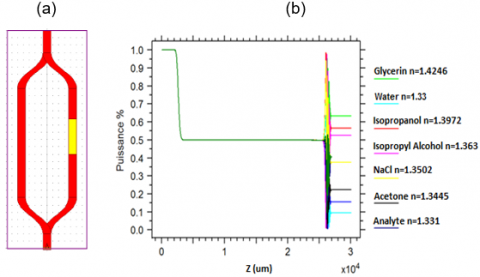
4.1 Structure functionality estimation
In order to estimate the structure's functionality, the sensor is immerged in a sample of a liquid. The simulation is carried out by adjusting the RI of the arm sensor from 1.33 to 1.4246. Figure 8 clearly illustrates the results of all solutions plotted in different colors at the same time. As shown in this figure, the equivalent variations in output power for the seven samples are 6.1 dB, 8.7 dB, 11.0 dB, 14.6 dB, 16.6 dB, 18.8 dB, and 20.7 dB, respectively. According to the variation of RI, illustrated in Figure 9, the output variation may be described as steadily linear across the entire measuring range.
Figure 8. The variation of propagation power with the refractive index at sensing lengths SA=10 mm
4.2 Continuous operation of the improved MZI sensor
The objective of this simulation is to test the continuous operation of the improved MZI sensor. For this purpose, we have used the refractive index of deionized (DI) water (1.3325) as a reference, and different concentrations of the NaCl solutions (0 g/l, 60 g/l, 120 g/l, 180 g/l, 240 g/l, 300 g/l, and 360 g/l). For application purposes, the function of n was fitted using the Sellmeier equation [15] in the wavelength range of 1.55 µm and the NaCl concentration range of 0–360 g/L.
The refractive index n of NaCl solution concentrations increases with wavelength 1.55 µm. The NaCl has a higher refractive index than water, and it is noted from Table 1 that the higher the NaCl concentration, the higher is the n of the NaCl solution [15].
Table 1. The R.I. of aqueous NaCl solution calculation
|
NaCl concentration |
Refractive index n |
|
0 g/l |
1.321 |
|
60 g/l |
1.329 |
|
120 g/l |
1.337 |
|
180 g/l |
1.345 |
|
240 g/l |
1.353 |
|
300 g/l |
1.361 |
|
360 g/l |
1.375 |
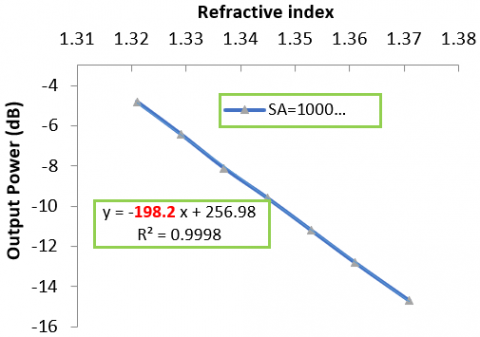
The interfered intensity of the MZI biosensor is shown in Figure 9 when one branch is soaked in NaCl solutions of different concentrations. The standard deviation of the simulations and the linear fitting lines of the sensitivity level with respect to the refractive index are also plotted in this figure. The regression equation can be expressed likewise:
$S=-198.2 n+256.98$ (4)
where, S is the sensitivity, and n is the liquid refractive index: 1.372 > n >1.321. The linearity of the S curve is approximately 0.9998, indicating that the biosensor has a high linearity. Figure 9 shows that the output intensity decreases with the NaCl concentration (or refractive index).
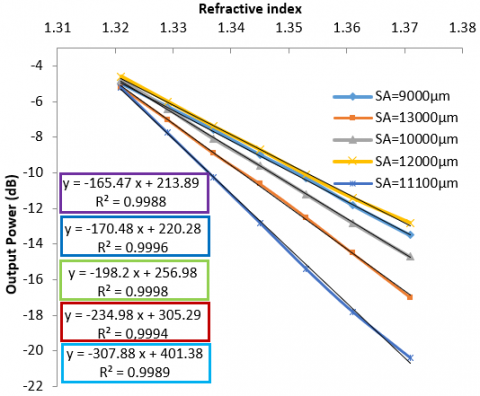
Figure 9. The variation of propagation power with the refractive index at sensing lengths SA=9 mm, SA=10 mm, SA=11.1 mm, SA=12 mm and SA=13 mm
4.3 Optimal sensing length for performance enhancement
The lengths of the sensing arms in biosensing are an important parameter that should be properly designed in order to increase the sensing performance in the MZI waveguide sensors. For validating the proposed design concerning the sensing length for performance enhancement, this simulation has been conducted. Among the used sensing lengths (9 mm, 10 mm, 11.1 mm, 12 mm, 13 mm), it has been found that the sensing length of 11.1 mm has given the highest intensity as shown in Figure 9. Table 2 shows a comparison of the sensor proposed in this work with those proposed elsewhere. In comparison with other biosensor using MZI waveguide, our designed sensor has higher sensitivity (Table 2).
Table 2. Comparison of the proposed sensor with various MZI waveguide
|
References |
Material |
Waveguide type |
Sensitivity (dB/RIU) |
Detection Limit |
|
[12] |
Polymer |
Rectangle |
___ |
<10-3 |
|
[14] |
Si/SiO2/Si3N4 |
Rectangle |
93.4 |
10-7 |
|
[15] |
Polymer |
Rectangle |
225.4 |
10-6 |
|
This work |
SOI |
Rib |
307.88 |
10-7 |
The SOI rib waveguide was used to build an MZI device for biochemical sensing. A single-mode transmission of the guiding light in the MZI chip is required for higher detection sensitivity. This work reported on a comprehensive improvement in the performance of the MZI waveguide sensor, including the optimization of the dimensions of the SOI rib waveguide, structure functionality, and sensing arm length.
The dimensions of the SOI rib waveguide are optimized using BPM simulations in order to maximize the evanescent field intensity. With an optimized sensing length of 11.1 mm, this device has revealed a linear response to the refractive sensing of analytic solutions in the RI range of 1.31 to 1.42. At an operating wavelength of 1.55 µm, the optimizing approach can achieve a homogeneous sensitivity of 308 dB/RIU. The MZI sensor can reach a detection limit of 10-8 RIU.
[1] Cooper, M.A. (2002). Optical biosensors in drug discovery. Nature reviews Drug Discovery, 1(7): 515-528. https://doi.org/10.1038/nrd838
[2] Kahlouche, A., Bouras, M., Hocini, A. (2022). Design of a thickness sensor based on a one-dimensional phononic crystal. Instrumentation Mesure Métrologie, 21(3): 109-112. https://doi.org/10.18280/i2m.210303
[3] Mandal, H., Mondal, U., Bera, S.C. (2021). Study of a modified obstruction free pressure sensor based flow transducer using hall sensors. Instrumentation Mesure Métrologie, 20(3): 143-151. https://doi.org/10.18280/i2m.200304
[4] Lindquist, N.C., Lesuffleur, A., Im, H., Oh, S.H. (2009). Sub-micron resolution surface plasmon resonance imaging enabled by nanohole arrays with surrounding Bragg mirrors for enhanced sensitivity and isolation. Lab on a Chip, 9(3): 382-387. https://doi.org/10.1039/B816735D
[5] Rodriguez, G.A., Ryckman, J.D., Jiao, Y., Weiss, S.M. (2014). A size selective porous silicon grating-coupled Bloch surface and sub-surface wave biosensor. Biosensors and Bioelectronics, 53: 486-493. https://doi.org/10.1016/j.bios.2013.10.028
[6] Lee, M., Fauchet, P. M. (2007). Two-dimensional silicon photonic crystal based biosensing platform for protein detection. Optics Express, 15(8): 4530-4535. https://doi.org/10.1364/OE.15.004530
[7] Dermeche, N., Bouras, M., Abdi-Ghaleh, R., Kahlouche, A., Hocini, A. (2019). Existence of high Faraday rotation and transmittance in magneto photonic crystals made by silica matrix doped with magnetic nanoparticles. Optik, 198: 163225. https://doi.org/10.1016/j.ijleo.2019.163225
[8] Charik, H., Bouras, M., Bennacer, H. (2021). High-sensitive thermal sensor based on a 1D photonic crystal microcavity with nematic liquid crystal. Progress in Electromagnetics Research M, 100: 187-195. https://doi.org/10.2528/PIERM20110404
[9] Grist, S.M., Schmidt, S.A., Flueckiger, J., Donzella, V., Shi, W., Fard, S.T. (2013). Silicon photonic micro-disk resonators for label-free biosensing. Optics Express, 21(7): 7994-8006. https://doi.org/10.1364/OE.21.007994
[10] Claes, T., Molera, J.G., De Vos, K., Schacht, E., Baets, R., Bienstman, P. (2009). Label-free biosensing with a slot-waveguide-based ring resonator in silicon on insulator. IEEE Photonics Journal, 1(3): 197-204. https://doi.org/10.1109/JPHOT.2009.2031596
[11] Claes, T., Molera, J.G., De Vos, K., Schacht, E., Baets, R., Bienstman, P. (2009). Label-free biosensing with a slot-waveguide-based ring resonator in silicon on insulator. IEEE Photonics Journal, 1(3): 197-204. https://doi.org/ 10.1109/JPHOT.2009.2031596
[12] Hu, S., Zhao, Y., Qin, K., Retterer, S.T., Kravchenko, I.I., Weiss, S.M. (2014). Enhancing the sensitivity of label-free silicon photonic biosensors through increased probe molecule density. Acs Photonics, 1(7): 590-597. https://doi.org/10.1021/ph500075g
[13] Densmore, A., Xu, D. X., Janz, S., Waldron, P., Mischki, T., Lopinski, G., Schmid, J.H. (2008). Spiral-path high-sensitivity silicon photonic wire molecular sensor with temperature-independent response. Optics Letters, 33(6): 596-598. https://doi.org/10.1364/OL.33.000596
[14] Kim, K., Murphy, T.E. (2013). Porous silicon integrated Mach-Zehnder interferometer waveguide for biological and chemical sensing. Optics Express, 21(17): 19488-19497. https://doi.org/10.1364/OE.21.019488
[15] Mounir, B., Haouari, C., Saïd, A., Hocini, A. (2019). Analysis of highly sensitive biosensor for glucose based on a one-dimensional photonic crystal nanocavity. Optical Engineering, 58(2): 027102. https://doi.org/10.1117/1.OE.58.2.027102
[16] Yu, H., Xiong, L., Chen, Z., Li, Q., Yi, X., Ding, Y., Ding, Y. (2014). Ultracompact and high sensitive refractive index sensor based on Mach–Zehnder interferometer. Optics and Lasers in Engineering, 56: 50-53. https://doi.org/10.1016/j.optlaseng.2013.12.006
[17] Liu, A., Liao, L., Rubin, D., Basak, J., Chetrit, Y., Nguyen, H., Paniccia, M. (2008). Recent development in a high-speed silicon optical modulator based on reverse-biased PN diode in a silicon waveguide. Semiconductor Science and Technology, 23(6): 064001. https://doi.org/10.1088/0268-1242/23/6/064001
[18] Sung, Y.H., Park, J., Choi, E.S., Lee, H.C., Lee, H. (2019). Improved light extraction efficiency of GaN based blue light emitting diode using nano-scaled patterned sapphire substrate. Journal of Nanoelectronics and Optoelectronics, 14(8): 1189-1193. https://doi.org/10.1166/jno.2019.2647
[19] Lebbal, M.R., Boumaza, T., Bouchemat, M., Hocini, A., Hobar, F., Benghalia, A. (2008). Anisotropy adjustment and thickness of thin layer doped by nanoparticules magnetic for the realization of phase matching between fundamental modes in monomode waveguides. The European Physical Journal-Applied Physics, 42(2): 75-80. https://doi.org/10.1051/epjap:2008033