Tao Li
© 2020 IIETA. This article is published by IIETA and is licensed under the CC BY 4.0 license (http://creativecommons.org/licenses/by/4.0/).
OPEN ACCESS
Gas content measurement is a common technique in the prevention of coalmine gas disasters. During the measurement, the gas desorption amount of field coal samples needs to be obtained by an instrument working under the principle of gas collection by water displacement (GCWD). The instrument is poorly automated, and susceptible to the influence of subjective factors. To overcome these defects, this paper designs an automatic detector of gas desorption, aiming to realize automated detection. Firstly, the authors analyzed the gas desorption detection process, and clarified the contents and features of the information to be collected. On this basis, the hardware and software systems of the multi-data automatic detector were developed based on digital circuit design and multi-sensor detection. To further improve the measuring accuracy of gas desorption, the multi-range multi-stage mode was introduced to the automatic detector. Application results show that the proposed detector can automatedly collect and store gas desorption amount, ambient pressure, and temperature, greatly improve the degree of automation, and minimize the influence of subjective factors. The popularization of this detector will make gas desorption measurement more efficient and effective, laying a solid basis for the prevention of coalmine gas disasters.
gas desorption, multi-sensor detection, ambient pressure, big data storage
China boasts an abundance of coal reserves, and remains the world’s leading coal consumer. In recent years, the proportion of coal in total energy consumption has declined due to environmental protection and many other reasons. In spite of that, coal will continue to dominate China’s energy structure for a long time [1].
Currently, China still faces many safety problems in coal production. The most dangerous problems are gas-related disasters. Therefore, coalmines across the country have adopted various techniques to prevent gas disasters. The determination of gas content is a common way to facilitate the disaster prevention [2-4]. The determination process can be divided into two parts: field measurement of gas desorption, and lab detection of residual gas.
The field measurement is usually implemented with a gas desorption speed tester, which works under the principle of gas collection by water displacement (GCWD). The desorption process generally lasts nearly 2h. Throughout this process, the tester needs to read the scale changes of the GCWD vessel at different time points, record the gas desorption amounts, and calculate the corresponding desorption speeds. Once the desorption completes, the tester needs to record the total amount of gas desorption. In the meantime, the atmospheric pressure and temperature of the field should be captured with relevant instruments [5].
From the captured data, it is possible to derive the amount of gas lost as the coal samples are collected and relocated to the airtight vessel.
The lab detection mainly tests and computes the content of residual gas. The results of lab detection can be combined with those of field measurement to deduce the coal seam gas (CSG) content, which provide an important reference for the formulation of gas disaster prevention measures [6, 7]. However, the results of field measurement are susceptible to subjective factors of the tester, due to the low degree of automation. In many cases, the measured data are not very accurate. This undermines the evaluation accuracy of CSG content, which in turn weakens the effect of coal disaster prevention measures [8, 9].
Some scholars have attempted to solve the above problem. Saghafi [8] probed deep into the uncertainty in the determination of gas content in coal. Zhang et al. [9] summarized the principle and cause of error of the GCWD in the measurement of gas desorption, and proposed a correction algorithm for the error induced by the fluctuation of the water column. Wang et al. [10] experimentally studied the multiple factors affecting the gas desorption in coal. Liu et al. [11] explored the fast and accurate direct measurement of CSG content. An et al. [12] determined the gas content based on gas desorption rate. Li et al. [13] tackled the initial loss of gas desorption in structural coal. Rodrigues et al. [14] investigated the diffusion coefficient of gas in coal. In addition, scholars like Fedorenko et al., Akbari et al., Oleksenko et al., and Hassan and Elkady [15-20] achieved some results on the materials and detection methods of gas sensors.
Despite their innovations, the above studies have not gone beyond the basic detection method of GCWD, failing to develop highly integrated, portable, and operable instruments. Besides, little attention has been paid to improve the whole-process detection accuracy under huge differences in the amount of gas desorption. These defects are solved effectively in this research.
Breaking away from the traditional GCWD method, this paper directly measures ambient pressure, temperature, and real-time amount of gas desorption, with the help of multi-sensor detection. Moreover, system calculation was performed to compute various data, namely, total amount of gas desorption, desorption time, and desorption speed. In this way, the detection process becomes highly automated, minimizing the influence of subjective factors. Furthermore, the gas desorption amount was measured with multi-range multi-stage mode, such as to improve the measuring accuracy.
This paper is mainly composed of two parts: hardware design and software design. The section of hardware design introduces the overall structure and functions of hardware system, and details the design of the control module, data detection module, and data storage module. The section of software design explains the software workflow, and meticulously describes the measurement of gas desorption amount, as well as the data storage and reading processes.
2.1 Overview
As mentioned above, gas desperation is usually determined in two steps: field measurement (coring and testing) and lab detection (crushing and measurement). The hardware system aims to automate the step of field measurement. According to the working principle of the detector, the main data to be collected include the time points of relevant operations, ambient pressure, temperature, the cumulative amount of gas desorption from coal samples, and the corresponding cumulative desorption time. The overall structure (Figure 1) of the hardware system was determined based on the detection object and the working features of the detector.
Figure 1. The overall structure of the hardware system
As shown in Figure 1, the hardware system mainly consists of five modules: control module, data detection module, data storage module, human-computer interaction module, and auxiliary function module.
The control module regulates the overall operation of the system and processes the relevant data and commands; the data detection module, which covers sensors of gas amount, ambient pressure, and temperature, captures such data as gas desorption amount, ambient pressure, and temperature; the data storage module is a large-capacity storage module based on secure digital (SD) card that stores the relevant data involved in system operation; the human-computer interaction module, including keyboard, upper computer interface, and liquid crystal display (LCD), controls the tester’s operations, data display, and data transmission with the upper computer; the auxiliary function module contains auxiliary instruments like the power supply.
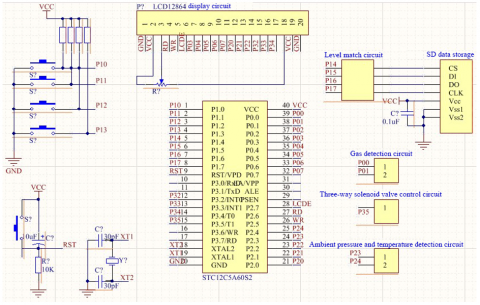
The five modules constitute the core of the automatic detector. Each module works independently and cooperate with other modules to automate the detection process. Figure 2 presents the main circuit diagram of the hardware system. For the lack of space, the details of three modules, namely, the control module, the data detection module, and the data storage module, are provided in the following subsections.
Figure 2. The main circuit diagram of the hardware system
2.2 Control module
The control module is mainly responsible for core works like system operation and data processing. To ensure the smooth operation of the system, the control module must operate at a high speed and provide many ports, allowing multiple external modules to interface the system.
The automatic detector only has three detection objects. Among them, gas desorption amount is the only object in need of real-time detection. Besides, gas desorption is a unique process that does not require a high-performance data detection system. The collected data only need to be displayed and stored in real time. There is no need for other functions to realize long-term real-time operation. Therefore, the hardware system does not raise a high requirement on the performance of the control module. The basic requirements of the system can be satisfied by ordinary 51 series single-chip microcomputers (SCMs)
However, the data storage module saves data in SD card, where the data are stored in data blocks. Each data block is 512B in size, larger than the maximum space (256B) of the random access memory (RAM) in ordinary 512 series SCMs. Expansion is needed to solve the contradiction. But expansion will occupy many port resources, and complicate the circuit design.
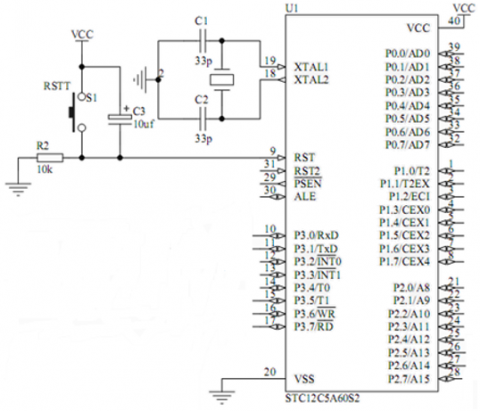
STC12C5A60S2 SCM is fully compatible with the 512 series SCMs, processing all the features of that series. Compared with 512 series SCMs, STC12C5A60S2 SCM boasts high internal RAM (1,280B), fast computing speed (8-12 times that of the series), low power consumption, and strong anti-interference ability. Therefore, this SCM can fully live up to the basic requirements of our hardware system. In addition, the SCM is embedded with eight high-speed analog/digital (A/D) interfaces, eliminating the need for a specially designed A/D conversion circuit for the data detection module. This will simplify the design, reduce the circuit scale, and lower the cost of the hardware system. Suffice it to say that STC12C5A60S2 SCM outshines the 512 series in both cost effectiveness and performance indices. As a result, this SCM was selected as the core of the control module. The minimum system of STC12C5A60S2 SCM is shown in Figure 3.
Figure 3. The minimum system of STC12C5A60S2 SCM
2.3 Data detection module
As a core module of the hardware system, the data detection module is mainly responsible for collecting and converting the relevant data. During the module design, the circuits should be developed according to the sensors of the hardware system (temperature sensor, ambient pressure sensor, and gas sensor), in view of the A/D conversion function in the control module.
2.3.1 Gas detection circuit
The detection of gas desorption amount is the key task of the detector. In actual operation, the coal samples obtained through coring are loaded into a sample tank. Then, an exhaust pipe is connected to the tank, followed by airtightness check. After that, the gas desorption can be measured. During the long desorption period, the amount of gas desorption gradually decreases with the elapse of time. There is a big gap between the early and late desorption speeds.
In the early stage, the coal samples have high adsorbed gas pressure and gas content, due to the short exposure. Therefore, a large amount of gas could be desorbed rapidly in this stage. The desorption speed can reach 300mL/min. As the desorption progresses, the speed and amount of desorption show a clear downward trend. In the middle and late stage, a very small amount of gas is desorbed at a slow speed. The later desorption speed is slower than 10mL/min.
Theoretically, a gas sensor with a range of 400mL/min is sufficient to meet the requirement of our system. Nevertheless, empirical evidence indicates that the detection accuracy is generally one tenth of the detection range. Hence, the gas sensor can no longer provide the required detection accuracy, when the gas desorption speed falls below 40mL/min. To solve the problem, this paper adopts a two-stage detection mode in the design of the gas detection circuit (Figure 4).
As shown in Figure 4, the gas detection circuit employs the two-stage detection mode. The sample tank is connected to channels 1 and 2 via a three-way solenoid valve. Each channel has a gas sensor, with significantly different ranges. With a relatively large range, the sensor in channel 1 is responsible for early and midterm detection; with a relatively small range, the sensor in channel 2 is responsible for midterm and late detection.
During the detection, the control module selects between the two sensors according to the desorption speed, and switches to the corresponding sensor via the three-way solenoid valve. If the desorption speed is below 40mL/min, channel 2 will be adopted. The data captured by the sensor will be sent to the control module via the A/D input port. When the channel is switched, the data transmission port will also be adjusted. To reduce the data error induced by channel switching, the last data of the original channel will be kept until the new channel returns valid data.
Figure 4. The gas detection circuit
2.3.2 Ambient pressure and temperature detection circuit
Considering the sensitivity of gas amount to ambient pressure and temperature, the desorption amount cannot be measured accurately without detecting the ambient pressure and temperature of the detection site. Traditionally, the two parameters are directly measured by barometers and thermometers, and read by the tester. In this paper, an automatic ambient pressure and temperature detection circuit is designed and integrated to the hardware system, with the aim to automate the detection process, cut down the workload, and minimize the influence of subjective factors.
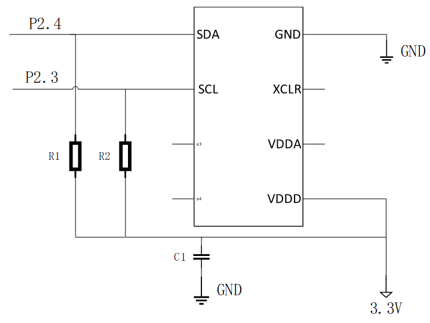
The ambient pressure can be detected by many tools, such as liquid column pressure gauge, elastic pressure gauge, and electrical pressure gauge. This paper chooses a BMP085 barometric pressure sensor (Bosch, Germany), which is extended from the digital sensor for microelectromechanical systems (MEMS). This lightweight resistive sensor has advantages like high sensitivity, low power consumption, high detection accuracy (3Pa), and wide measuring range (30-110kPa). Besides ambient pressure, BMP085 can effectively measure ambient temperature. The versatility fully meets the requirements of our detector: the ambient pressure in the coalmine is slightly lower than that on the ground, due to the extractive ventilation system. The ambient pressure and temperature detection circuit is illustrated in Figure 5.
As shown in Figure 5, the BMP085 communicates with the control module under the Inter-Integrated Circuit (I2C) serial protocol. That is, the data line (SDA) and clock line (SCL) pins of BMP085 are connected to P2.4 and P2.3 of the SCM, respectively. The SCM generates the analog I2C communication sequence at P2.4, and the data collected by BMP085 are received by P2.3. The data on temperature and ambient pressure are respectively received through the system software, waiting to be processed by the control module [21]. Since the detector does not require real-time data on ambient pressure or temperature, the effectiveness of the BMP085 only needs to be checked once before each detection task. During the check, the mean of three consecutive measurements is computed for verification.
Figure 5. The ambient pressure and temperature detection circuit
2.3.3 Data storage module
As mentioned before, it takes a long time (about 2h) for gas to be desorbed from the coal samples. The desorption time may change with the actual conditions. A huge amount of test data is collected through the long desorption process. Moreover, multiple tests are performed in each field trip, because the field measurement is always followed by lab detection. Thus, it is necessary to design a large-scale data storage module for the detector.
Lee et al. Paszkiel et al. and Gibbons [22-25] have explored extensively into the storage and retrieval of big data. The SD card stands out from various storage methods for its small size, large capacity, low price, fast read/write, limited power consumption, and maturity. Considering the cost factor and design needs, this paper adopts SD card to store the collected data.
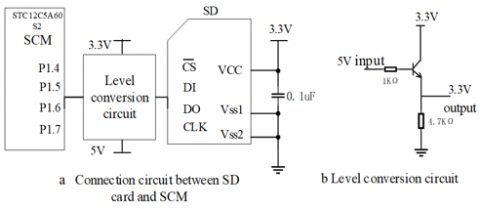
The SD card supports two kinds of bus modes: SD mode, and serial peripheral interface (SPI) mode. None of them is available in STC series SCMs. Software simulation is needed to provide the communication port between SD card and the selected SCM [26, 27]. The SD card-SCM connection circuit is shown in Figure 6(a).
Furthermore, the logic level of the port of the selected MCU is 5V, higher than that of the SD card (3.3V). If the two components are directly connected, the SD card might be burned due to excessively high intervening voltage. Hence, a level conversion circuit (Figure 6(b)) was designed to solve the power supply matching problem between them, and ensure the safety of connection [28].
Figure 6. The connection circuit between SD card and control module
The software system was developed interpedently on Keil C51 C Compiler (Keil Software, US). The compiler provides a C-language software development system, creating a favorable programming environment for 51 series SCM software. Corresponding to the hardware design, the software design contains the design of multiple subsystems, such as detection, display, keyboard, and data storage. The detection and storage of desorption data are the core of the entire system. The software compilation of these two subsystems are detailed below.
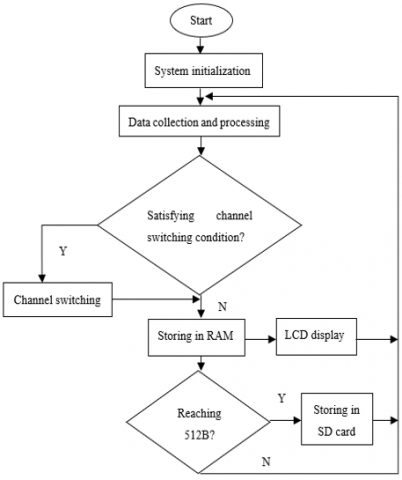
3.1 Desorption data detection
During data detection, the first step is to initialize the system and zeroize the data in each link. Once the detection channels are open, the system starts to collect data from the large-range channel by default. The gas sensor converts the desorption amount into an analog signal, which will be converted into a digital signal through the A/D interface of the SCM. Then, the control module obtains the desorption amount corresponding to the current data by looking up the table, marking the completion of a cycle of data collection.
After each cycle, the detection data will be displayed and stored. Besides, the data will be compared with the preset value of 40mL/min to see if the detection channel needs to be changed. If there is no need for switching, the data will be recorded without switching the channel, and the next cycle of data collection will begin. Otherwise (the desorption amount is smaller than 40mL/min), the data will be recorded, and the P35 port will be set to the high level by the control module; then, the three-way solenoid valve will act to switch to the low-range channel.
During data recording, the SD read and write subroutine is called to enter the desorption amount, as well as the corresponding cumulative time and other data. If the data is zero for 10 consecutive minutes, the system will automatically terminate this current cycle. The flow chart of the data detection subsystem is shown in Figure 7.
Figure 7. The flow chart of data detection subsystem
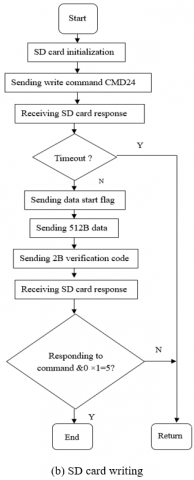
Figure 8. The flow chart of SD card data storage
3.2 SD card data storage
After powered on, the SD card subsystem must be initialized first. By default, the subsystem will immediately enter the SD mode. The SD mode must be switched to the SPI mode, using the chip select signal, and a series of commands should be executed to confirm that the subsystem has been initialized.
During data read/write, a 512B buffer block should be prepared in the control module, because the data in the SD card are processed in 512B data blocks. The read/write operation is performed once the data being transmitted reaches the number of bytes. After the data operation complete signal is received, the next cycle will immediately begin. The flow chart of SD card data storage is explained in Figure 8.
To solve the lack of automatic detectors for gas content, this paper designs an automatic detector of gas desorption amount in coal samples obtained through field drilling. The main features of the device are as follows:
(1) Considering the large gap between early and late desorption speeds and amounts, the two-range two-stage mode was adopted to automatically select the better channel for measurement, depending on the changing amount of gas desorption. In this way, the detection accuracy can be maintained a high level throughout the desorption process.
(2) Considering the sheer volume of data generated by the repeated, time-consuming field detections, the SD card storage subsystem was designed to rapidly store massive data in a reliable manner. This storage model facilitates the data display, and the data processing back in lab.
(3) Multiple sensors were integrated to the hardware system to automatically collect multiple parameters, improve the degree of automation of underground detection, and reduce the workload of the tester.
Experimental results demonstrate that the proposed detector boasts high detection accuracy, simple and convenient operation, safe and reliable work, and strong anti-interference ability. It is worthy to be promoted in field measurement of gas desorption in coal samples.
[1] Shi, Y.D., Angus, G. (2020). Special Report 4: China’s Energy System Revolution. In: Shell International B.V., The Development Research Center (DRC) of the State Council of the People’s Republic of China (eds) China's Energy Revolution in the Context of the Global Energy Transition. Advances in Oil and Gas Exploration & Production. Springer, Cham. https://doi.org/10.1007/978-3-030-40154-2_5
[2] Zhou, H.X., Dai, H., Ge, C. (2016). Quality and quantity of pre-drainage methane and responding strategies in Chinese outburst coal mines. Arab J Geosci, 9(6): 445. https://doi.org/10.1007/s12517-016-2488-5
[3] Booth, P., Brown, H.K., Nemcik, J., Ting, R. (2017). Spatial context in the calculation of gas emissions for underground coal mines. International Journal of Mining Science and Technology, 27(5). https://doi.org/10.1016/j.ijmst.2017.07.007
[4] Ulyanova, E.V., Malinnikova, O.N., Dolgova, M.O., Zverev, I.V., Burchak, A.V., Molchanov, A.N., Pichka, T.V., Chemistry, S.F. (2016). Structure and methane content of fossil coals. Solid Fuel Chem, 50: 207-212. https://doi.org/10.3103/S0361521916040108
[5] Saghafi, A. (2019). Determination of the gas content of coal. in NAJ Aziz and Bob Kininmonth (eds.), Proceedings of the 2016 Coal Operators' Conference, Mining Engineering. University of Wollongong, pp. 18-20. https://ro.uow.edu.au/coal/621
[6] Skoczylas, N., Wierzbicki, M., Kudasik, M. (2019). A simple method for measuring basic parameters of the coal-methane system under mining conditions. J Min Sci, 54: 522-533. https://doi.org/10.1134/S1062739118033953
[7] Newell, K.D. (2007). Wellsite, laboratory, and mathematical techniques for determining sorbed gas content of coals and gas shales utilizing Well Cuttings. Nat Resour Res, 16: 55-66. https://doi.org/10.1007/s11053-007-9031-z
[8] Saghafi, A. (2017). Discussion on determination of gas content of coal and uncertainties of measurement. International Journal of Mining Science and Technical, 27(5): 741-748. https://doi.org/10.1016/j.ijmst.2017.07.02
[9] Zhang, X.L., Zai, J., Zhang, B.L. (2013). Error analysis of measuring gas desorption amount with draining water gathering gas method. Safety in Coal Mines, 44(7): 151-153.
[10] Wang, F.K., Liang, Y.P., Li, L., Li, J.G., Chen, Y.L. (2019). Orthogonal experimental study on multifactor conditions for gas desorption in coal. Advances in Civil Engineering. https://doi.org/10.1155/2019/3028721
[11] Liu, Y.W., Du, Y., Li, Z.Q., Zhao, F.J., Zuo, W.Q., Wei, J.P., Mitri, H. (2020). A rapid and accurate direct measurement method of underground coal seam gas content based on dynamic diffusion theory. International Journal of Mining Science and Technology, 30(6): 799-810. https://doi.org/10.1016/j.ijmst.2020.07.004
[12] An, F.H., Yuan, Y., Chen, X.J. (2019). A new method for gas content determination based on gas desorption ratio. Safety in Coal Mines, 50(9): 34-37. https://doi.org/10.13347/j.cnki.mkaq.2019.09.010
[13] Li, X.B., Li, Y.B., Tang, J.T. (2019). Determining the initial stage loss content of tectonic coal gas desorption via the Bayesian probability method. Nat Hazards, 97: 83-97. https://doi.org/10.1007/s11069-019-03627-y
[14] Rodrigues, C.F., Dinis, M.A.P., de Sousa, M.J. (2016). Gas diffusion coefficient in coal: Calculation of tangent slope accuracy through the inflection point determination. J Min Sci, 52: 87-101. https://doi.org/10.1134/S1062739116010162
[15] Fedorenko, G., Oleksenko, L., Maksymovych, N., Skolyar, G., Ripko, O. (2017). Semiconductor gas sensors based on Pd/SnO2 nanomaterials for methane detection in air. Nanoscale Res Lett, 12: 329. https://doi.org/10.1186/s11671-017-2102-0
[16] Akbari, E., Buntat, Z., Afroozeh, A., Zeinalinezhad, A., Kiani, M.J., Abadi, M.H.S. (2016). Analytical investigations of gas-sensor using methane decomposition system. Environ Earth Sci, 75: 420. https://doi.org/10.1007/s12665-015-4943-0
[17] Oleksenko, L.P., Fedorenko, G.V., Maksymovych, N.P. (2019). Highly sensitive to methane sensor materials based on Nano-Pd/SnO2. Theor Exp Chem, 55: 132-136. https://doi.org/10.1007/s11237-019-09604-7
[18] Hassan, H.S., Elkady, M.F. (2020). Semiconductor nanomaterials for gas sensor applications. In: Dasgupta N., Ranjan S., Lichtfouse E. (eds) Environmental Nanotechnology, Volume 3. Environmental Chemistry for a Sustainable World, vol 27. Springer, Cham. https://doi.org/10.1007/978-3-030-26672-1_10
[19] Gerdroodbary, M.B., Ganji, D.D., Shiryanpour, I., Moradi, R. (2018). Mass analysis of CH4/SO2 gas mixture by low-pressure MEMS gas sensor. Journal of Natural Gas Science and Engineering, 53: 317-328. https://doi.org/10.1016/j.jngse.2018.03.002
[20] Bunpang, K., Wisitsoraat, A., Tuantranont, A., Singkammo, S., Phanichphant, S., Liewhiran, C. (2019). Highly selective and sensitive CH4 gas sensors based on flame-spray-made Cr-doped SnO2 particulate films. Sensors and Actuators B: Chemical, 291: 177-191. https://doi.org/10.1016/j.snb.2019.04.049
[21] Wang, J.C., Wang, F.P., Hou, R.F., Wang, C. (2011). Design of a portable altitude measurement system based on BMP085. Transducer and Microsystem Technologies, 30(12): 123-125. https://doi.org/10.3969/j.issn.1000-9787.2011.12.037
[22] Lee, D., Ryu, J., Shin, H. (2015). Scalable management of storage for massive quality-adjustable sensor data. Computing, 97: 769-793. https://doi.org/10.1007/s00607-015-0465-6
[23] Lee D. (2017). Big sensor data acquisition and archiving with compression. In: Suh S., Anthony T. (eds) Big Data and Visual Analytics. Springer, Cham. https://doi.org/10.1007/978-3-319-63917-8_7
[24] Paszkiel, S., Szpulak, P. (2018). Methods of acquisition, archiving and biomedical data analysis of brain functioning. In: Hunek W., Paszkiel S. (eds) Biomedical Engineering and Neuroscience. BCI 2018. Advances in Intelligent Systems and Computing, vol 720. Springer, Cham. https://doi.org/10.1007/978-3-319-75025-5_15
[25] Gibbons, P.B. (2018) Data Storage and Indexing in Sensor Networks. In: Liu L., Özsu M.T. (eds) Encyclopedia of Database Systems. Springer, New York, NY. https://doi.org/10.1007/978-1-4614-8265-9_112
[26] Banerjee, S., Mukhopadhyay, S. (2016). A low cost and fast controller architecture for multimedia data storage and retrieval to flash-based storage device. J Embedded Systems, 24: 2017. https://doi.org/10.1186/s13639-016-0060-8
[27] Mujčić, E., Drakulić, U., Škrgić, M. (2018). Smart Parking System Based on Arduino SD Card Ajax Web Server. In: Hadžikadić M., Avdaković S. (eds) Advanced Technologies, Systems, and Applications II. IAT 2017. Lecture Notes in Networks and Systems, vol 28. Springer, Cham. https://doi.org/10.1007/978-3-319-71321-2_64
[28] Kanza, Y., Yaari, H. (2016). External sorting on flash storage: reducing cell wearing and increasing efficiency by avoiding intermediate writes. The VLDB Journal, 25: 495-518. https://doi.org/10.1007/s00778-016-0426-5